Drawing Box Plots from Cumulative Frequency Diagrams WORKSHEET
Suitable for Year groups: Year 10, Year 11
GCSE Tier: Higher
Targeting grades: 6-7
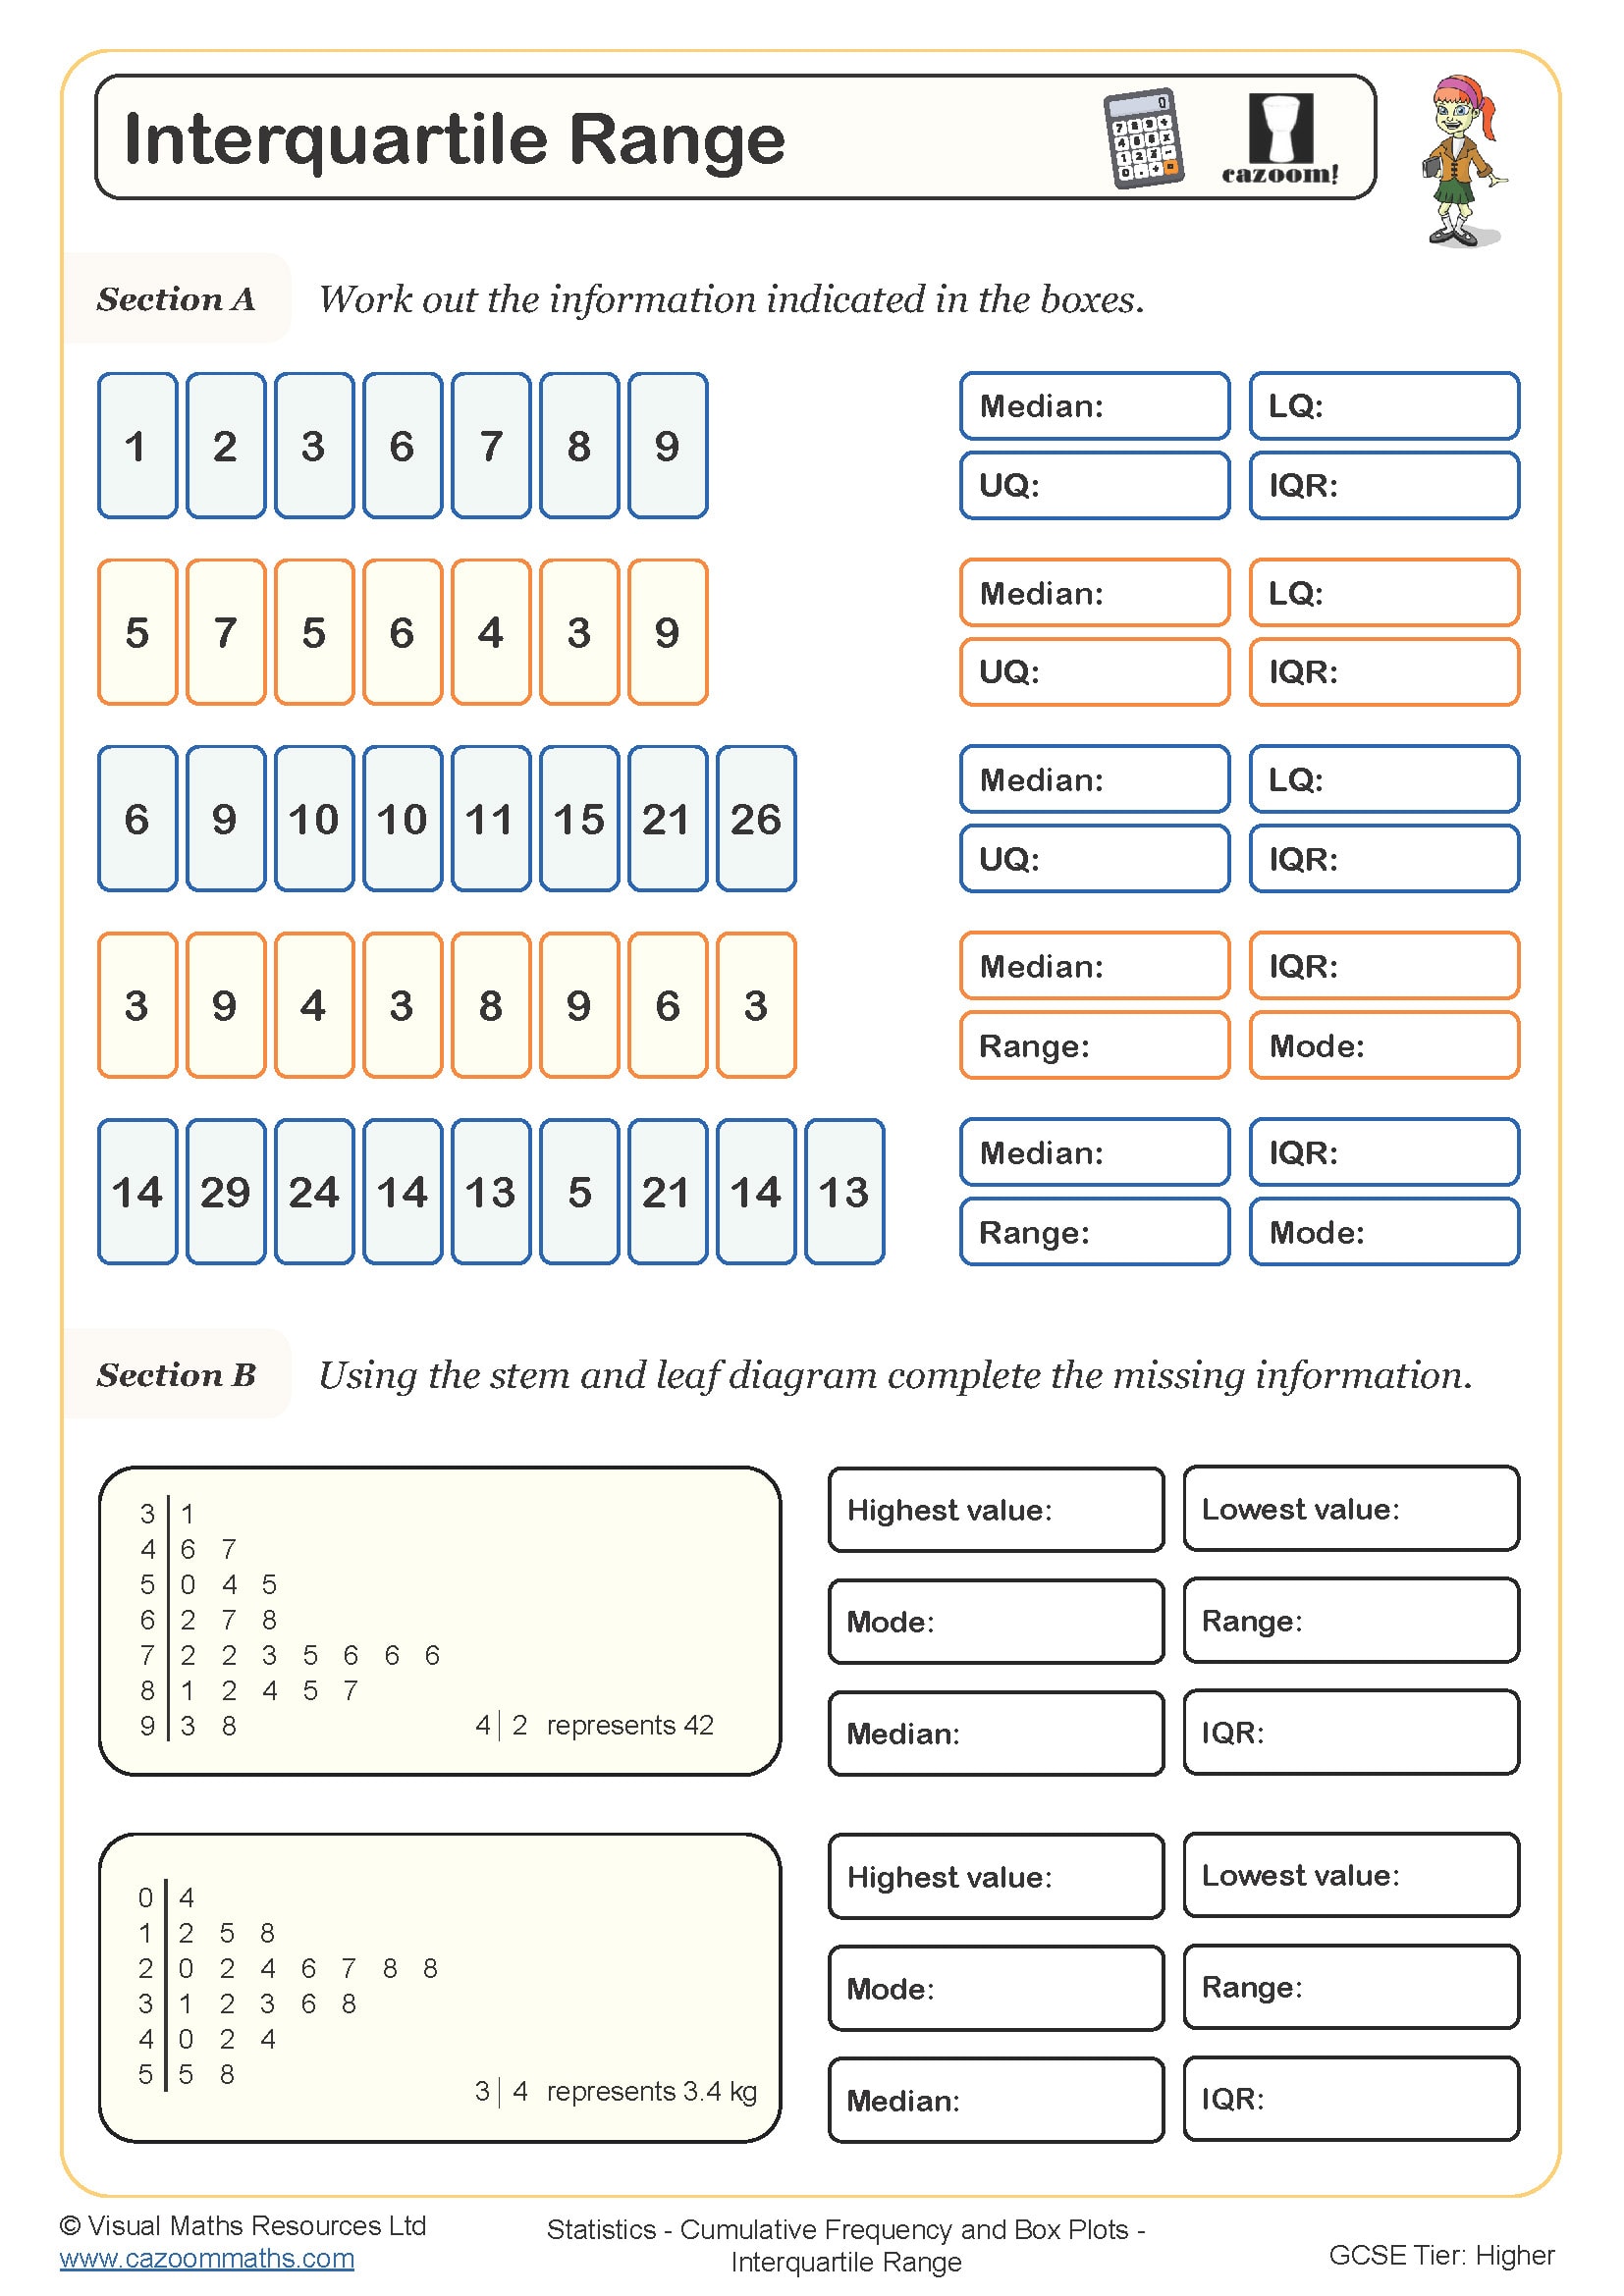
Prerequisite knowledge: Grouped frequency distributions, coordinates, box plots, averages and range.
Learning Objective: Constructing box plots from cumulative frequency diagrams
Drawing Box Plots from Cumulative Frequency Diagrams WORKSHEET DESCRIPTION
This worksheet is designed to help build the skill of drawing a box plot from a cumulative frequency diagram.
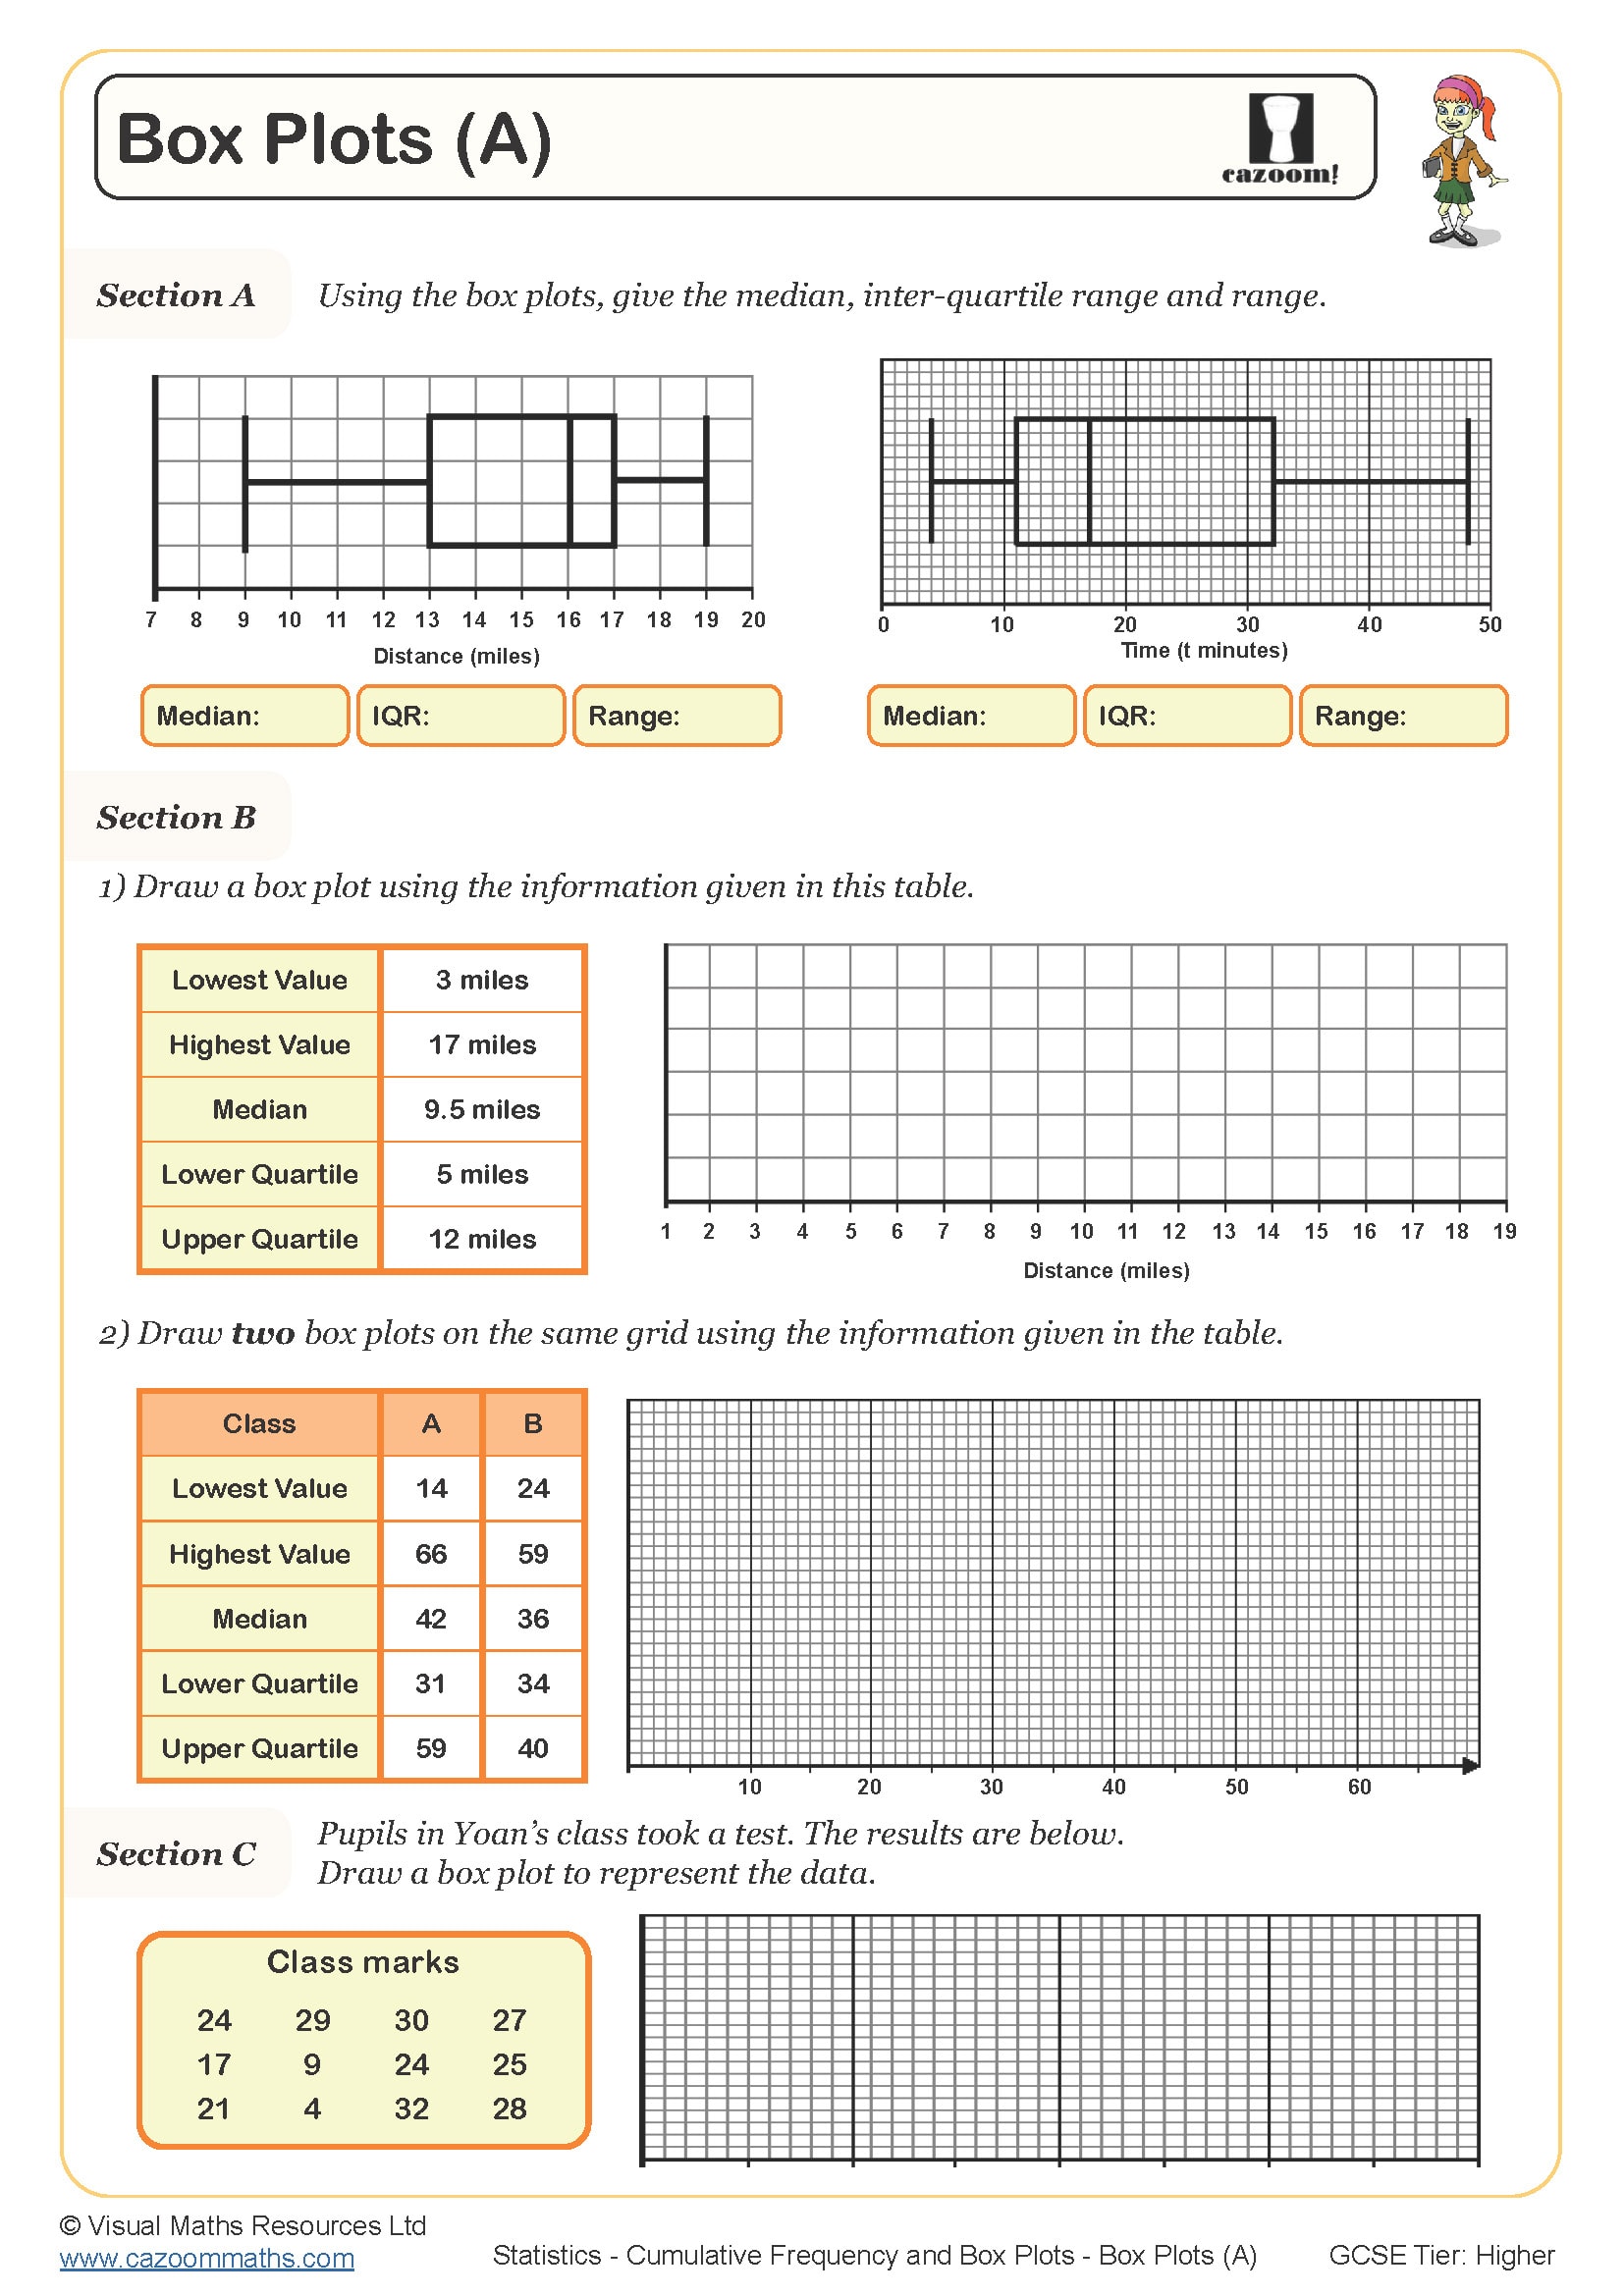
In section A, learners are given two cumulative frequency diagrams and below each one is a separate axes for box plot.
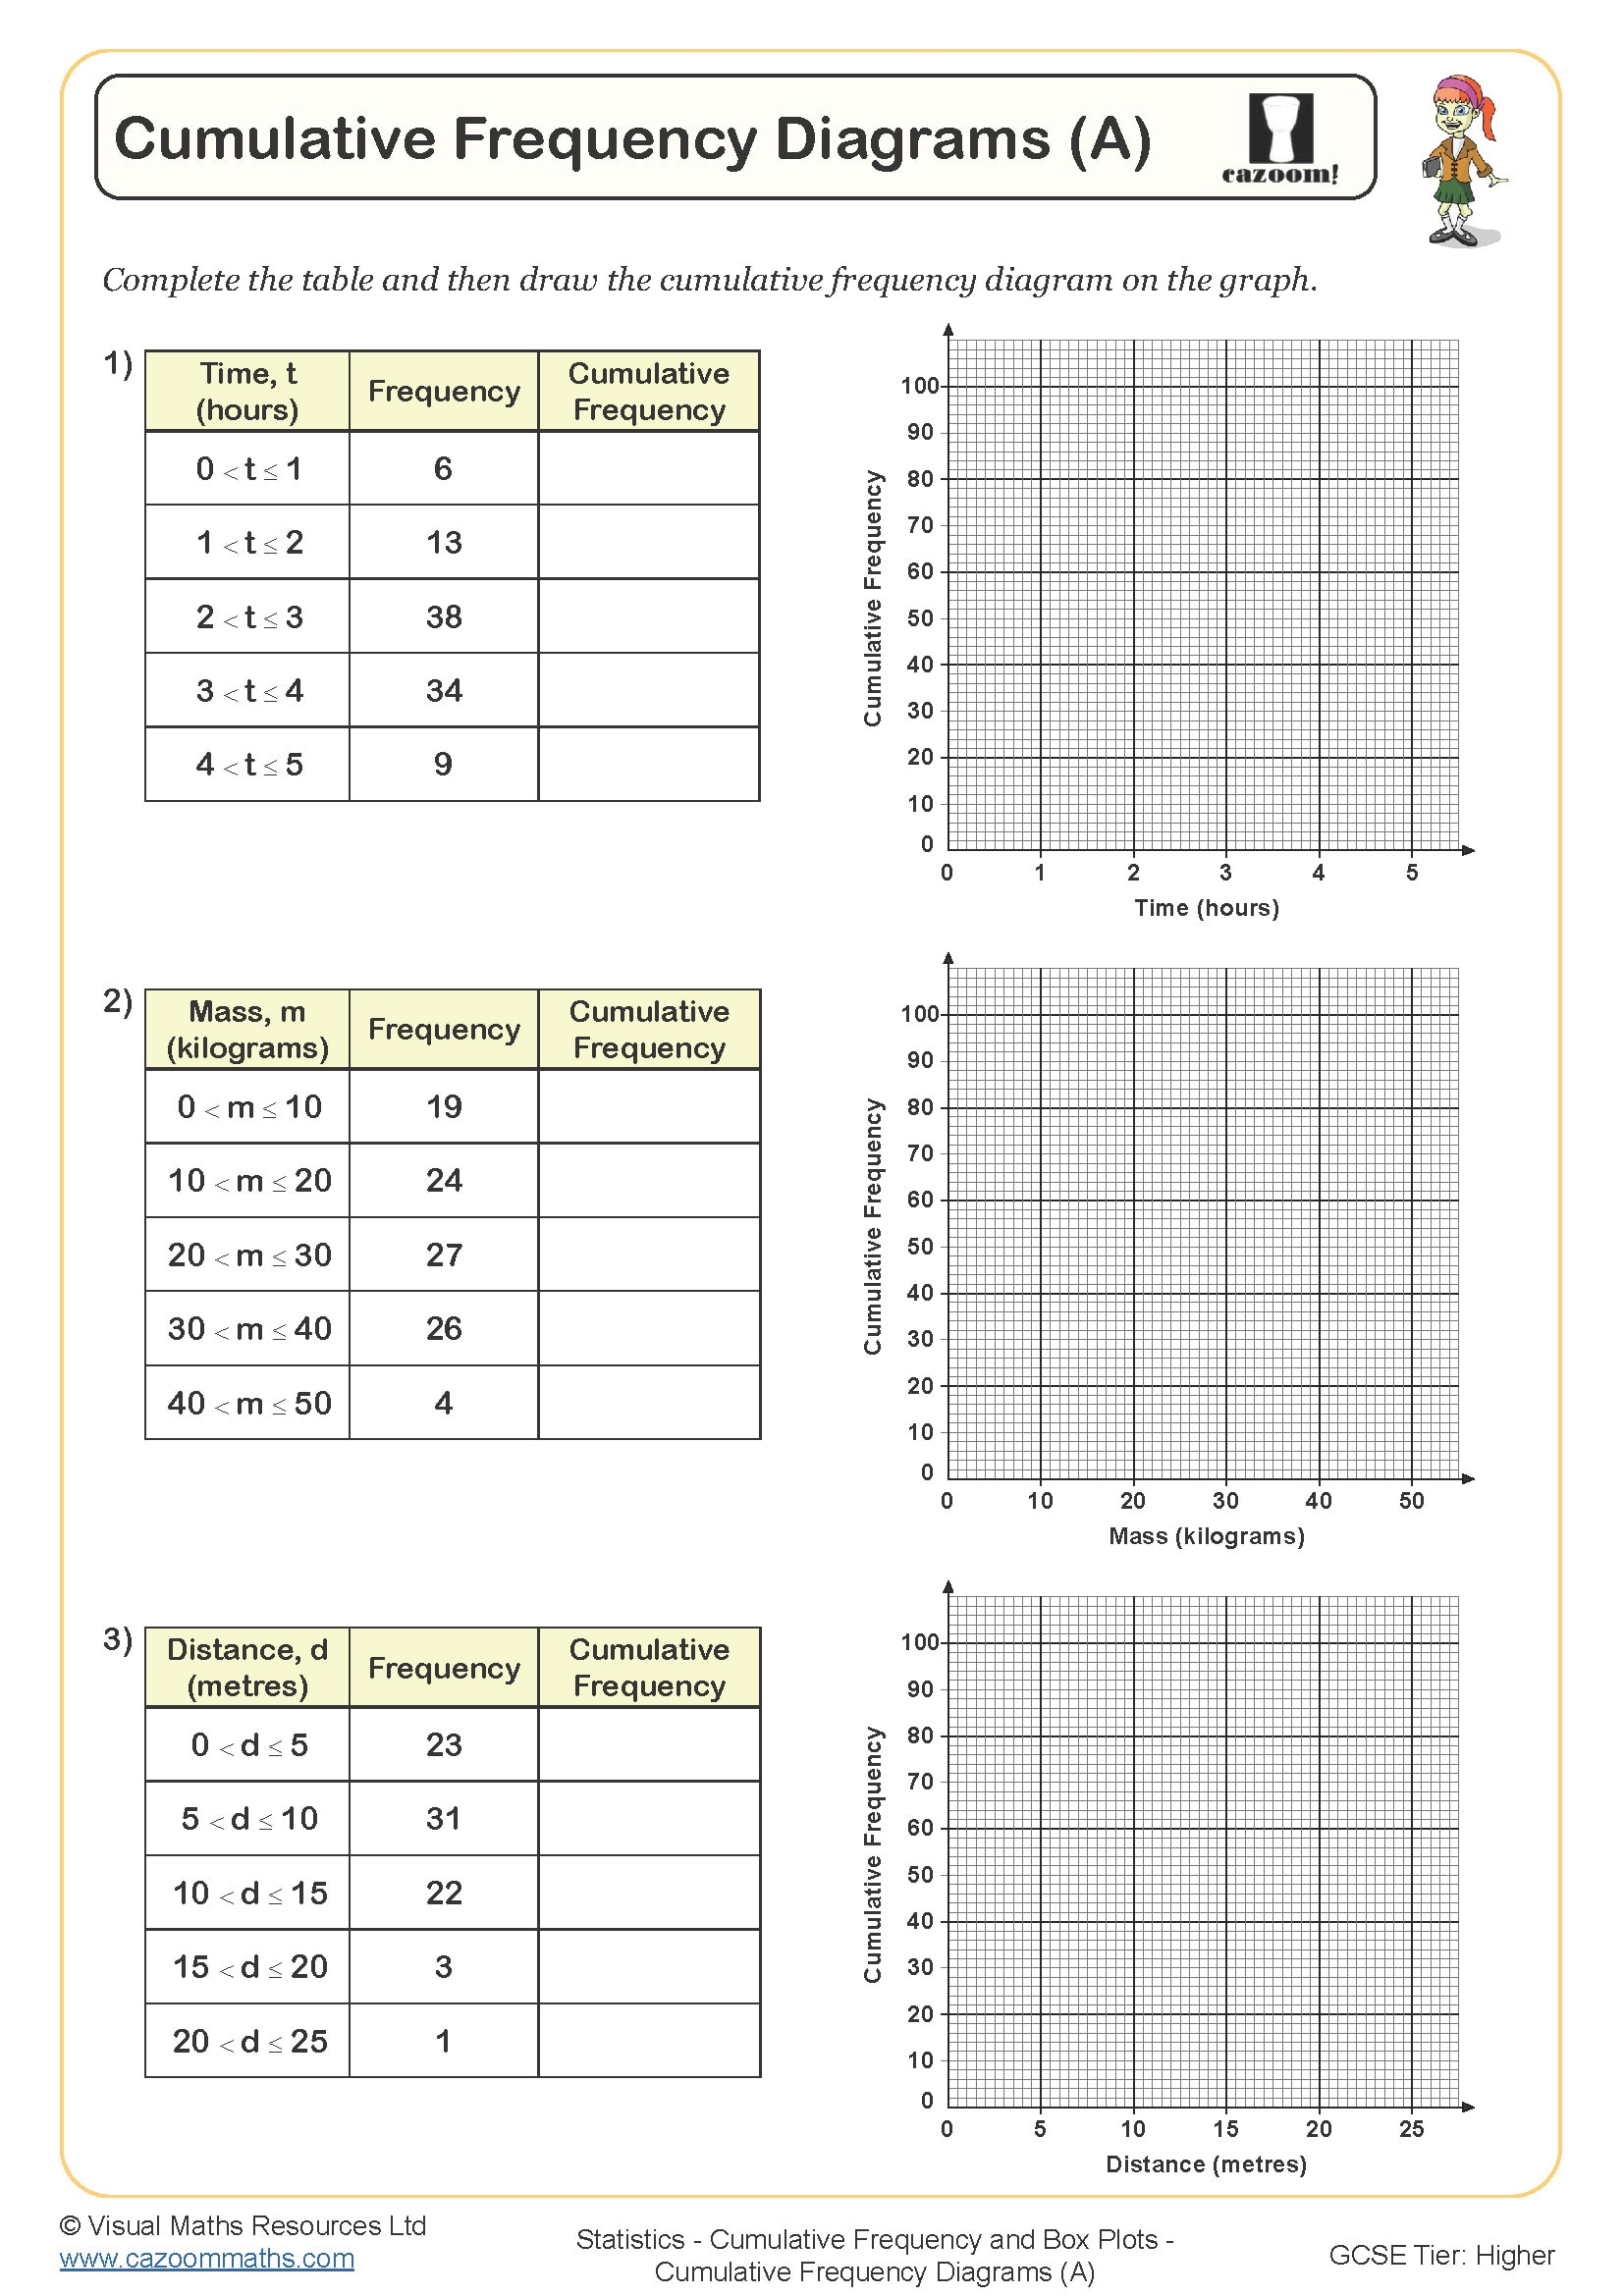
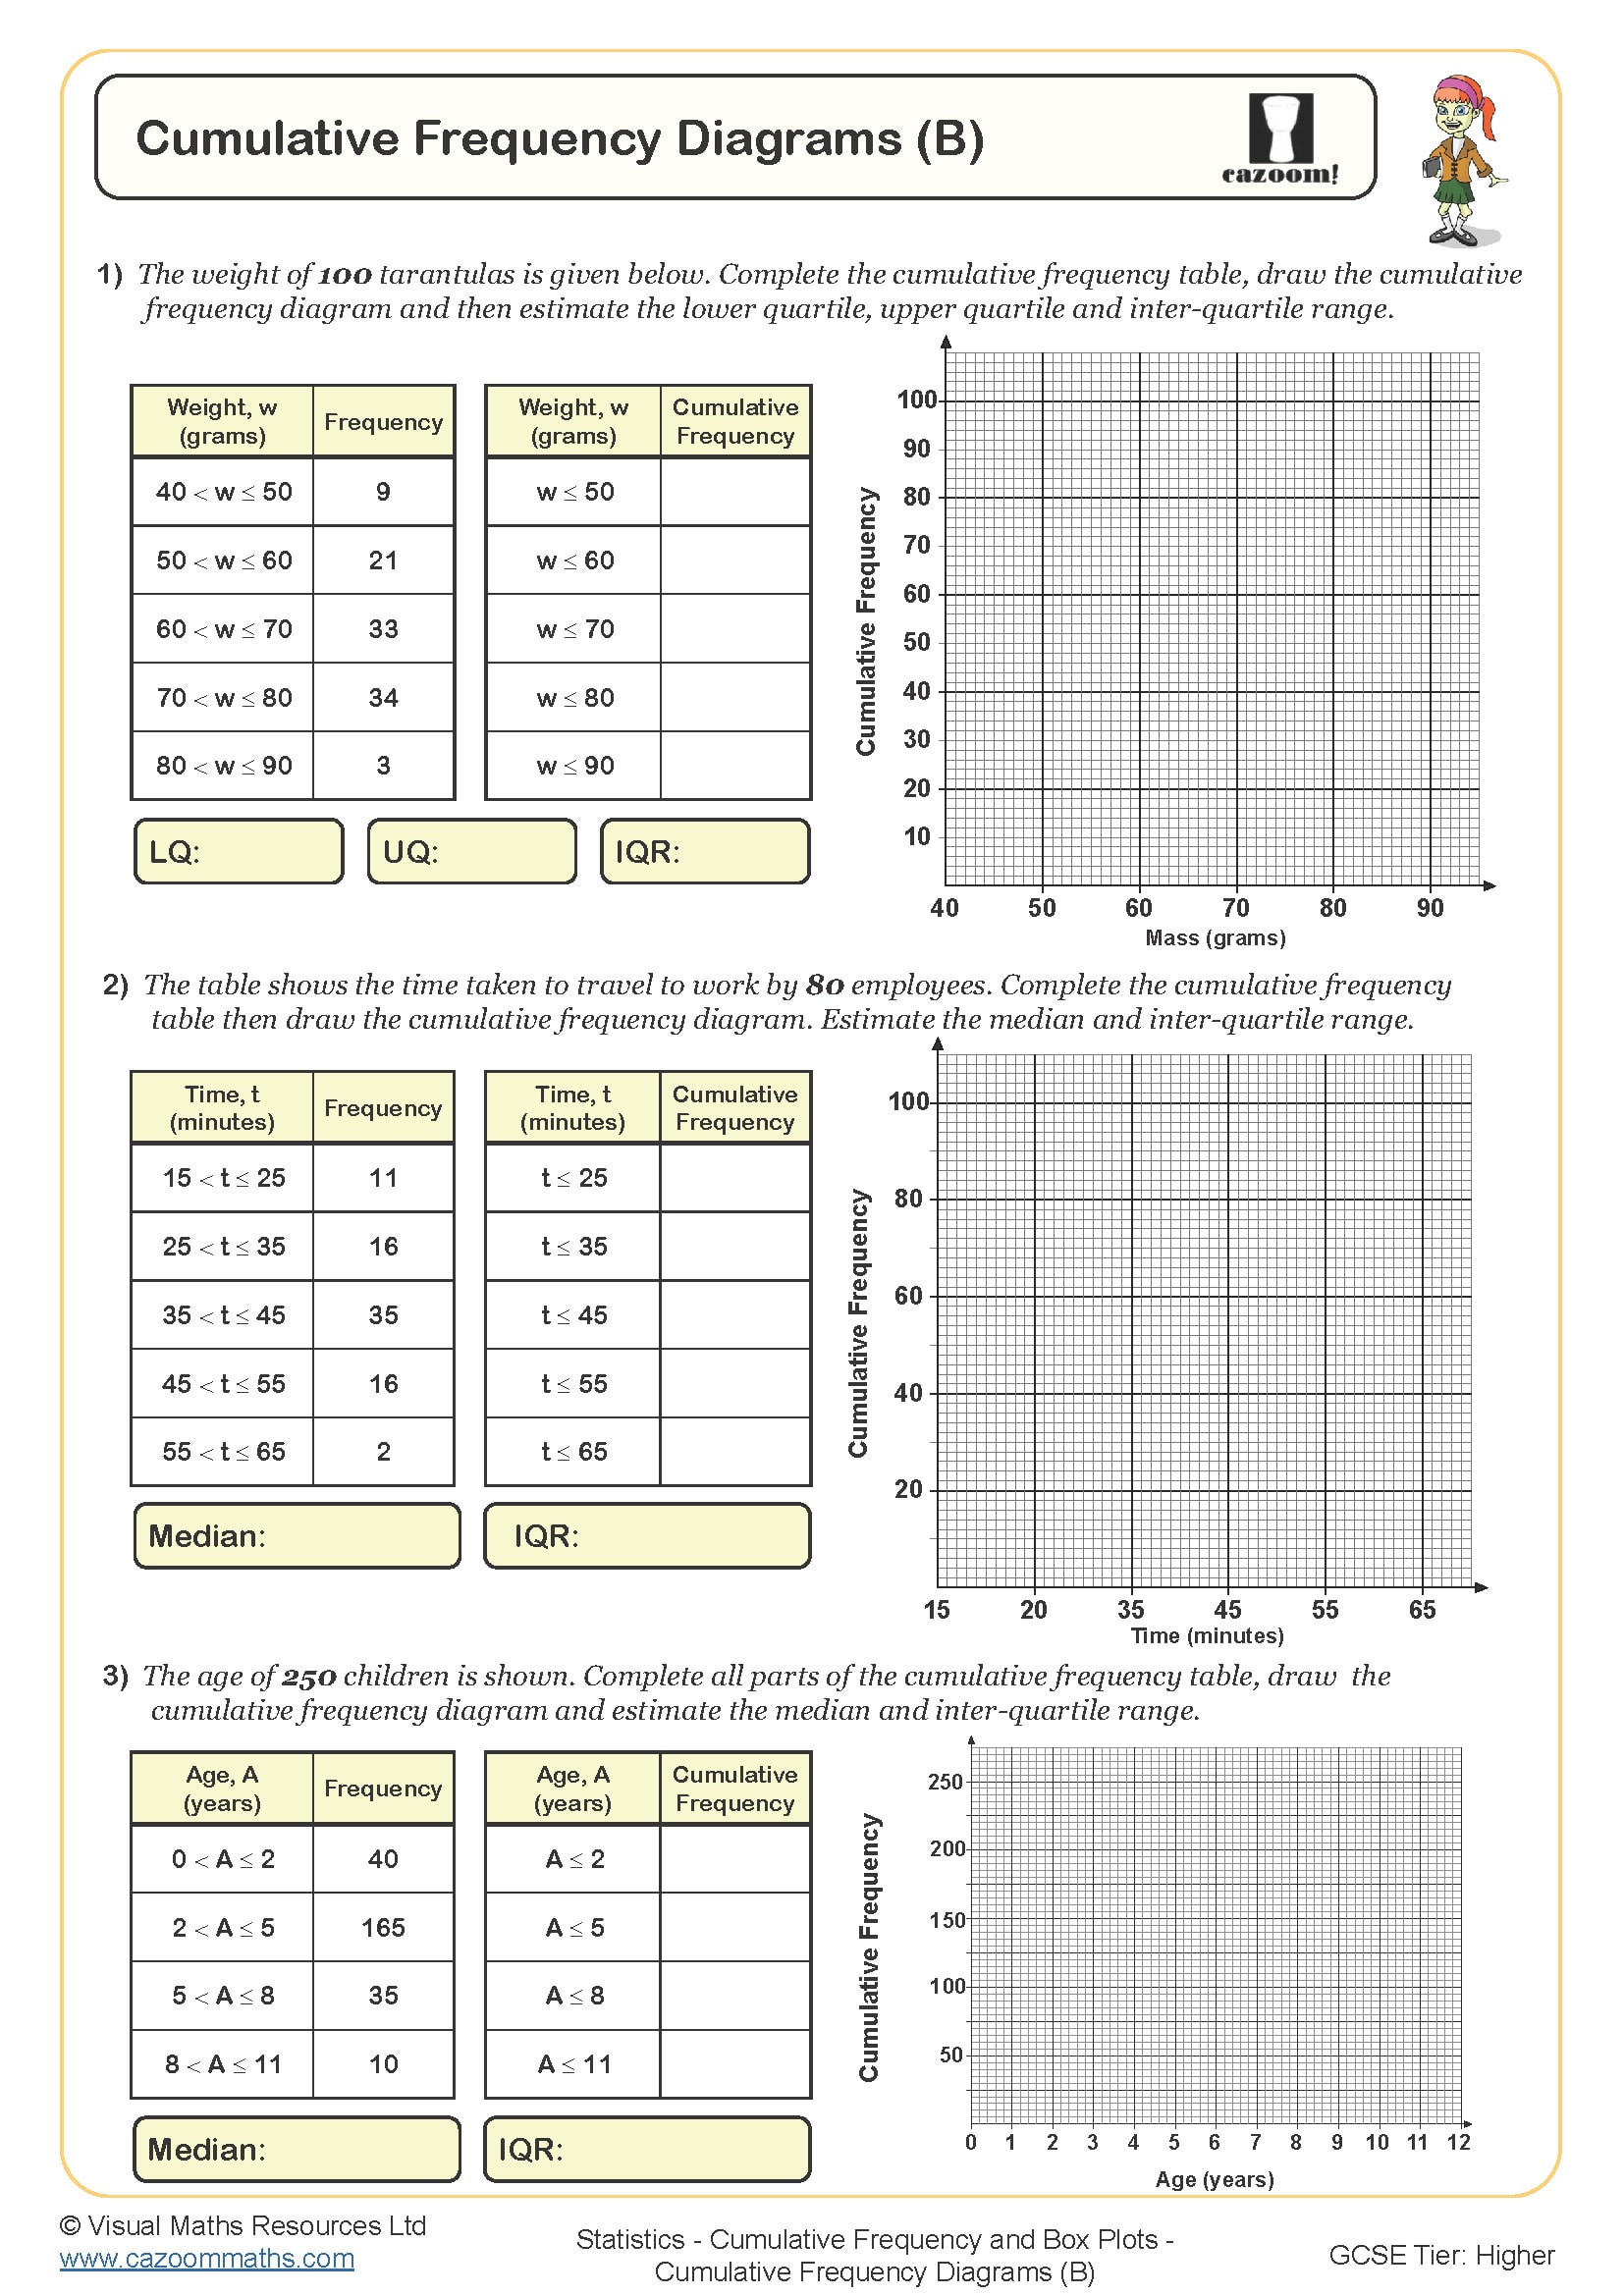
In section B, learners are given a grouped frequency table and leaners need to draw a cumulative frequency diagram before then constructing a box plot.
All worksheets are created by the team of experienced teachers at Cazoom Maths.

RELATED TO Drawing Box Plots from Cumulative Frequency Diagrams WORKSHEET
Frequently Asked Questions
Constructing box plots from cumulative frequency diagrams