Charge Graphs Worksheets
All worksheets are created by the team of experienced teachers at Cazoom Maths.
What are charge graphs in maths?
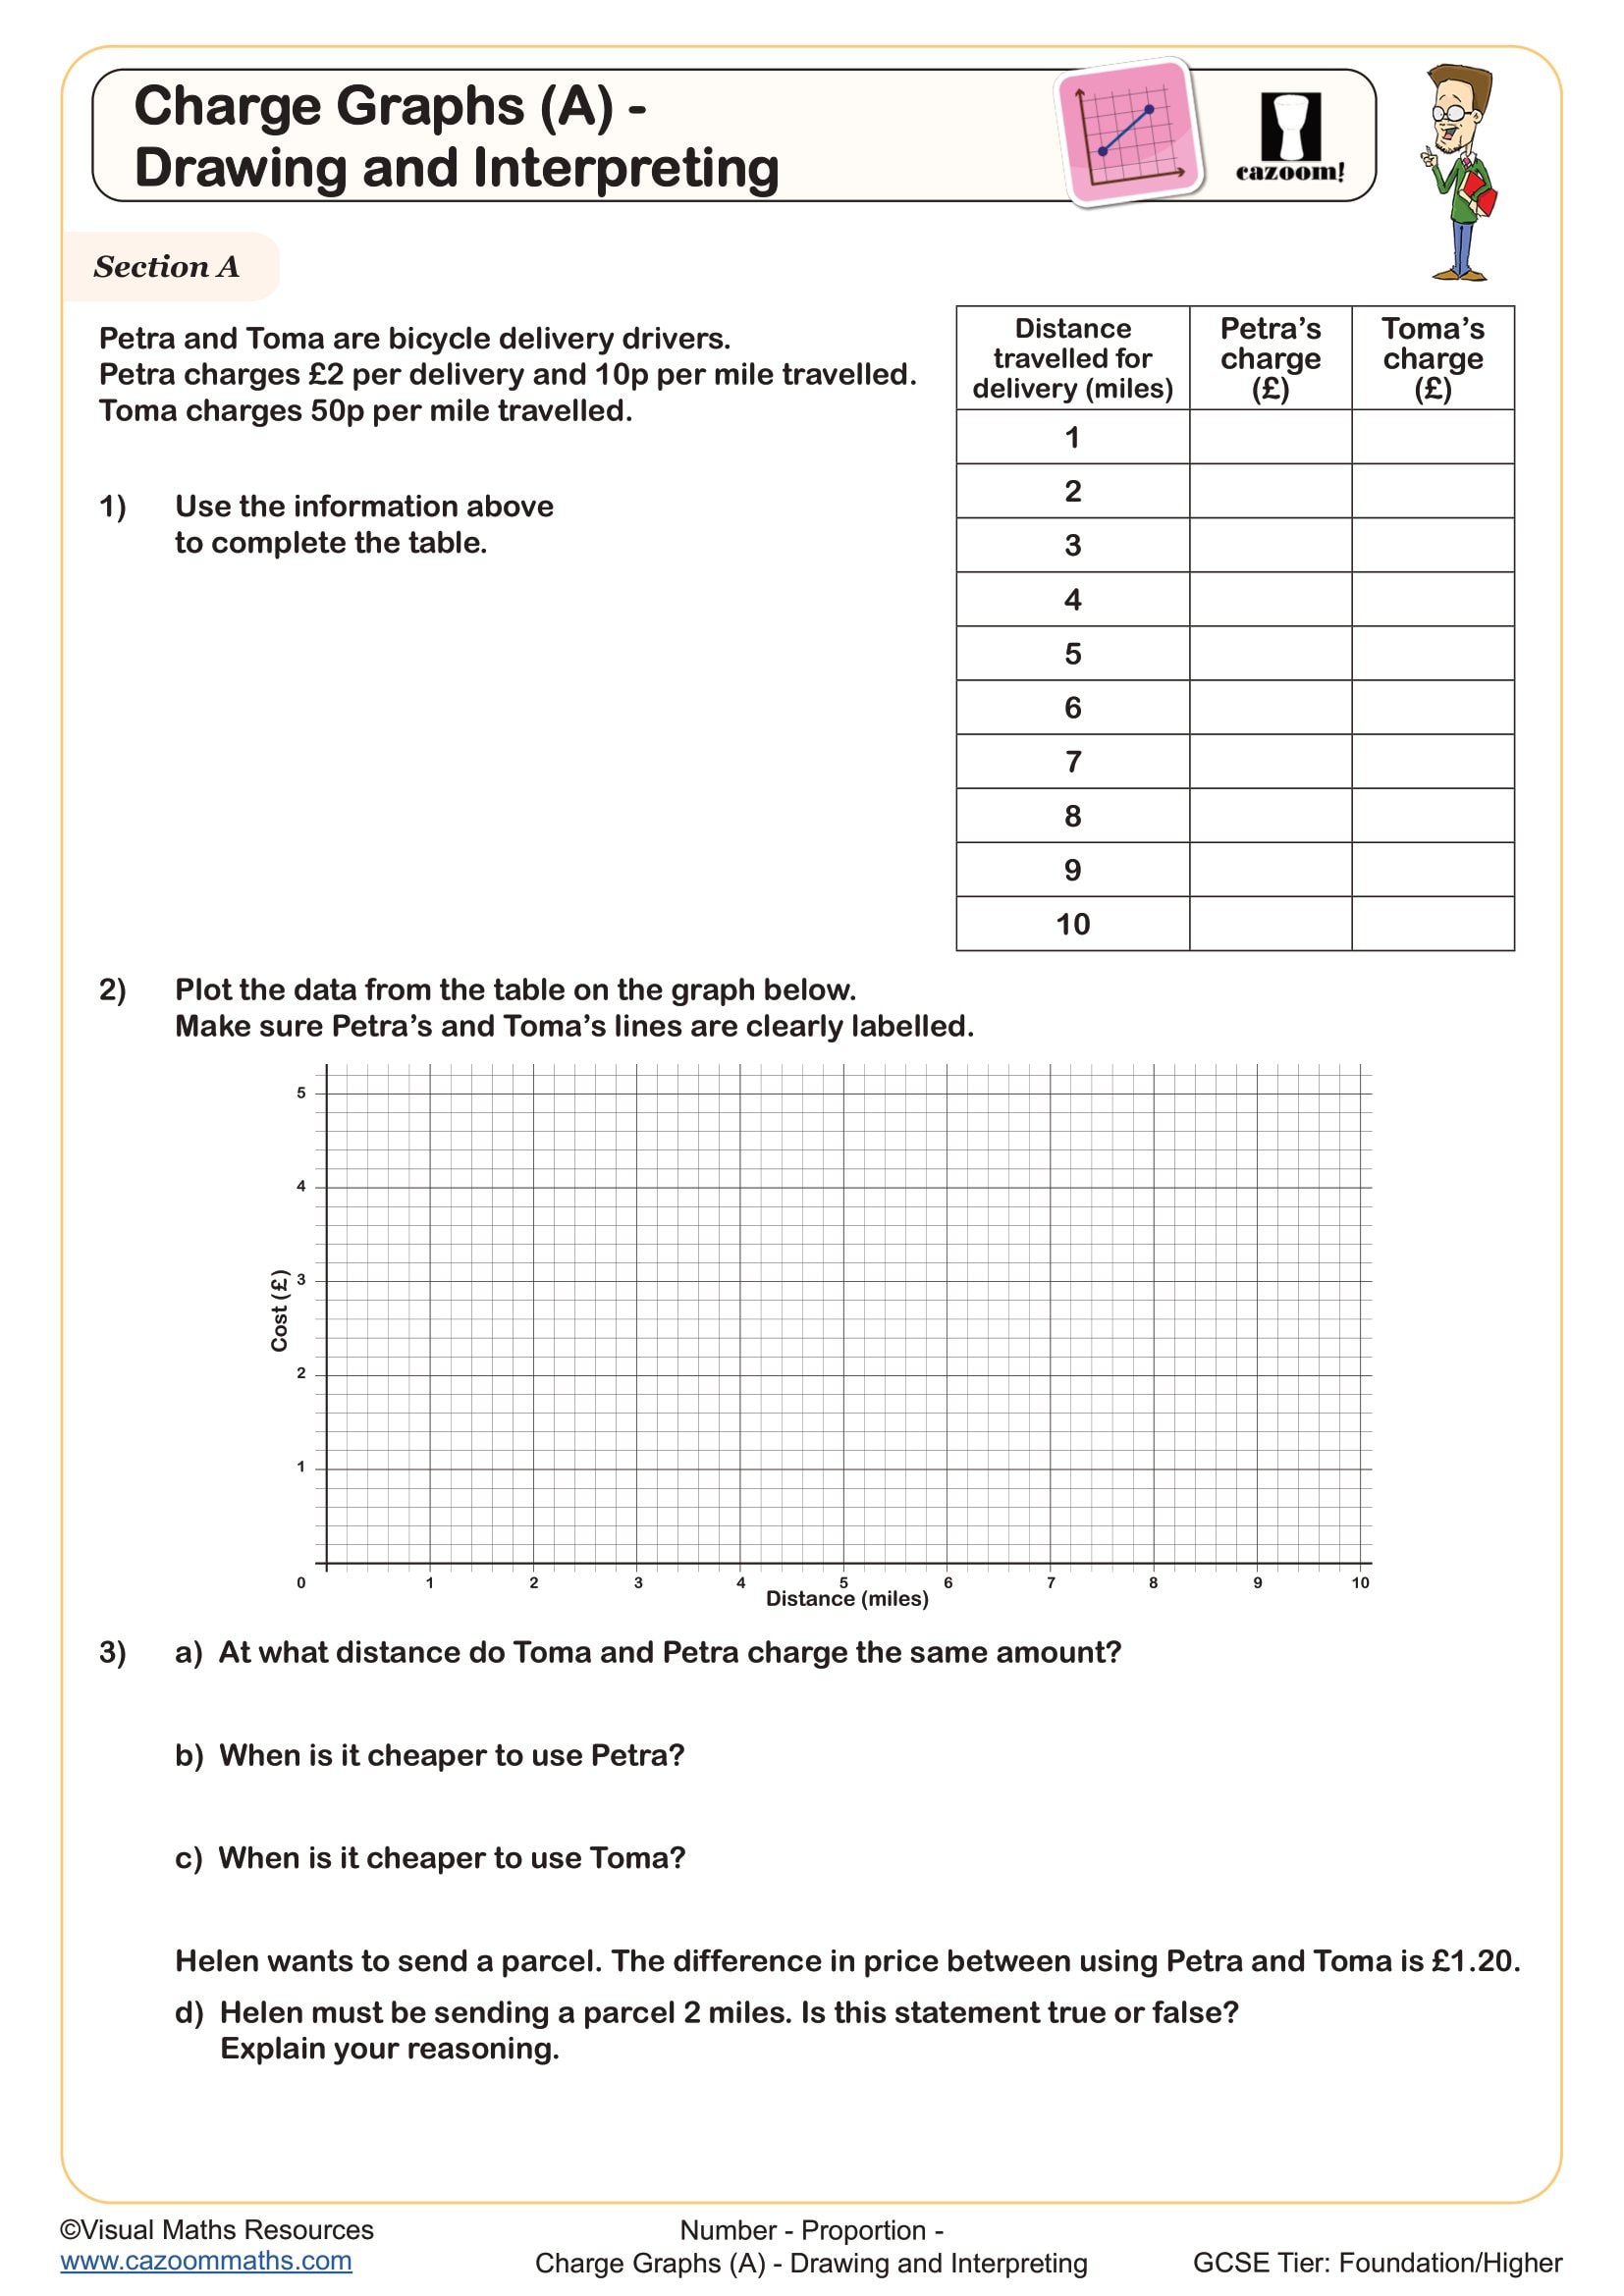
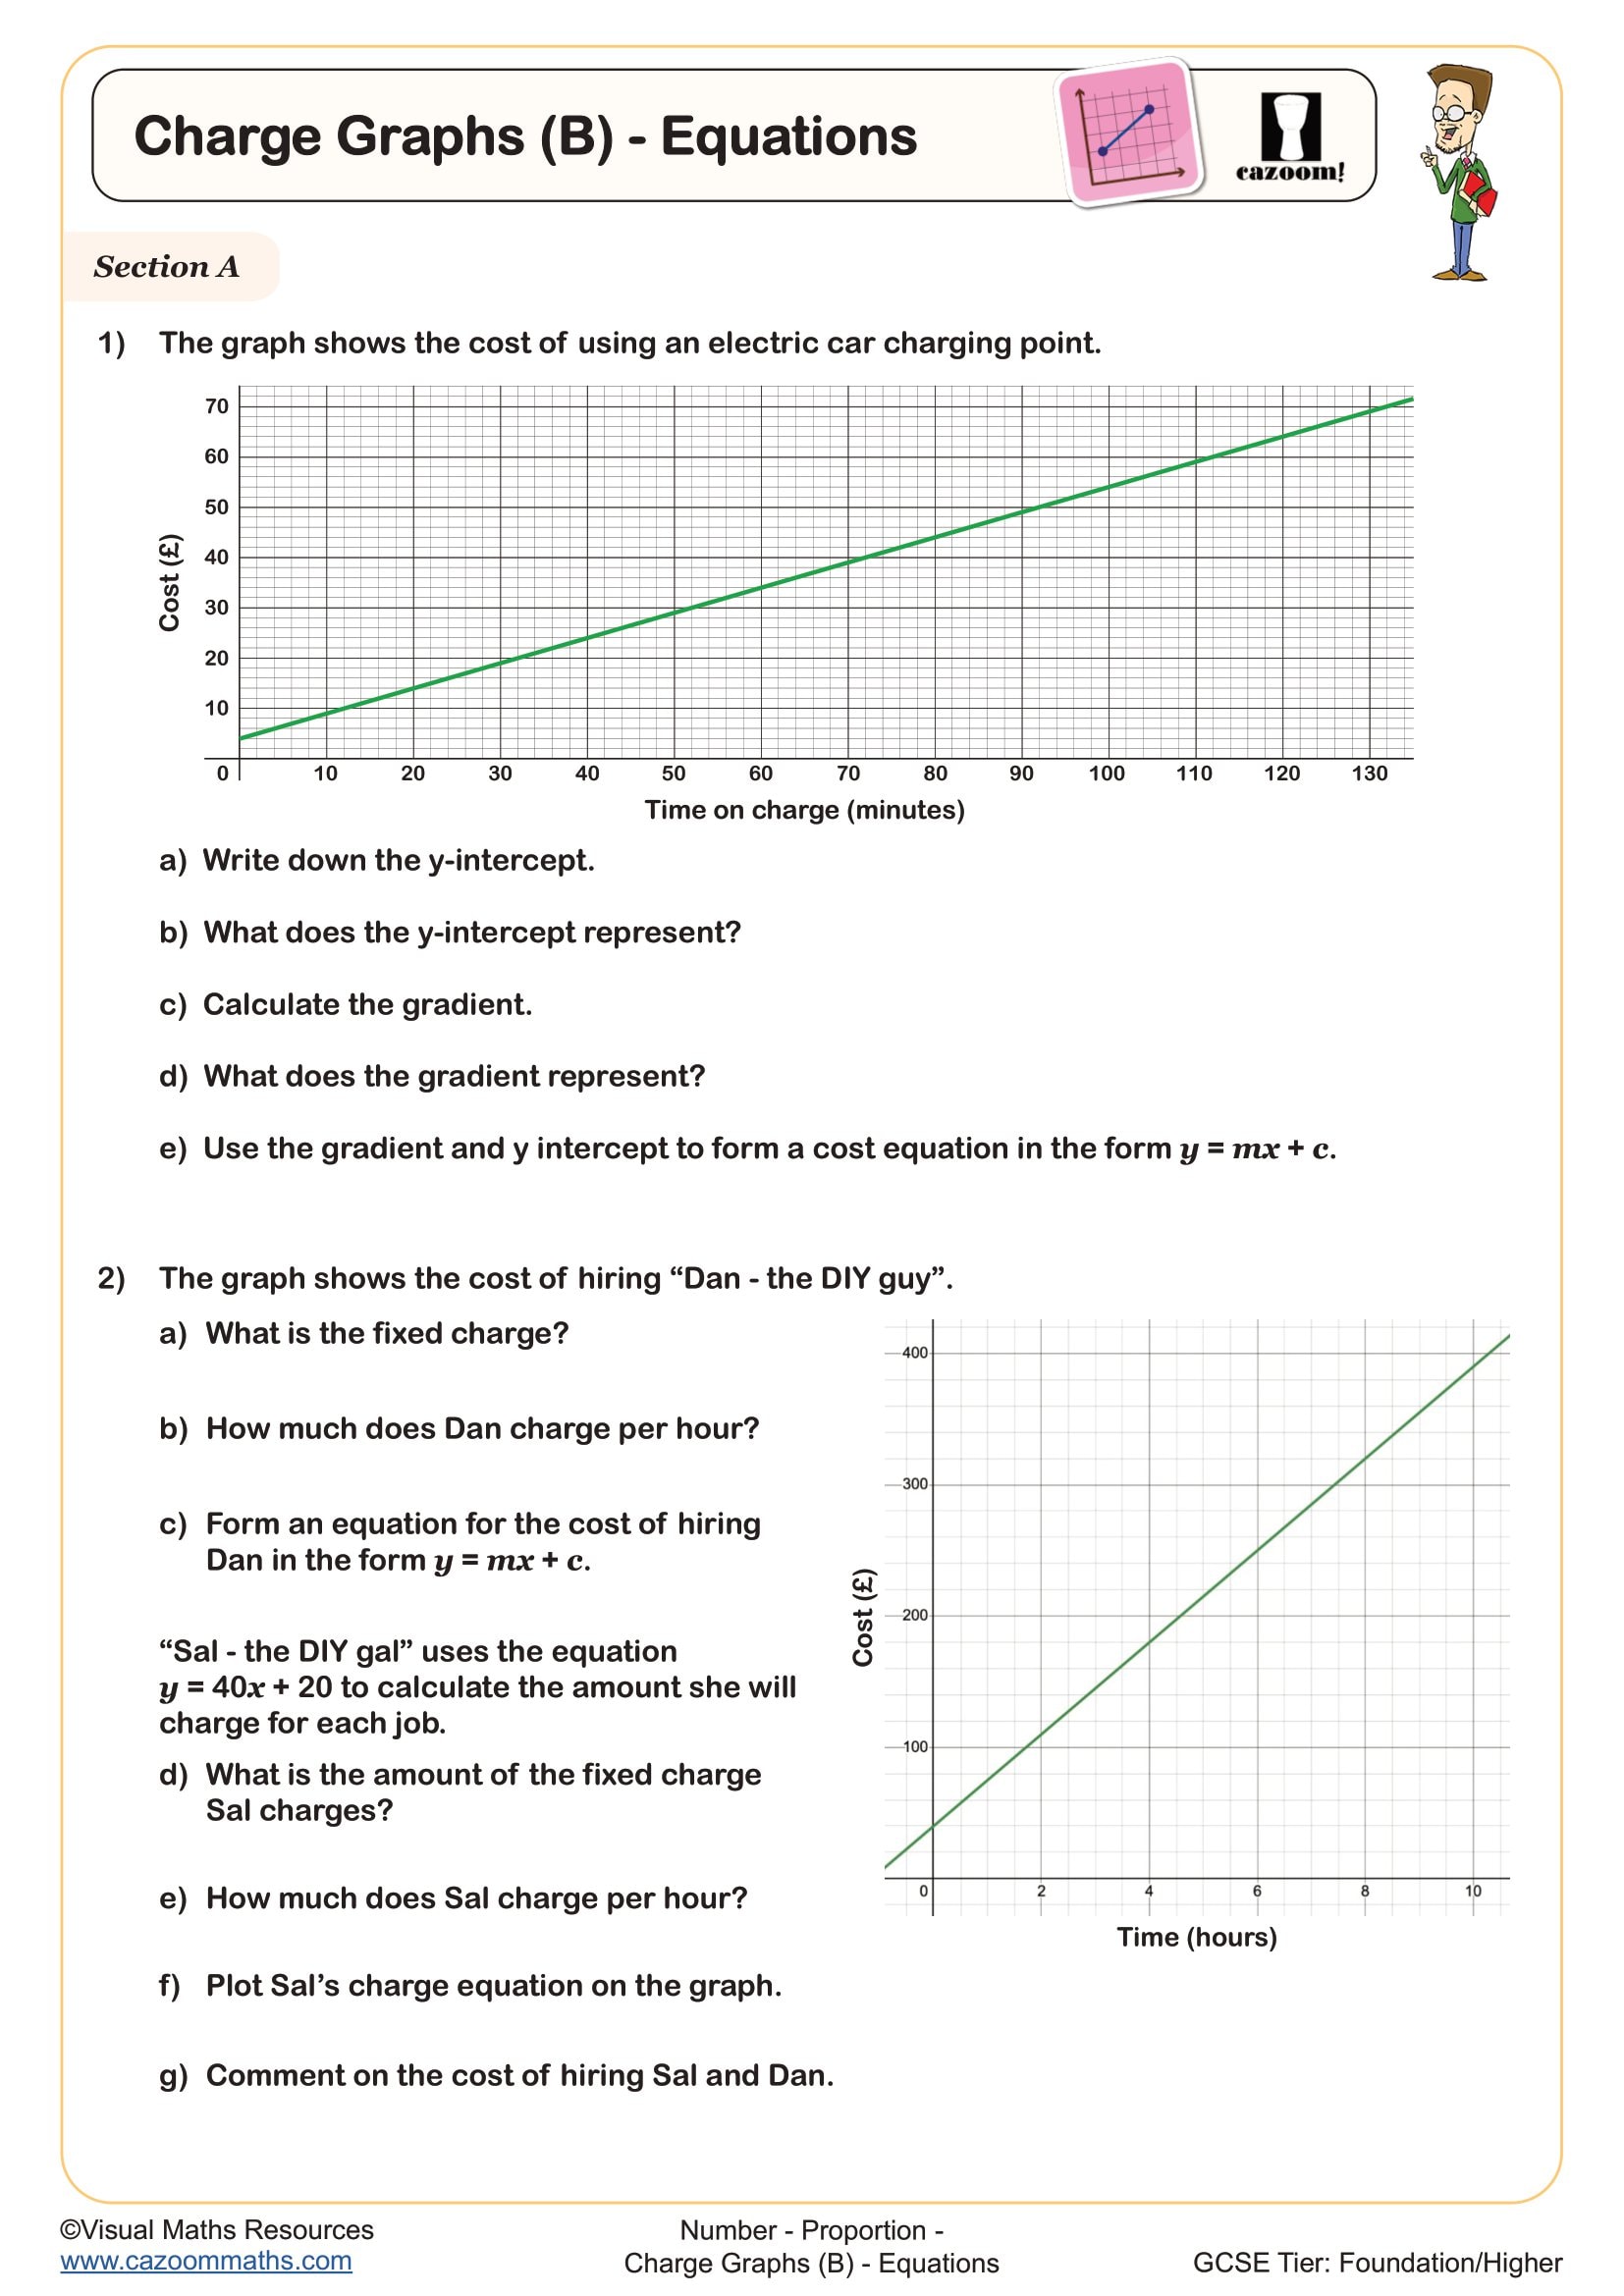
Charge graphs are piecewise linear graphs that represent pricing structures where costs change depending on usage or time. They typically feature a flat initial section showing a fixed charge, followed by one or more sloped sections representing variable rates. Students learn to plot these graphs from given information, read values from existing graphs, and write equations for different segments using y = mx + c.
A common error occurs when students try to write a single equation for the entire graph rather than recognising each section requires its own equation. For example, a mobile phone tariff might have a £10 fixed monthly charge (horizontal line from 0-100 minutes) then £0.15 per minute thereafter (sloped line). Students frequently forget to account for the 100 minutes already 'paid for' in their subsequent equation, writing y = 10 + 0.15x instead of y = 10 + 0.15(x - 100).
Which year groups study charge graphs?
Charge graphs appear in the curriculum for Year 9 and Year 10 students, spanning both Key Stage 3 and Key Stage 4. At KS3, the focus sits within interpreting and constructing graphs that model real situations, whilst at KS4 this extends to algebraic representation of different sections and more complex multi-stage pricing structures. Students should already be confident with plotting linear graphs and understanding gradient before tackling charge graphs.
The progression from Year 9 to Year 10 involves increasing complexity in the number of rate changes and the calculations required. Year 9 students typically work with simpler two-stage tariffs (fixed charge plus one variable rate), whilst Year 10 students encounter scenarios with multiple rate changes, reverse problems where they must find the equation from the graph, and problems requiring them to compare different charging structures to determine which offers better value.
How do you interpret the gradient on a charge graph?
The gradient of each section on a charge graph represents the rate of charge—how much the cost increases per unit of usage. A horizontal line (gradient = 0) indicates a fixed charge where cost doesn't change with usage, such as a standing charge or minimum fee. A steeper gradient shows a higher rate of charge per unit. Students must recognise that the y-intercept may not be zero if there's an initial fee, and when writing equations for later sections, they need to account for the cost already accumulated.
Charge graphs connect directly to utility bills, mobile phone contracts, and pay-as-you-go services that students and their families encounter regularly. Understanding these graphs equips students to compare tariffs, calculate bills, and make informed consumer decisions. In STEM fields, engineers use similar piecewise functions to model manufacturing costs, where bulk orders trigger different pricing tiers, or in environmental science when analysing carbon pricing schemes with threshold-based penalties.
How can teachers use these charge graphs worksheets effectively?
The worksheets provide structured practise moving from interpreting existing charge graphs to constructing them from written information, then writing equations for different sections. Each question builds on prior knowledge of linear graphs whilst introducing the complexity of piecewise functions in a context students can visualise. Answer sheets allow students to self-check their gradient calculations and equation formation, helping them identify whether errors stem from plotting inaccuracies or algebraic mistakes.
Many teachers use these worksheets during GCSE revision to target the 'real-life graphs' questions that regularly appear on Foundation and Higher papers, as students lose marks when they misread scales or fail to show calculation steps. The resources work well for intervention with students who understand straight-line graphs but need additional support applying this knowledge to unfamiliar contexts. Teachers also find them useful for homework tasks that parents can understand and support, since the scenarios relate to everyday experiences like electricity bills or car park charges.