Conversion Graphs Worksheets
All worksheets are created by the team of experienced teachers at Cazoom Maths.
What Are Conversion Graphs and Why Do Students Need Them?
Conversion graphs are linear graphs that show the relationship between two different units or quantities, such as miles to kilometres, pounds to euros, or degrees Celsius to Fahrenheit. They're part of the KS3 algebra curriculum because they demonstrate how proportional relationships appear graphically and connect to gradient as a rate of conversion. Students use these graphs to convert values in both directions without having to perform calculations each time.
A common error occurs when students confuse which axis represents which unit, leading to incorrect conversions. Students often lose marks on exam questions when they fail to use a ruler for accuracy or don't extend the line appropriately when the required value sits beyond the plotted points. Teachers report that explicitly labelling which quantity goes on which axis before plotting helps reduce this confusion significantly.
Which Year Groups Study Conversion Graphs?
These worksheets target Year 8 and Year 9 students as part of the Key Stage 3 algebra strand. Conversion graphs typically appear after students have worked with coordinates, straight-line graphs, and basic proportional reasoning. The National Curriculum expects students to construct and interpret these graphs, understanding that the gradient represents the conversion factor between the two quantities.
In Year 8, students generally focus on plotting conversion graphs from given information and reading straightforward values. Year 9 work becomes more demanding, with students expected to work with more complex conversions, interpret graphs where the relationship might not pass through the origin (such as temperature conversions), and connect the graphical method to algebraic expressions. This progression builds towards GCSE functional skills questions where conversion graphs appear in problem-solving contexts.
How Do You Read Values From Conversion Graphs Accurately?
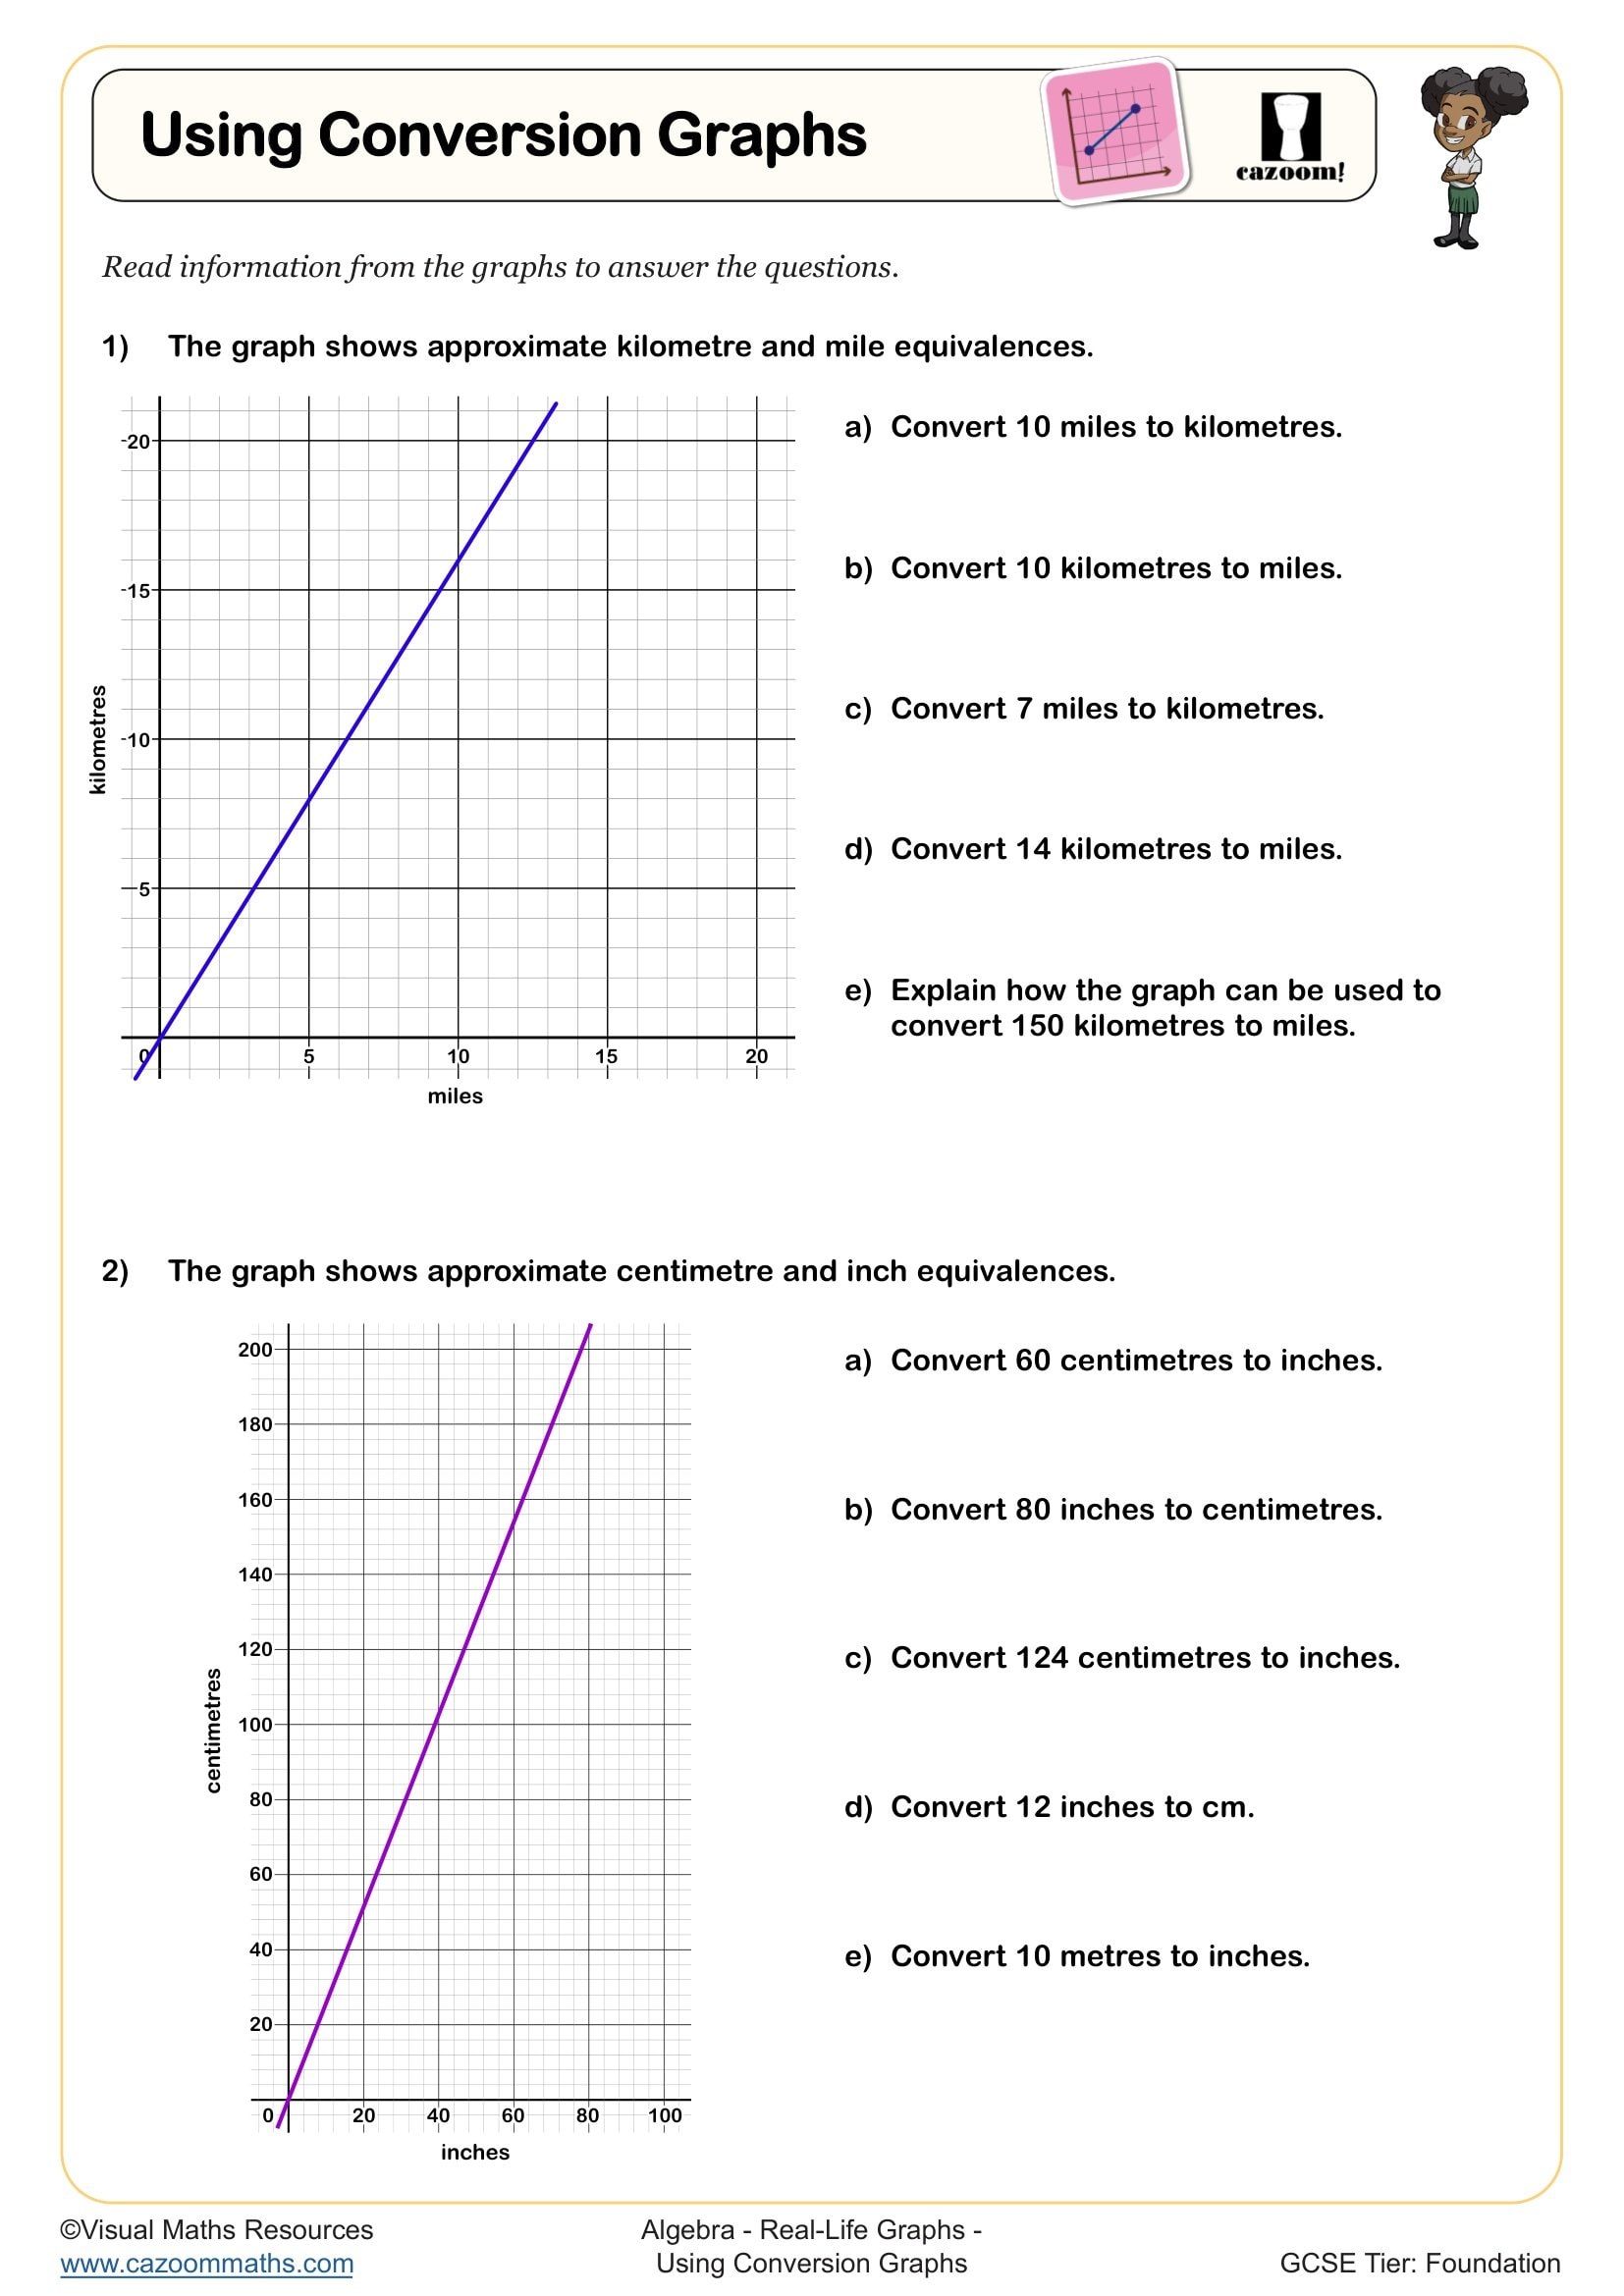
Reading from conversion graphs requires students to draw a line from the known value on one axis horizontally or vertically to meet the conversion line, then trace perpendicular to the other axis to read the converted value. Accuracy matters enormously, particularly in GCSE questions where marks depend on answers within a specified tolerance. Students should use a ruler for both plotting and reading, and teachers often emphasise reading to the nearest small square on graph paper rather than estimating.
Conversion graphs appear extensively in STEM contexts, particularly engineering and international business. Currency conversion graphs help students understand exchange rates when planning travel budgets, whilst temperature conversions matter in scientific experiments where equipment displays readings in different units. Meteorologists use conversion graphs when presenting weather data to international audiences, and engineers working on global projects need to convert between metric and imperial measurements quickly, making this graphical skill genuinely transferable beyond the classroom.
How Can Teachers Use These Conversion Graph Worksheets Effectively?
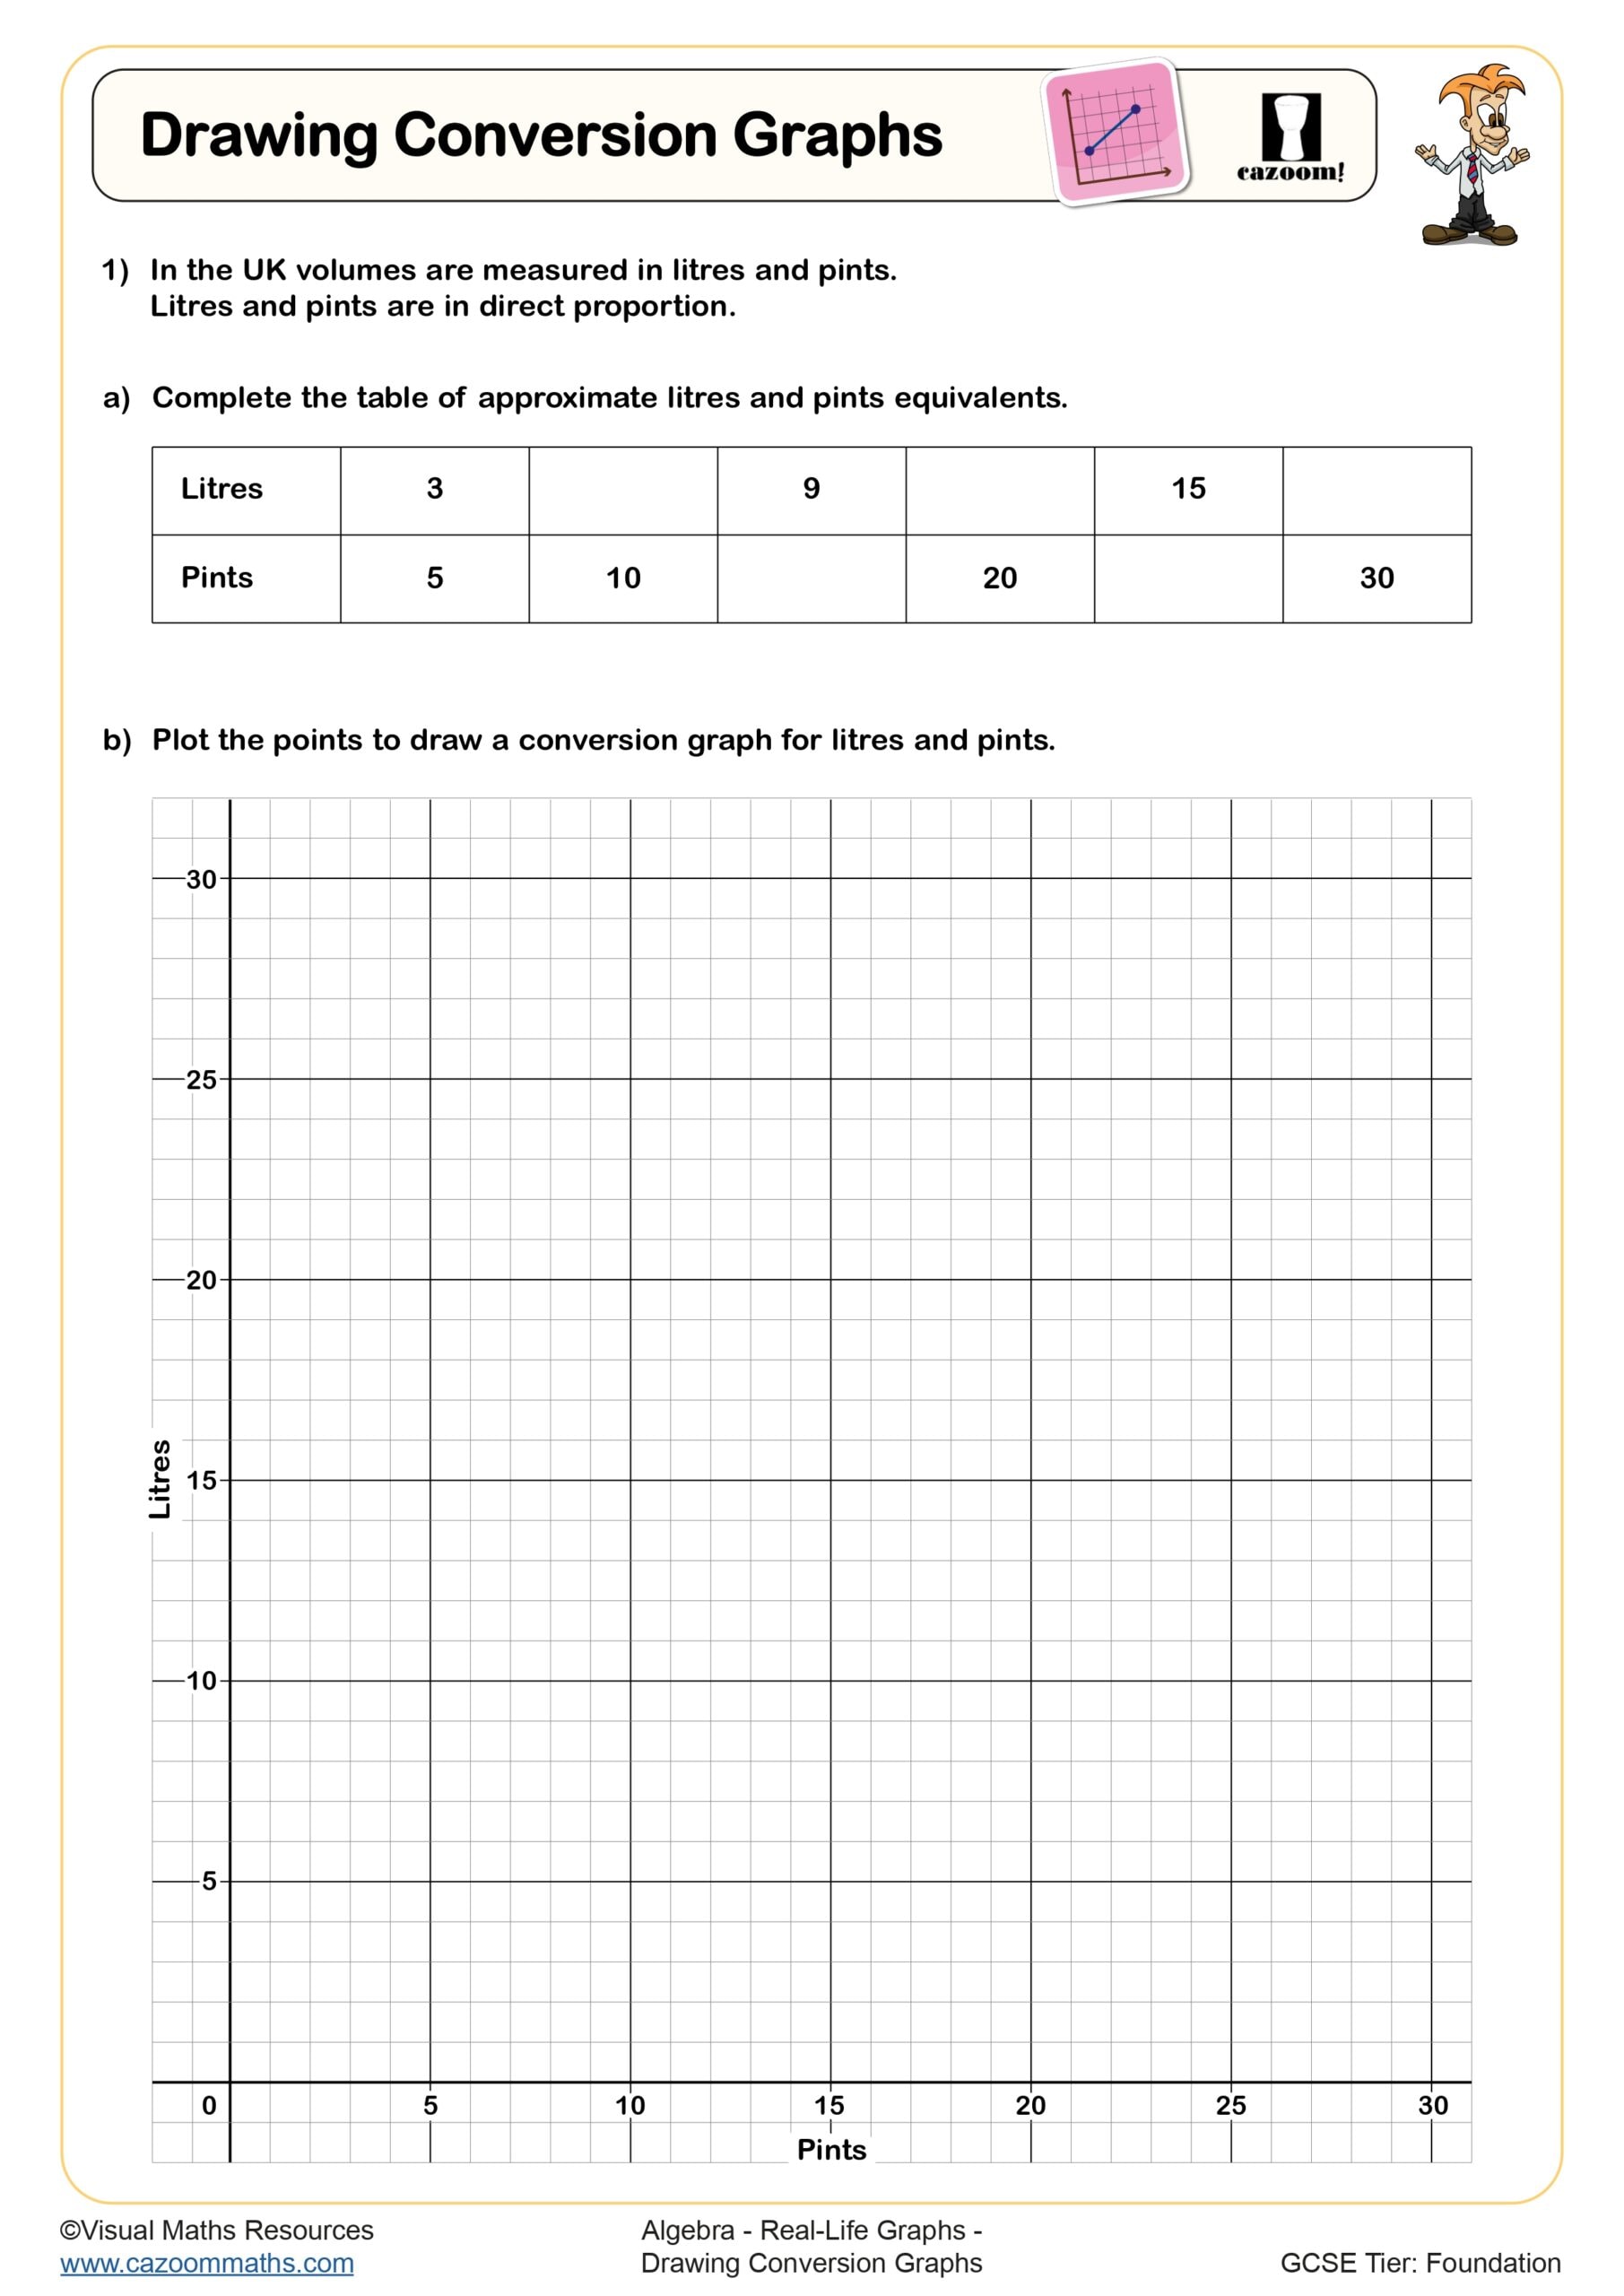
The worksheets build systematic practice in both constructing conversion graphs from scratch and using pre-drawn graphs to find conversions. Students work through plotting coordinates, drawing lines of best fit, and then applying these graphs to solve conversion problems. The answer sheets allow students to self-check their plotted graphs and verify their converted values, which supports independent learning and helps identify whether errors stem from inaccurate plotting or incorrect reading.
Many teachers use these worksheets during intervention sessions with students who struggle to connect gradient to real-world rates, as the visual representation makes the proportional relationship more concrete. They work well as homework after introducing the topic in class, giving students additional practice without requiring teacher support. The worksheets also suit paired work where one student plots whilst the other checks accuracy, then they swap roles, encouraging peer discussion about scale, axes, and reading techniques that strengthen understanding for both partners.