Cubic Functions Worksheets
All worksheets are created by the team of experienced teachers at Cazoom Maths.
Where are cubic graphs worksheet pdf resources used in the GCSE curriculum?
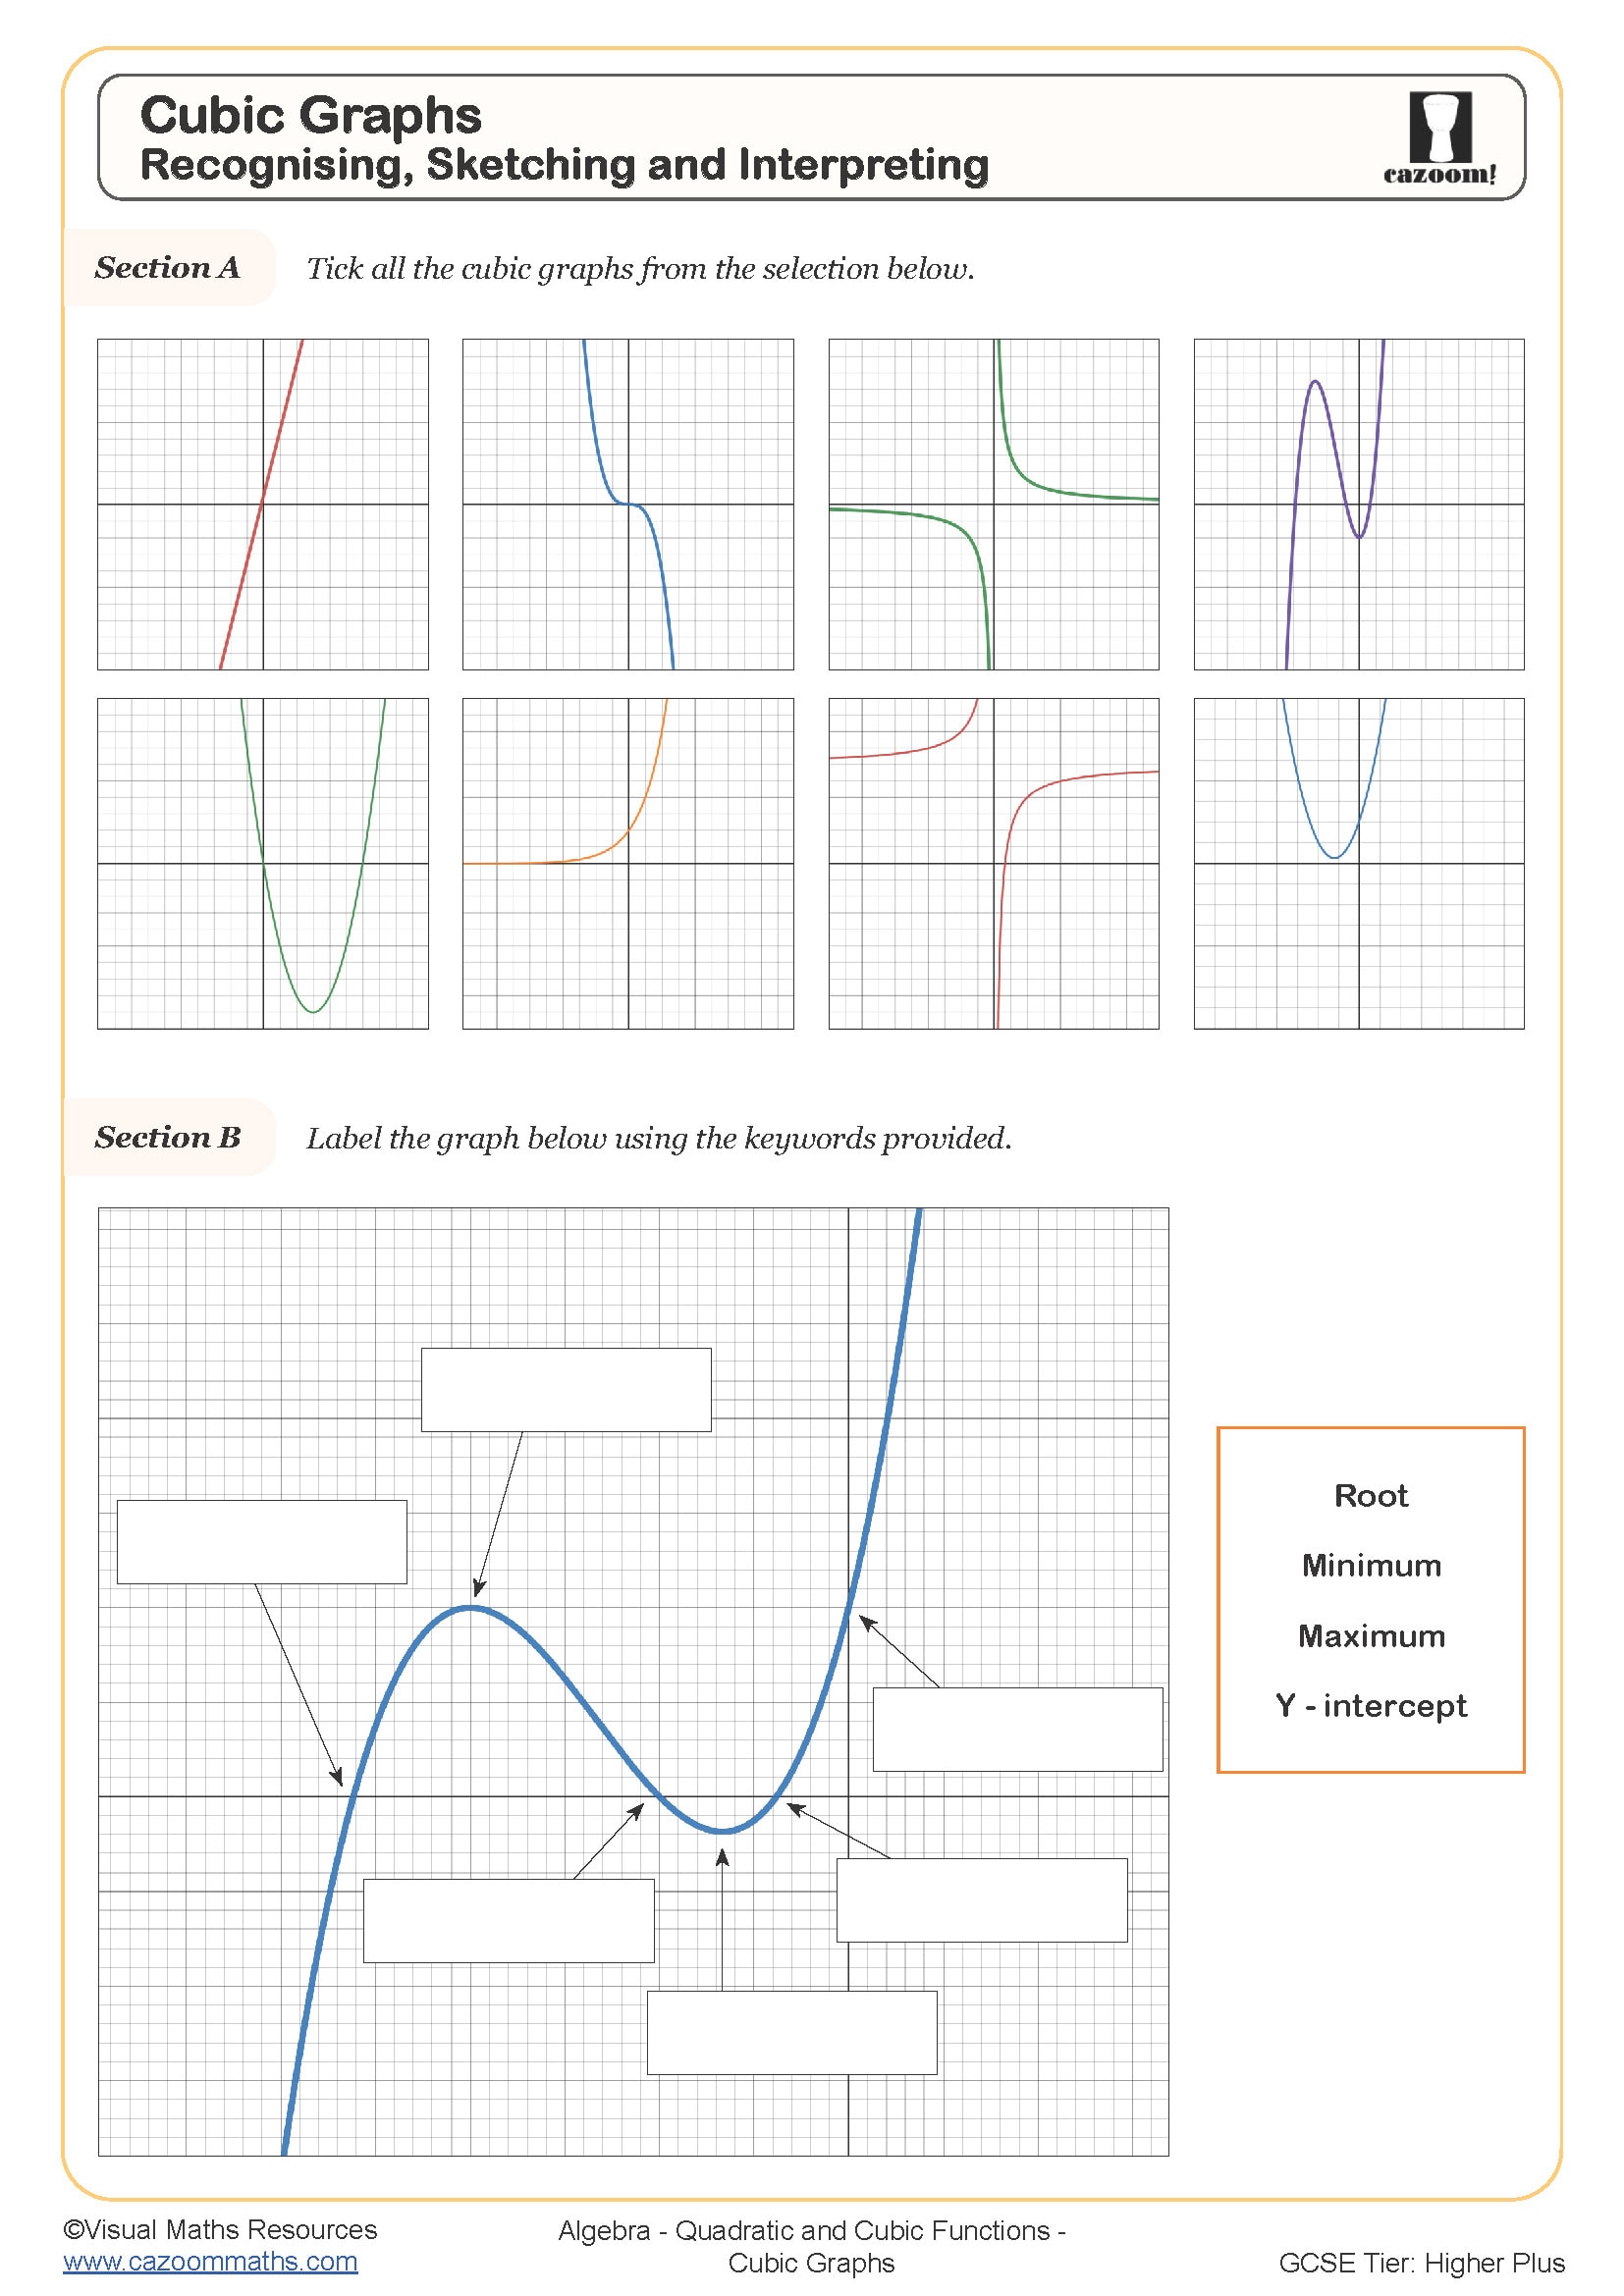
Cubic graphs appear in the GCSE Higher tier algebra curriculum, typically introduced in Year 10 after students have secured their understanding of quadratic functions. The topic sits within the broader functions strand of the National Curriculum, where students progress from linear and quadratic relationships to more complex polynomial behaviour. Exam questions expect students to sketch cubics from equations, find approximate solutions to cubic equations graphically, and interpret features such as turning points and intercepts.
Maths departments often notice that students who download cubic graphs worksheet pdf materials for independent practise perform better on the graphing questions that regularly appear in Paper 2. The mark scheme rewards accurate identification of the y-intercept, correct curve shape, and appropriate use of a table of values. Students frequently lose marks by plotting isolated points without considering the continuous nature of the curve, or by forgetting to extend their graph beyond the given x-values to show the characteristic cubic behaviour at the extremes.
Which year groups study cubic functions?
Cubic functions are taught to Year 10 and Year 11 students following the Higher tier GCSE pathway at Key Stage 4. This topic builds directly on the quadratic functions work completed earlier in Year 10, where students learn to recognise parabolic graphs and solve quadratic equations. The positioning reflects the National Curriculum's requirement that students can sketch and interpret graphs of more complex functions beyond the linear and quadratic forms studied at foundation level.
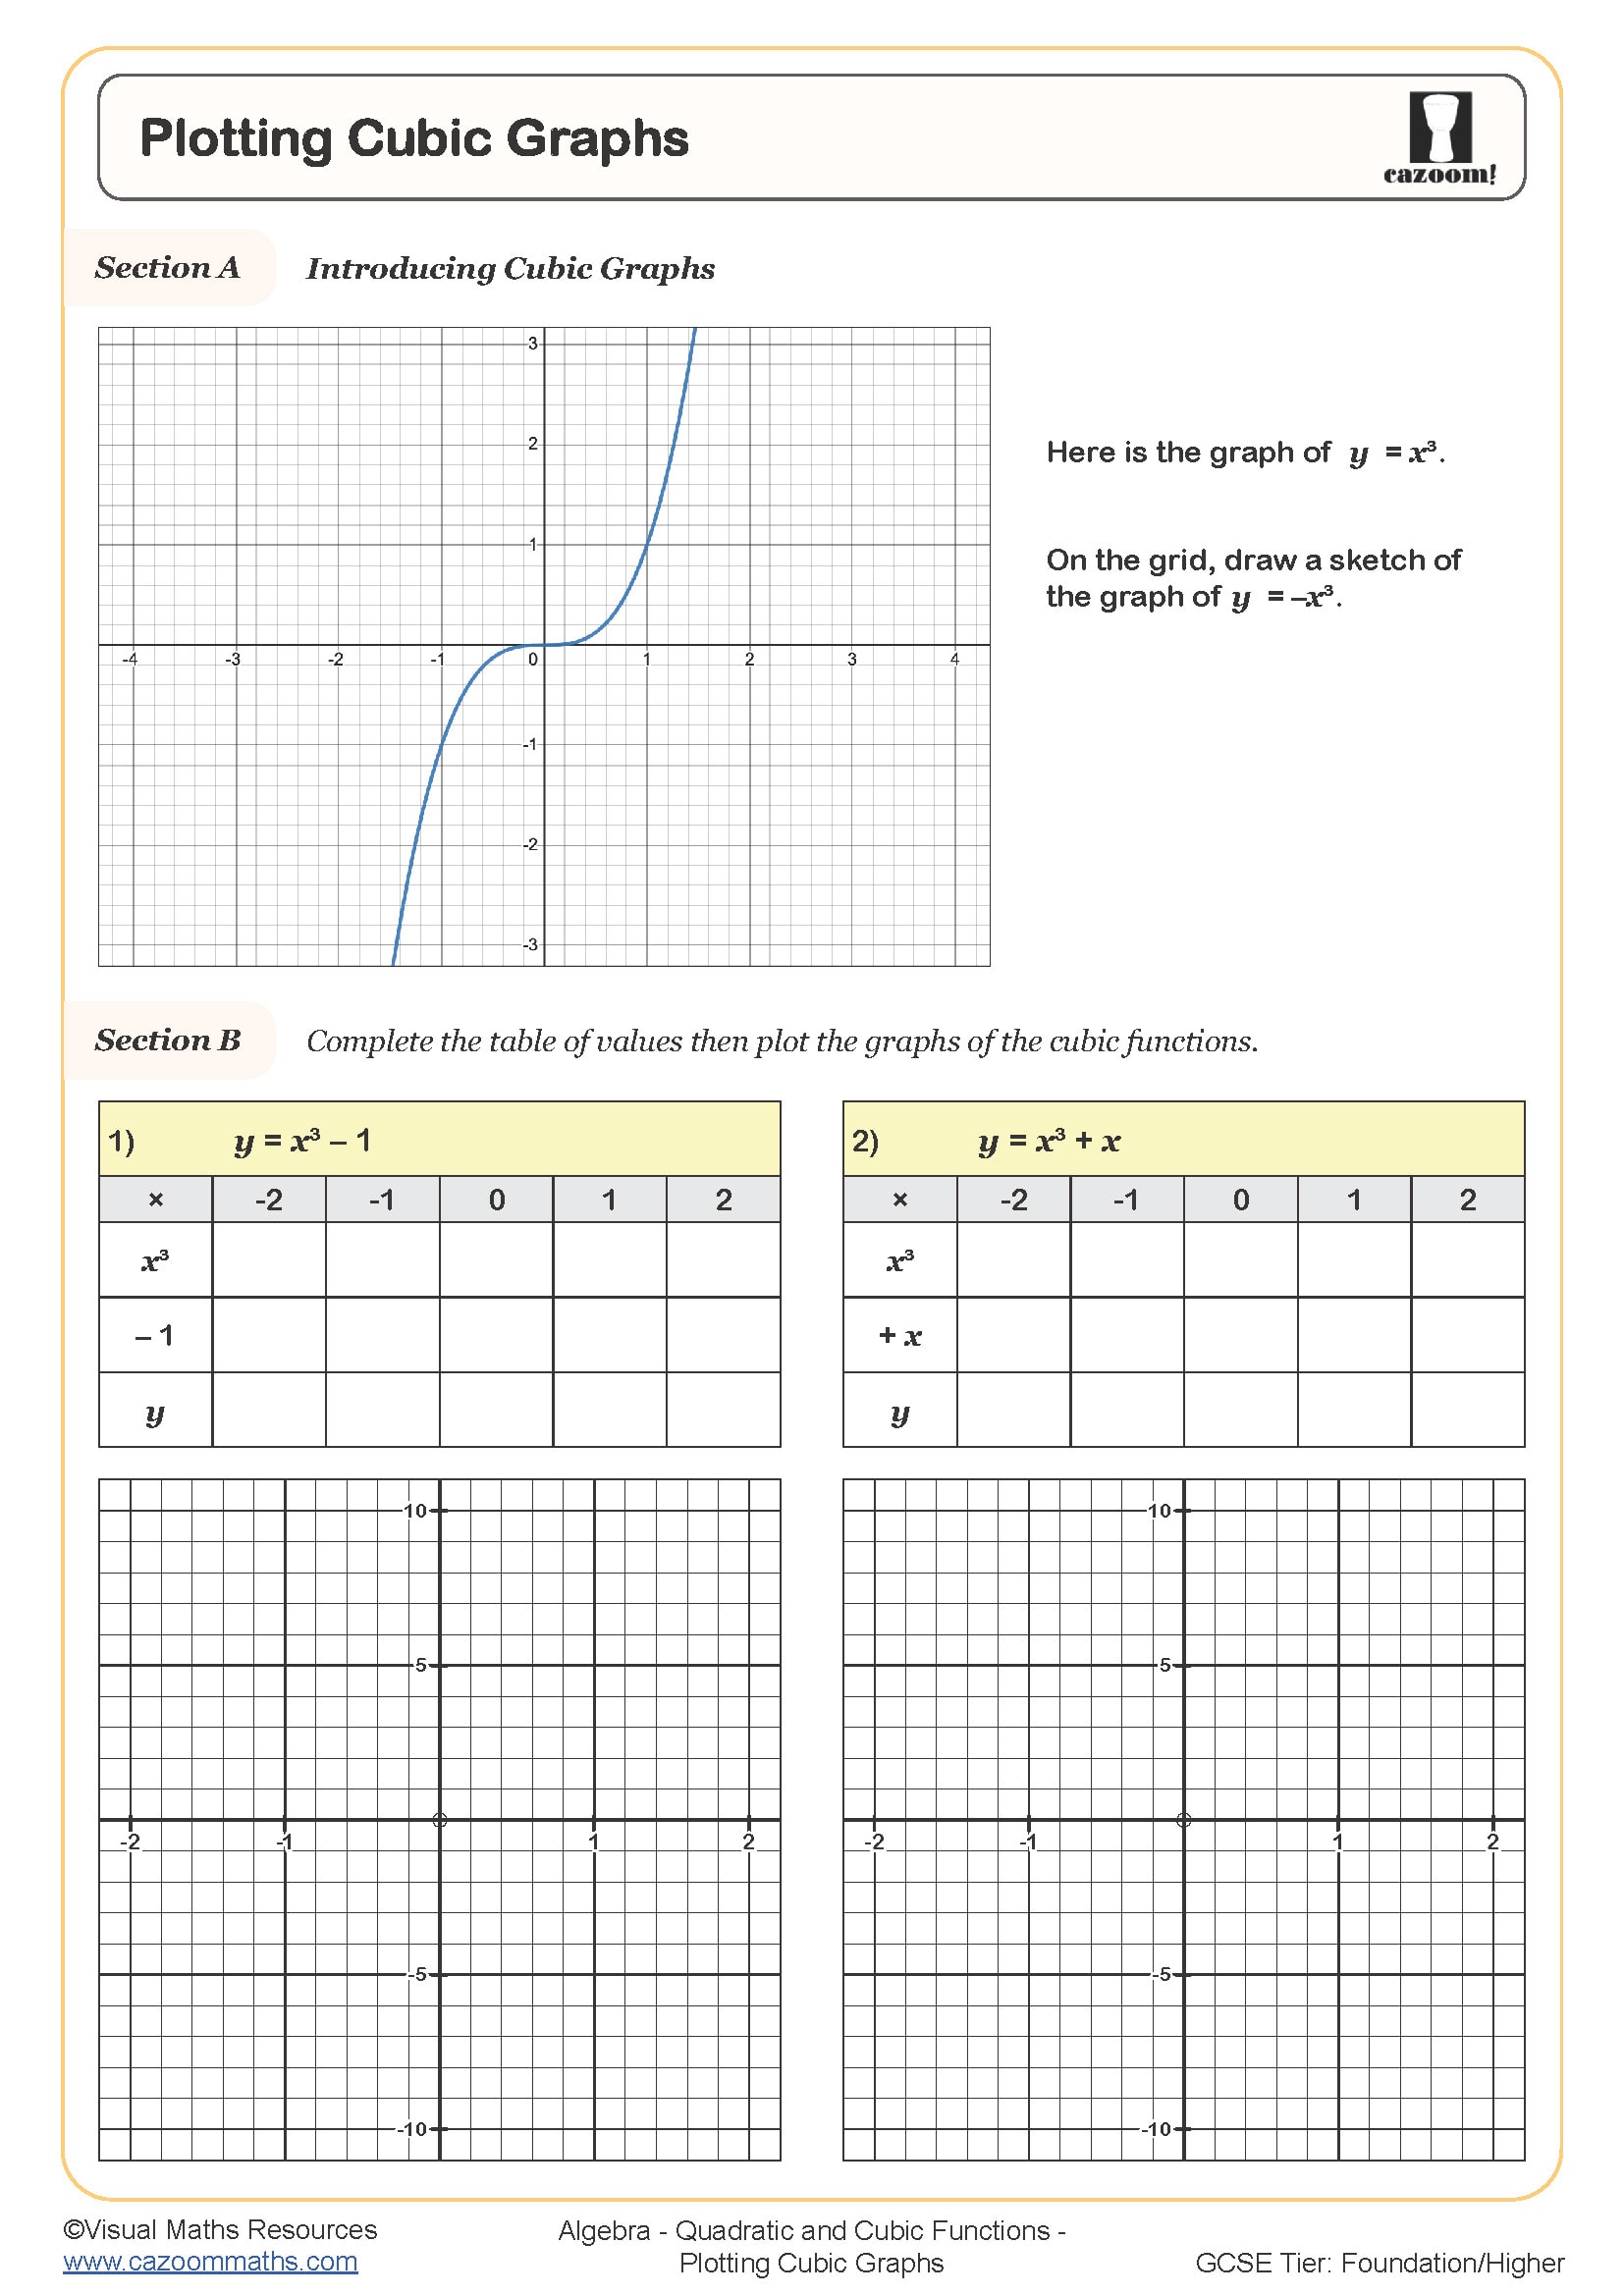
The progression across these year groups typically moves from sketching simple cubics like y = x³ and y = x³ + 2 in Year 10, to more complex forms involving stretched or reflected cubics by Year 11. Teachers structure revision sessions around increasingly challenging examples, with Year 11 students expected to identify transformations applied to the parent function y = x³ and to use graphical methods for solving cubic equations. This layered approach ensures students develop both procedural fluency and conceptual understanding before facing mixed function questions in their examinations.
How do cubic functions connect to real-world applications?
Understanding cubic functions provides students with the mathematical tools to model scenarios where rates of change themselves change, a situation common in physics and engineering. Whilst quadratic relationships describe constant acceleration, cubic models capture more complex motion where acceleration varies, such as in fluid dynamics or when calculating the volume relationships in three-dimensional design. The ability to sketch and interpret these graphs helps students visualise how variables interact in non-linear systems.
Engineers frequently use cubic equations when designing structures where load distribution follows complex patterns, or in chemical engineering where reaction rates depend on multiple interacting factors. Students studying STEM subjects at A Level encounter cubic functions when differentiating to find rates of change, and when using the factor theorem to solve polynomial equations algebraically. This groundwork in recognising and graphing cubics at GCSE proves particularly valuable when students progress to parametric equations and calculus, where visualising function behaviour becomes increasingly important for problem-solving.
How do these worksheets support classroom teaching?
The worksheets provide structured practise that allows students to develop fluency in creating accurate cubic graphs through repeated exposure to varied examples. Each resource includes worked examples or scaffolded questions that guide students through the process of constructing a table of values, plotting coordinates systematically, and drawing smooth curves that demonstrate correct end behaviour. The included answer sheets enable students to identify errors immediately, which teachers find particularly effective for addressing the common mistake of connecting plotted points with straight lines rather than smooth curves.
Many maths departments use these resources during intervention sessions with students who find the transition from quadratic to cubic graphs challenging, as the format allows for paired work where students can compare their sketches and discuss differences. The worksheets work equally well as homework tasks following initial teaching, or as focused revision material when preparing for mock examinations. Teachers report that having PDF resources readily available means they can quickly differentiate for students who need additional practise with simpler cubics before attempting transformed or reflected versions that appear in past paper questions.