Distance Time Graphs Worksheets
All worksheets are created by the team of experienced teachers at Cazoom Maths.
What Do Students Practise on a Distance Time Graphs Worksheet?
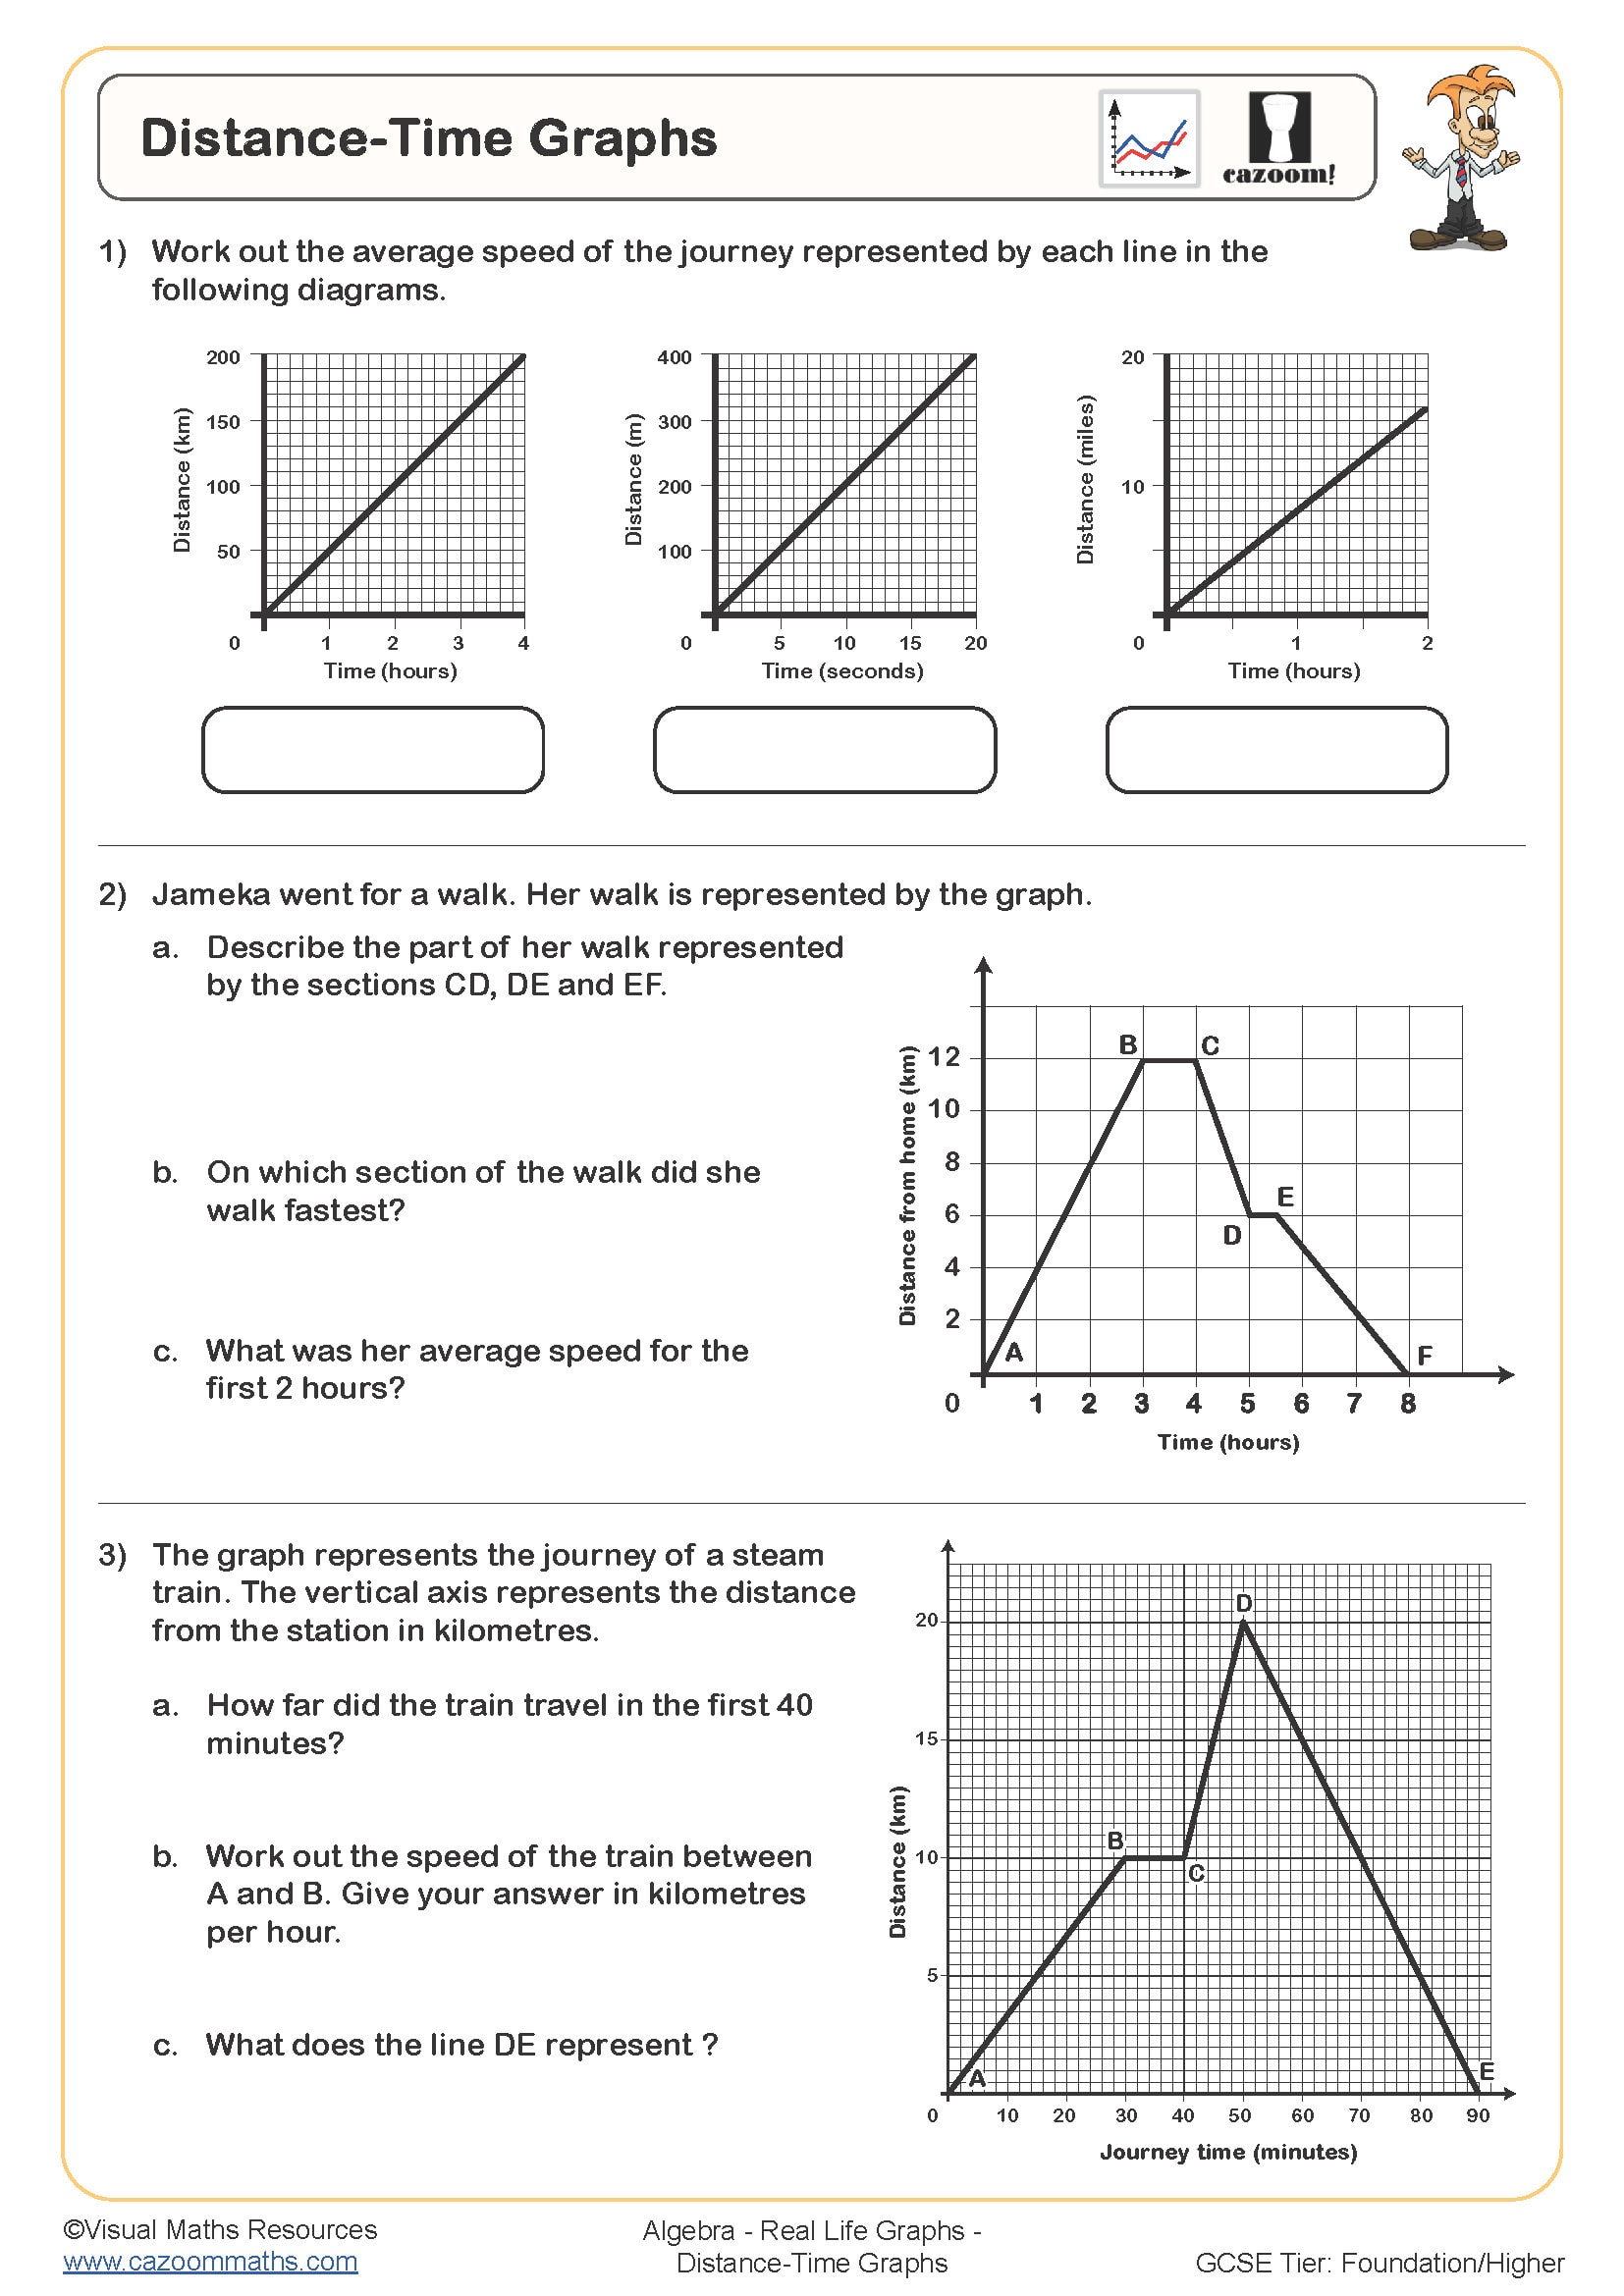
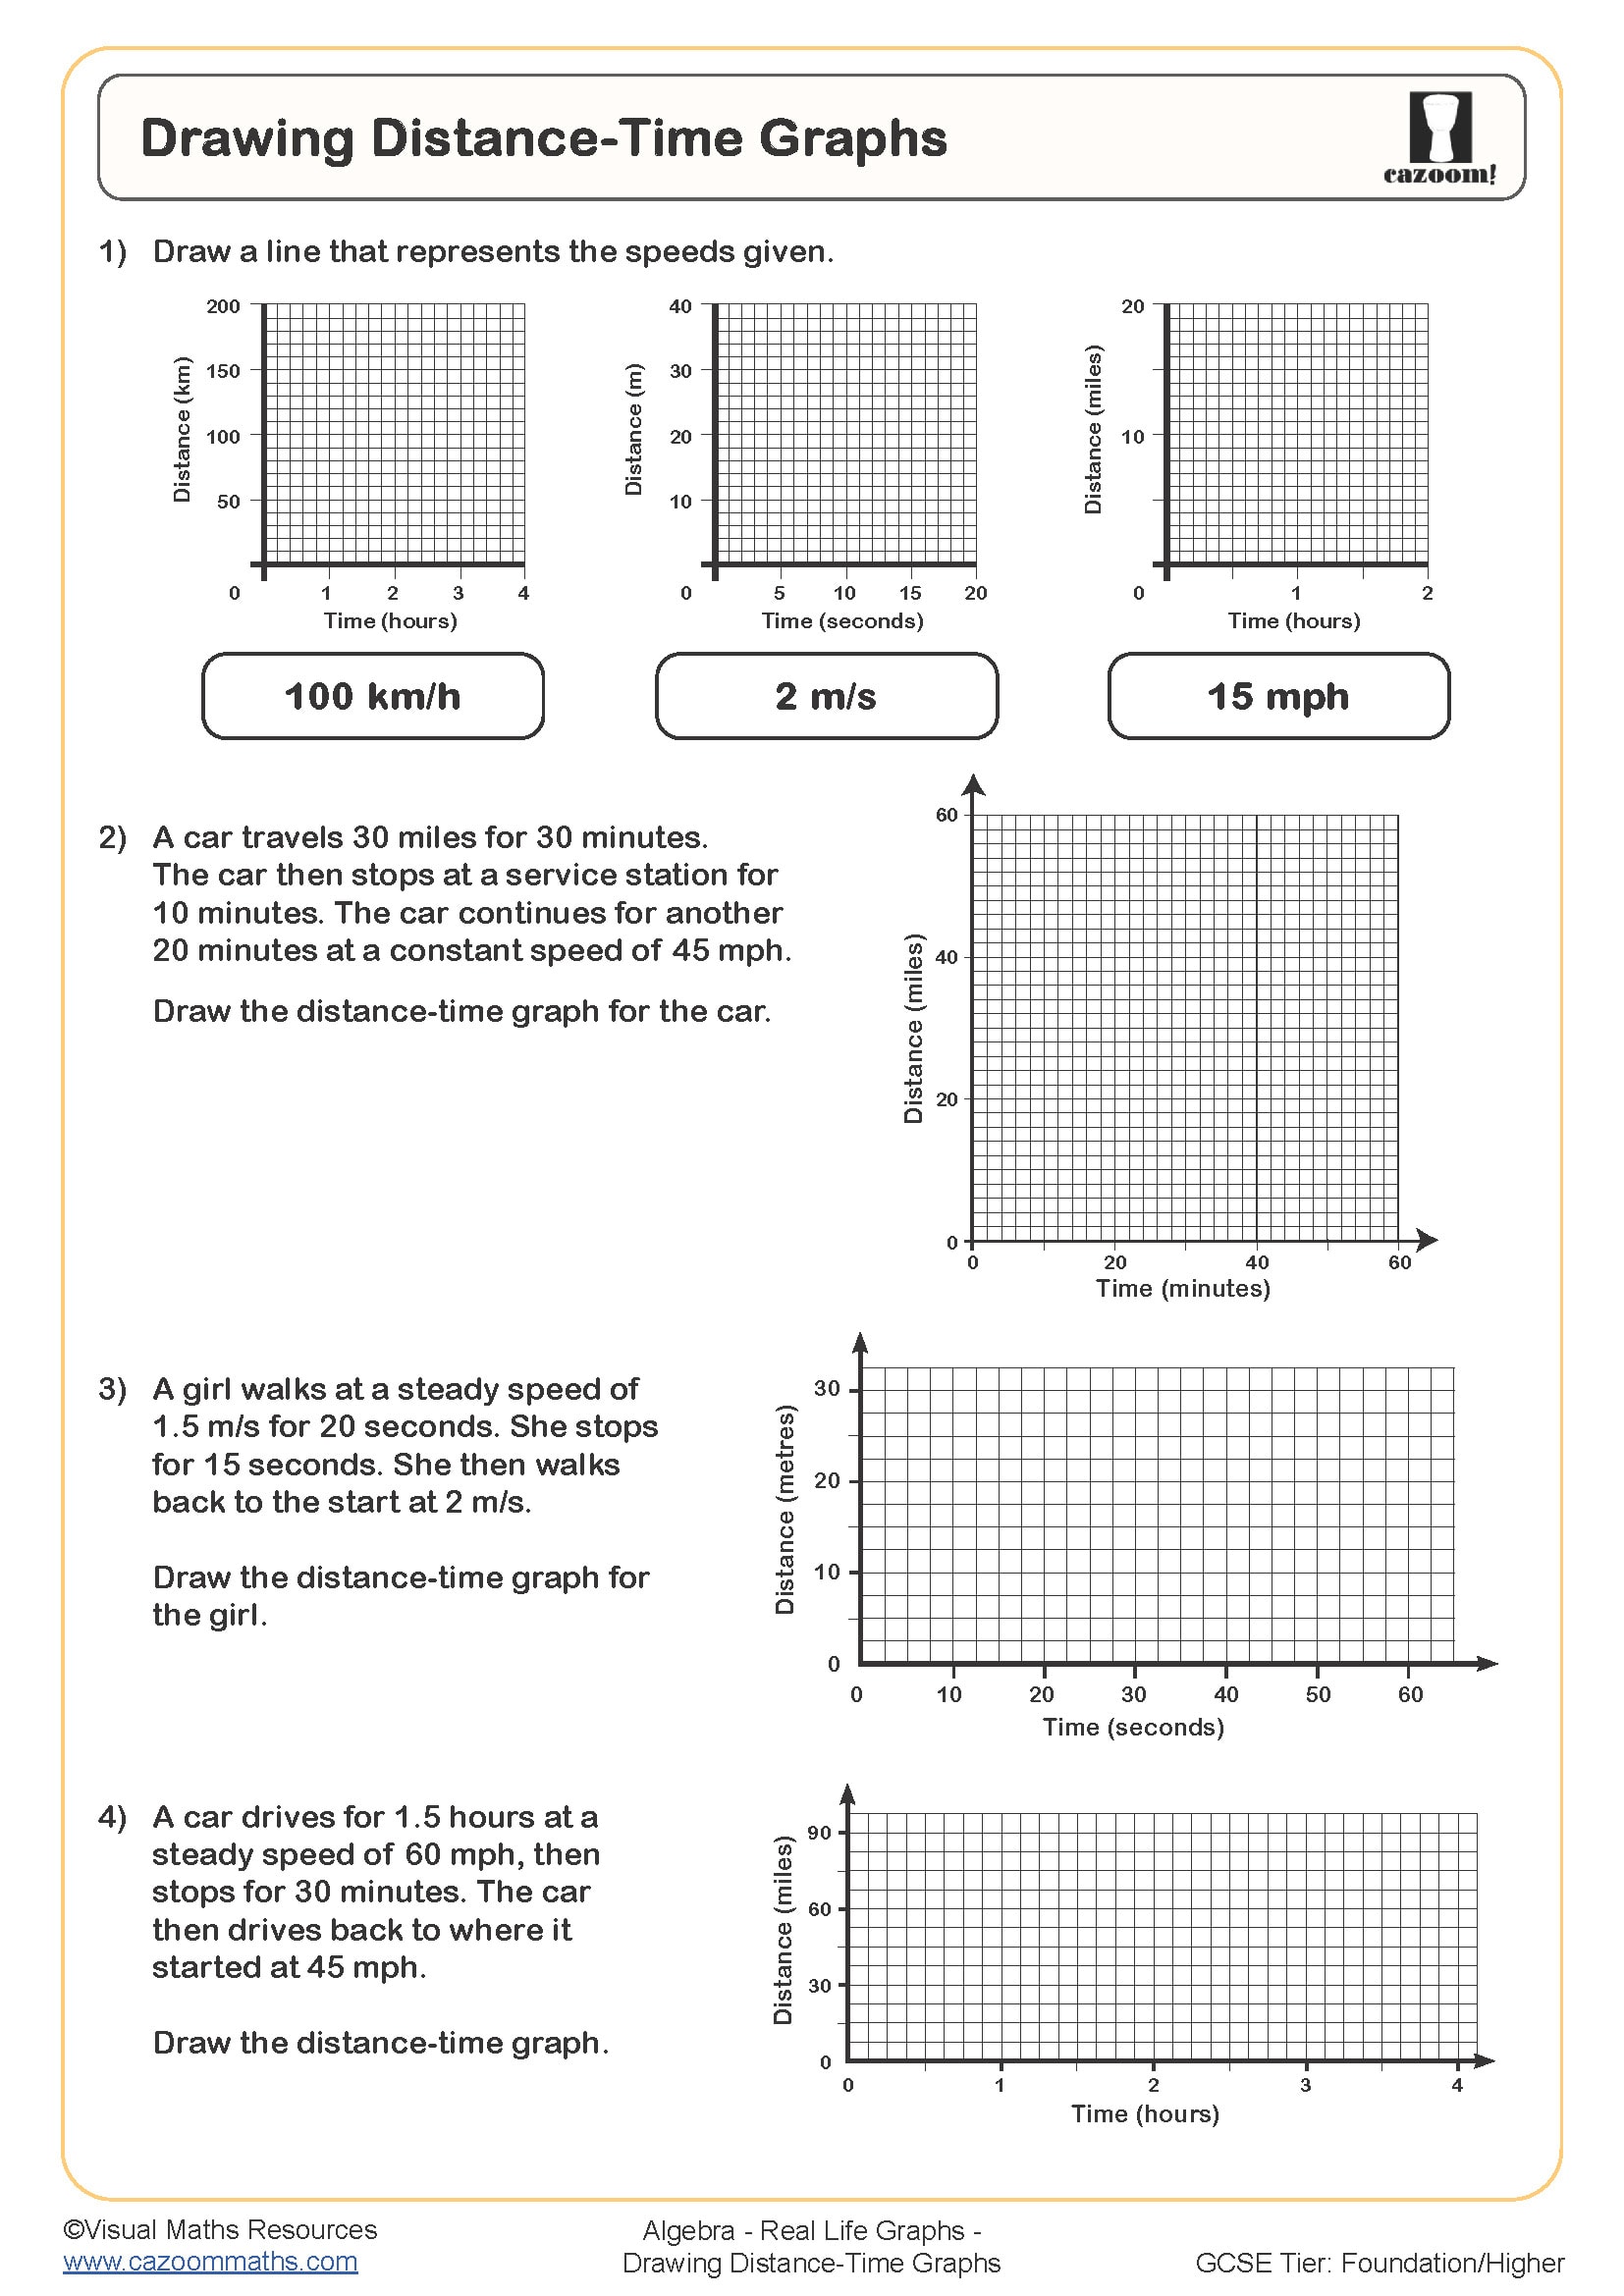
A distance time graphs worksheet typically covers reading values from graphs, plotting journeys from written descriptions, calculating speed using the gradient formula, and comparing different journeys on the same axes. Students work with scenarios involving cyclists, cars, walkers, and runners, converting times between minutes and hours whilst ensuring distance and speed units match correctly. These worksheets align with the KS3 National Curriculum requirement to interpret and construct linear graphs in real-world contexts.
Students often lose marks by confusing speed with distance, particularly when describing what a graph shows. Teachers notice that many students can calculate gradient mechanically but struggle to explain that a steeper line represents faster speed. The worksheets address this by requiring written explanations alongside calculations, reinforcing that gradient equals speed and that context matters when interpreting numerical answers.
Which Year Groups Study Distance Time Graphs?
These worksheets cover Year 8 and Year 9 at KS3, where distance time graphs appear within the algebra and ratio strands of the National Curriculum. Students encounter them after mastering coordinate plotting and before tackling more complex velocity-time graphs at GCSE. At this stage, the focus remains on linear sections with constant speeds rather than curved lines representing acceleration.
Progression across these year groups moves from straightforward single-journey graphs with integer values to multi-stage journeys requiring careful interpretation of stationary periods and return legs. Year 9 materials typically introduce more challenging unit conversions, such as converting speeds from m/s to km/h, and expect students to construct their own graphs from written scenarios with less scaffolding than Year 8 resources provide.
How Do You Calculate Speed from a Distance Time Graph?
Speed is calculated by finding the gradient of the line, using the formula: speed equals distance divided by time, or the change in y-coordinates divided by the change in x-coordinates. Students select two points on the line, subtract the distance values, subtract the corresponding time values, then divide distance by time. The steepness of the line directly indicates speed: steeper lines represent faster movement, whilst horizontal lines show zero speed (stationary periods).
This skill connects directly to physics lessons and real-world applications like journey planning and transport logistics. Understanding speed calculations from graphs helps students analyse train timetables, compare delivery routes, and interpret fitness tracker data. In engineering and logistics careers, professionals use distance time relationships to optimise delivery schedules, calculate fuel consumption, and plan efficient transport networks, making this graphical literacy genuinely valuable beyond the classroom.
How Can Teachers Use Distance Time Graph Worksheets Effectively?
The worksheets provide graduated difficulty, beginning with straightforward interpretation questions before progressing to multi-step problems requiring calculations and graph construction. This scaffolding allows teachers to identify precisely where understanding breaks down, whether students struggle with reading scales, calculating gradient, or applying context to numerical answers. The included answer sheets show full working, which helps students identify where their method diverges from the correct approach.
Many teachers use these worksheets for targeted intervention with students who find abstract algebraic gradient confusing, as the real-world context makes the concept more accessible. They work well as homework following introductory lessons, allowing students to consolidate understanding independently. In paired work, students can check each other's graphs against the answers, discussing why certain features appear, which develops mathematical reasoning alongside procedural fluency.