Exponential Functions Worksheets
All worksheets are created by the team of experienced teachers at Cazoom Maths.
What are exponential functions in maths?
Exponential functions are mathematical expressions where the variable appears in the exponent, typically written in the form y = a × b^x, where a represents the initial value and b is the base determining the rate of growth or decay. At KS4, students encounter these functions when studying algebraic relationships that change multiplicatively rather than additively, meeting National Curriculum expectations for recognising and using exponential models.
A common error occurs when students attempt to solve exponential equations by treating them as linear, for instance writing 2^x = 16 and incorrectly concluding x = 8 instead of x = 4. Teachers observe that students who struggle with this topic often haven't fully grasped the difference between repeated multiplication (exponential) and repeated addition (linear), which is why visual representations through graphing prove particularly valuable for building conceptual understanding.
Which year groups study exponential functions?
Exponential functions appear in the KS4 curriculum, with these worksheets designed for Year 10 and Year 11 students working towards their GCSE examinations. This topic typically emerges after students have developed confidence with linear and quadratic functions, as it requires understanding of indices and the ability to manipulate algebraic expressions involving powers.
The progression across Year 10 and Year 11 moves from recognising and sketching simple exponential graphs to solving more complex problems involving exponential growth and decay models. Year 10 work often focuses on understanding the basic structure and graphical properties, whilst Year 11 students tackle contextualised problems requiring them to interpret real-world situations, form exponential models and make predictions, skills that exam mark schemes increasingly reward at higher GCSE tiers.
How do you sketch exponential graphs?
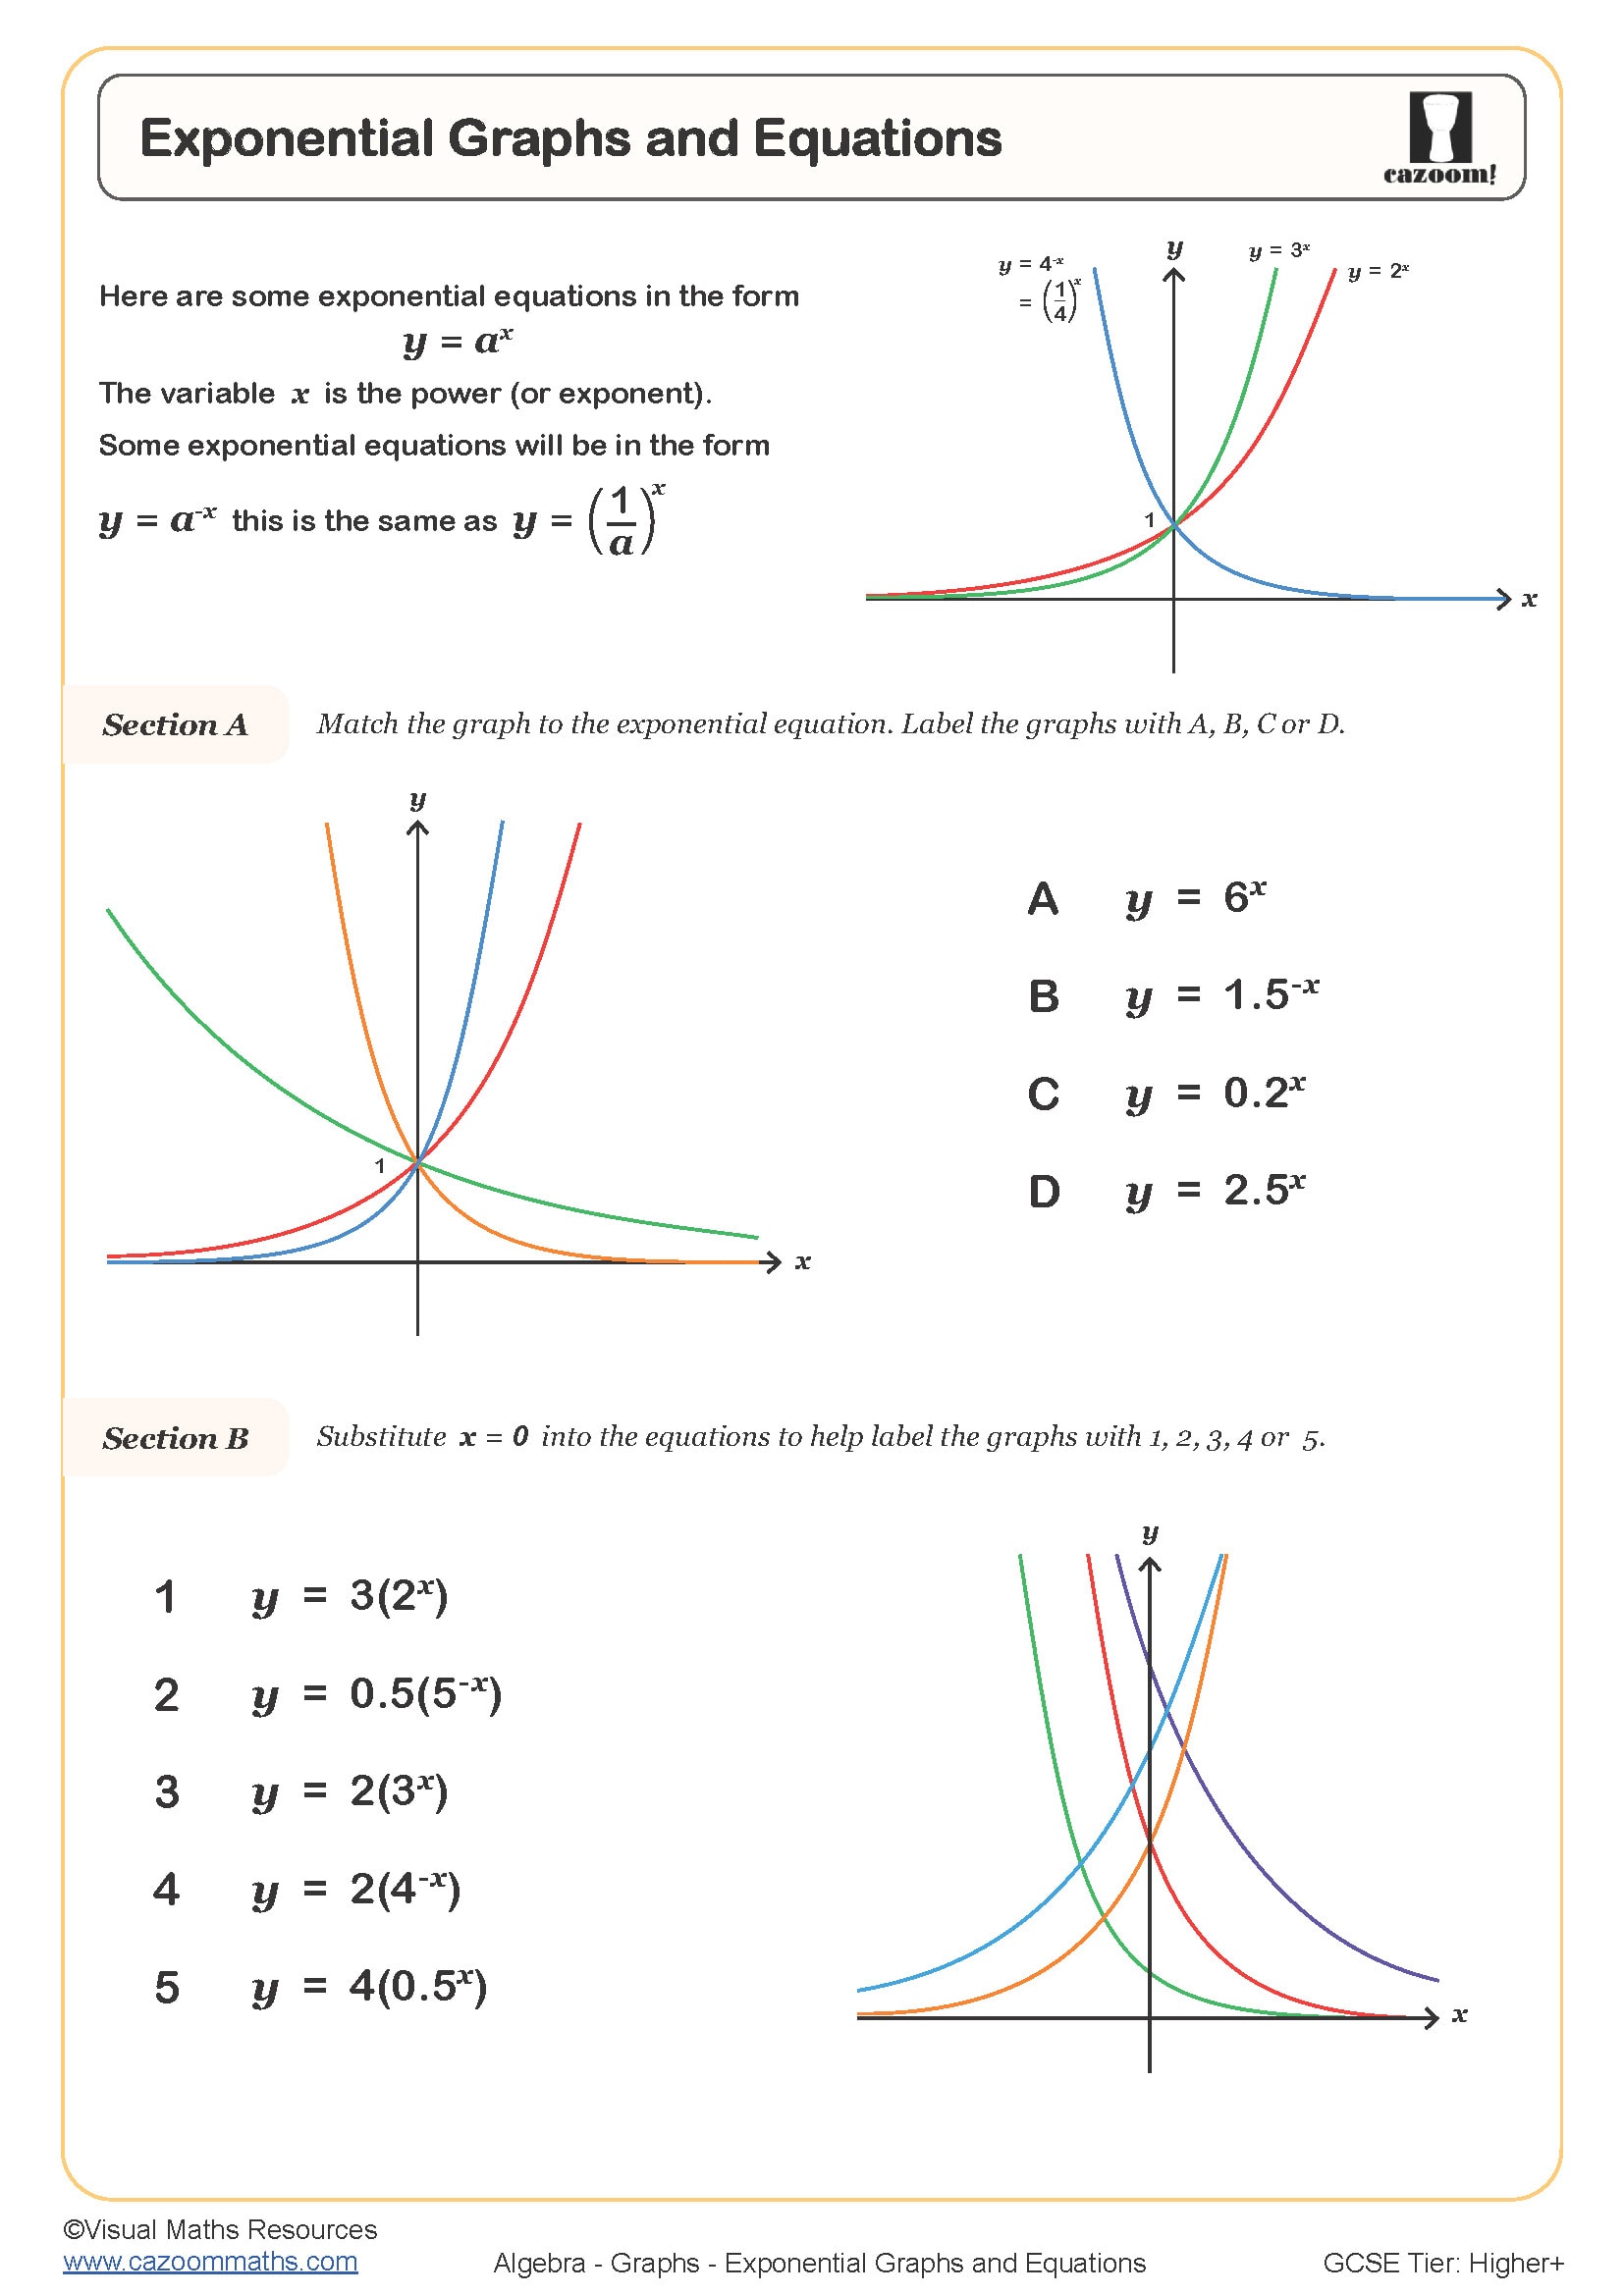
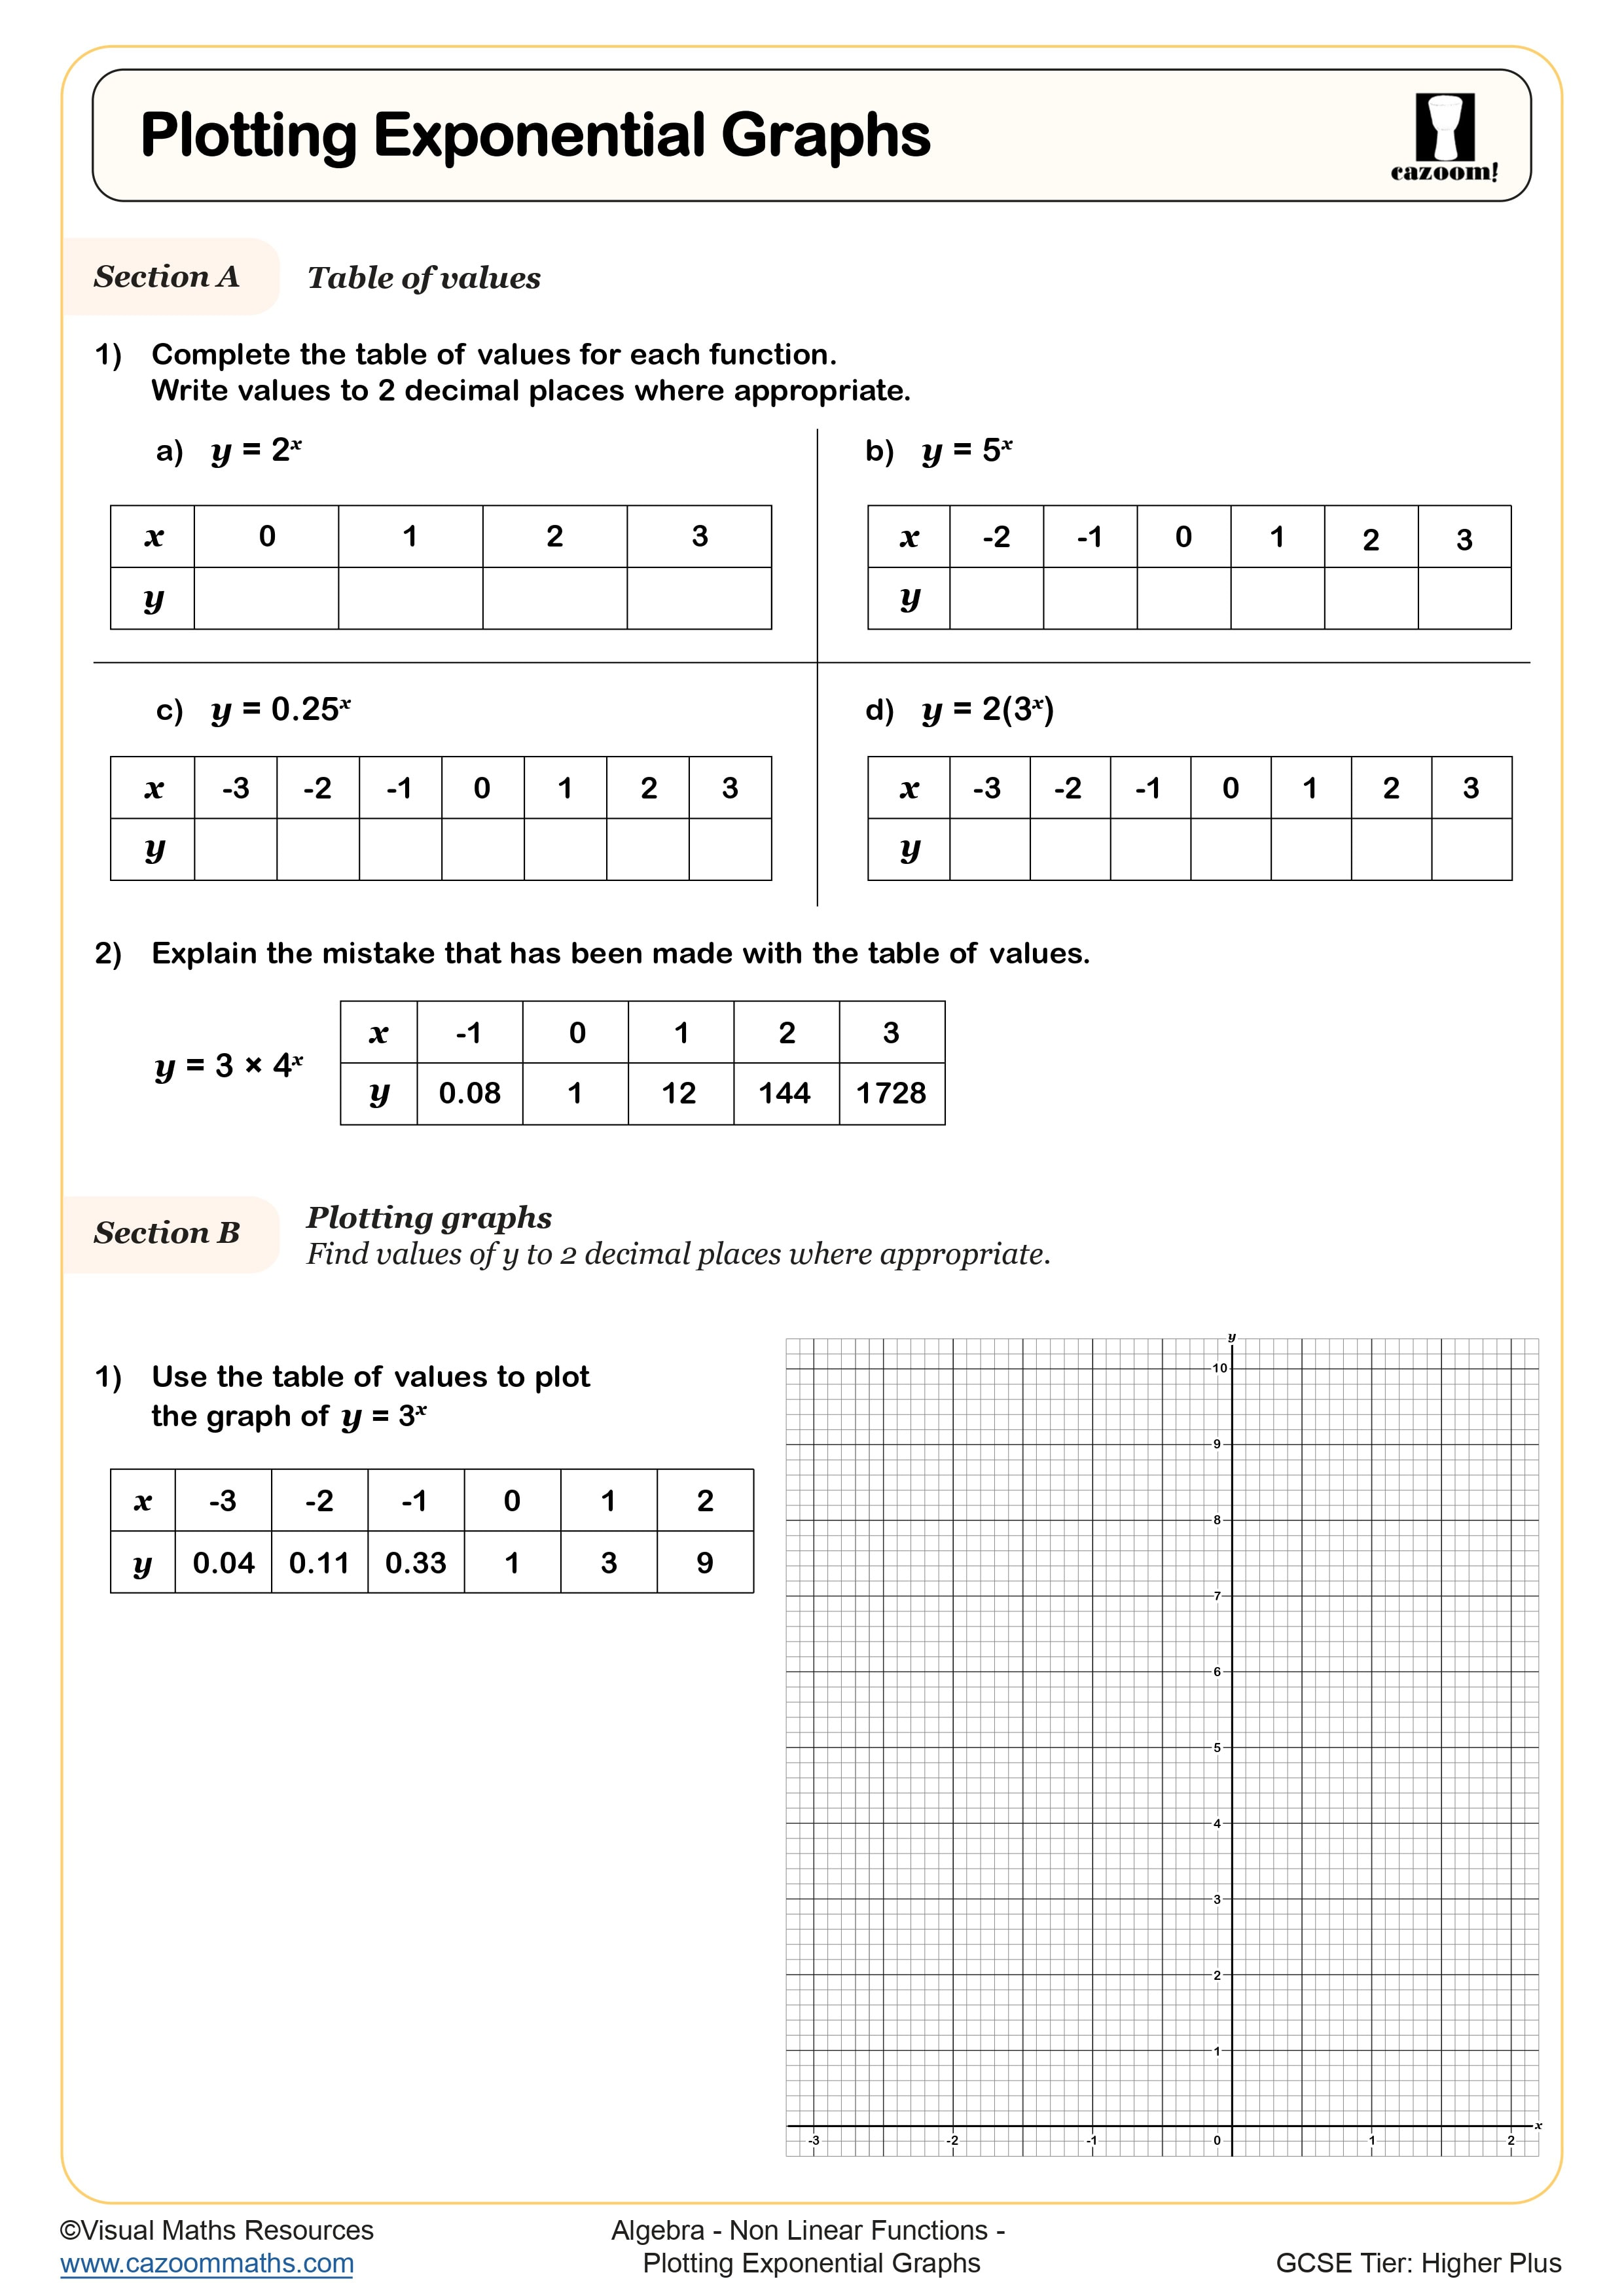
Sketching exponential graphs requires students to identify key features: the y-intercept (which equals the coefficient a when x = 0), the horizontal asymptote (usually the x-axis for functions like y = a × b^x), and whether the function represents growth (b > 1) or decay (0 < b < 1). Students should plot several coordinate pairs to establish the curve's shape, noting that exponential graphs never touch the x-axis and either increase or decrease at an ever-changing rate.
This skill connects directly to biological sciences, where exponential growth models describe bacterial population doubling times under ideal conditions. Pharmaceutical companies use exponential decay functions to predict how quickly drug concentrations decrease in the bloodstream, determining appropriate dosage intervals. Teachers find that presenting these STEM applications helps students appreciate why understanding exponential behaviour matters beyond passing examinations, particularly for those considering careers in medicine, environmental science or economics.
How can these exponential functions worksheets support classroom teaching?
The worksheets provide structured practice that builds from recognising exponential patterns through to solving contextual problems, with answer sheets enabling students to check their working independently or allowing teachers to quickly assess understanding during lessons. The progression within each worksheet helps students develop confidence with notation before moving to more demanding graphical and problem-solving questions.
Many teachers use these resources for differentiated homework, allowing students to consolidate taught methods at their own pace, or as intervention materials for students who need additional support before assessments. The worksheets work effectively in paired activities where students can compare their graphical sketches and discuss why certain features appear, helping them articulate their mathematical reasoning. The complete answer sheets also make these resources valuable for revision sessions, where students working independently can identify gaps in their understanding and seek targeted support on specific question types.