Plotting Linear Functions Worksheets
All worksheets are created by the team of experienced teachers at Cazoom Maths.
What Are Linear Functions and Why Do We Plot Them?
A linear function is any equation that produces a straight line when graphed on a coordinate grid. These functions typically take the form y = mx + c, where m represents the gradient (steepness) and c represents the y-intercept (where the line crosses the y-axis). Plotting linear functions helps students visualise the relationship between variables and understand how changing one value affects another.
This skill forms a cornerstone of algebra across KS3 and KS4, appearing throughout GCSE mathematics. Students who can confidently plot and interpret linear graphs develop stronger problem-solving abilities in topics ranging from simultaneous equations to real-world modelling scenarios. The visual representation makes abstract algebraic concepts more accessible and memorable.
Which Year Groups Study Plotting Linear Functions?
Plotting linear functions features prominently across Years 7, 8, 9, and 10, making it a sustained focus throughout secondary mathematics education. Students typically begin in Year 7 with basic coordinate plotting and simple straight-line graphs before progressing to more sophisticated equation forms. By Year 8 and 9, they work with gradient and y-intercept, whilst Year 10 students tackle more complex variations including rearranging equations and interpreting gradients in context.
Our worksheets reflect this progression, with carefully differentiated activities appropriate for both Key Stage 3 and Key Stage 4. Each year group builds upon prior knowledge, ensuring students develop the depth of understanding required for GCSE examination questions. The range of difficulty levels allows teachers to target specific learning needs within their classes.
How Do Students Find the Gradient and Y-Intercept?
The gradient (m) determines how steep a line is and whether it slopes upwards or downwards. Students calculate gradient by finding the change in y divided by the change in x between any two points on the line, often remembered as 'rise over run'. A positive gradient slopes upwards from left to right, whilst a negative gradient slopes downwards. The y-intercept (c) is simply where the line crosses the y-axis, which occurs when x equals zero.
When equations are written in the form y = mx + c, these values are immediately visible. Our worksheets provide practice identifying gradients and y-intercepts from equations, calculating them from coordinates, and using them to draw accurate graphs. This understanding proves essential for GCSE topics including simultaneous equations and interpreting real-world linear relationships.
What's Included in These Plotting Linear Functions Worksheets?
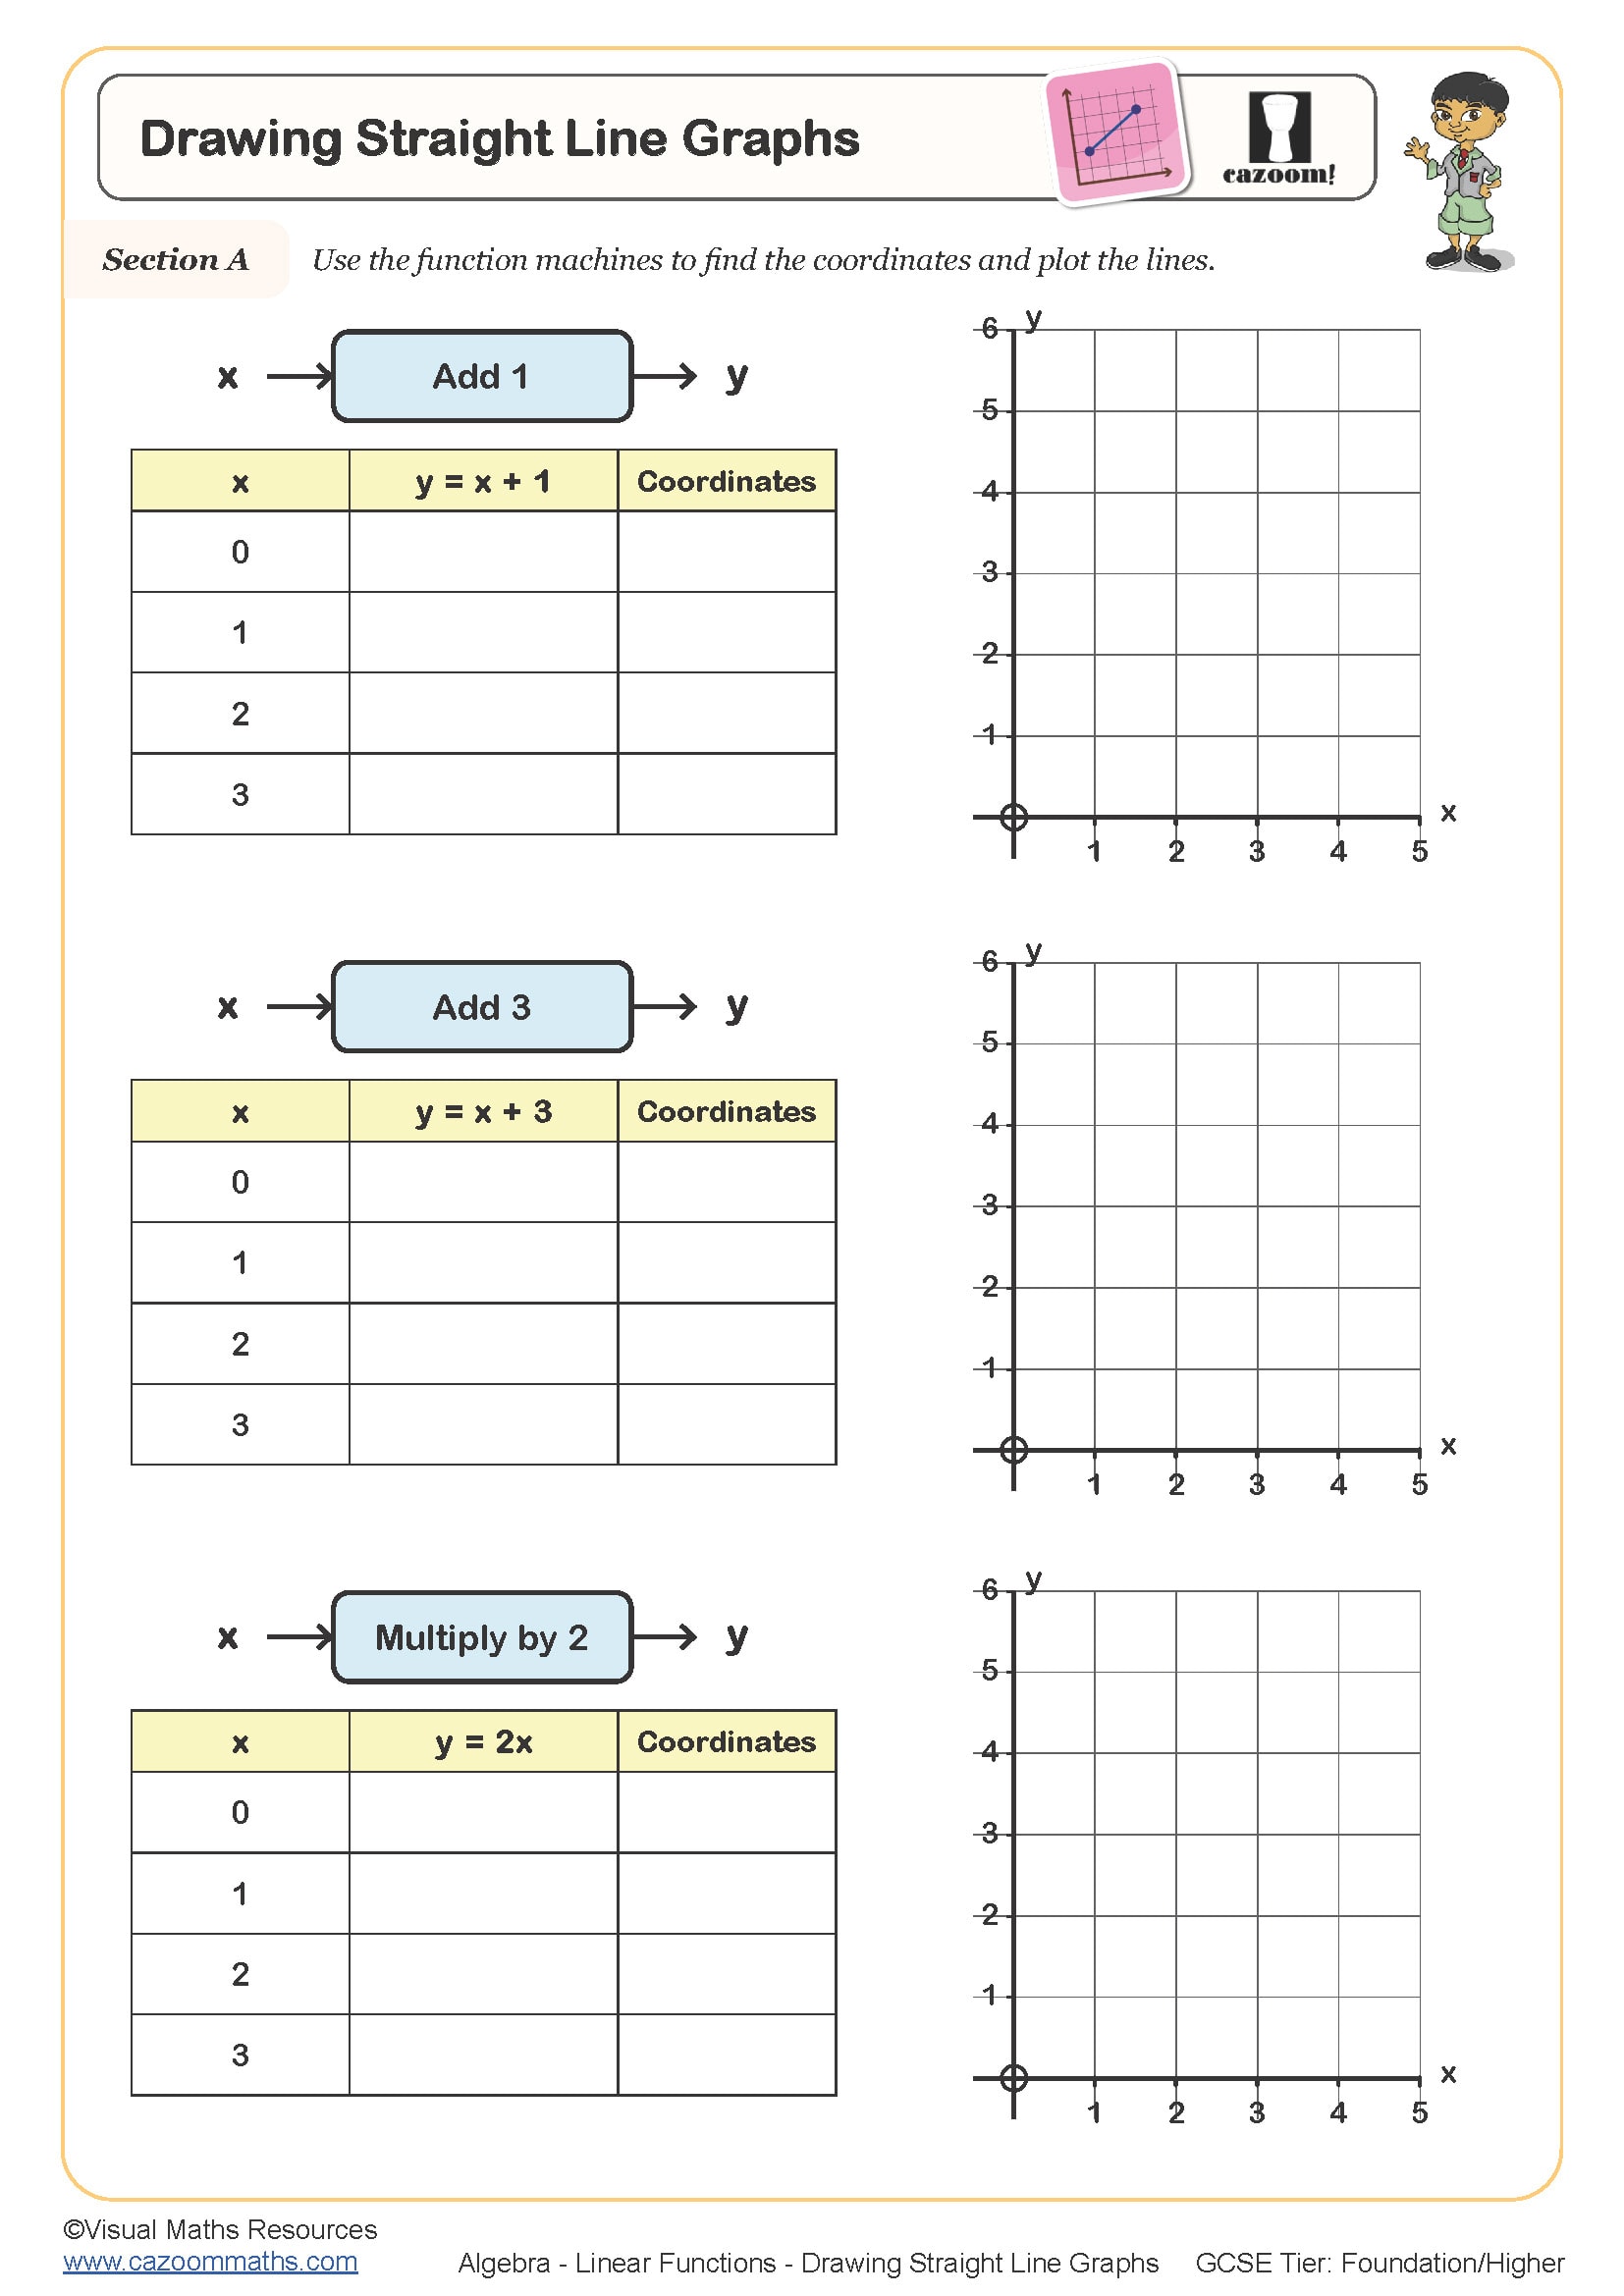
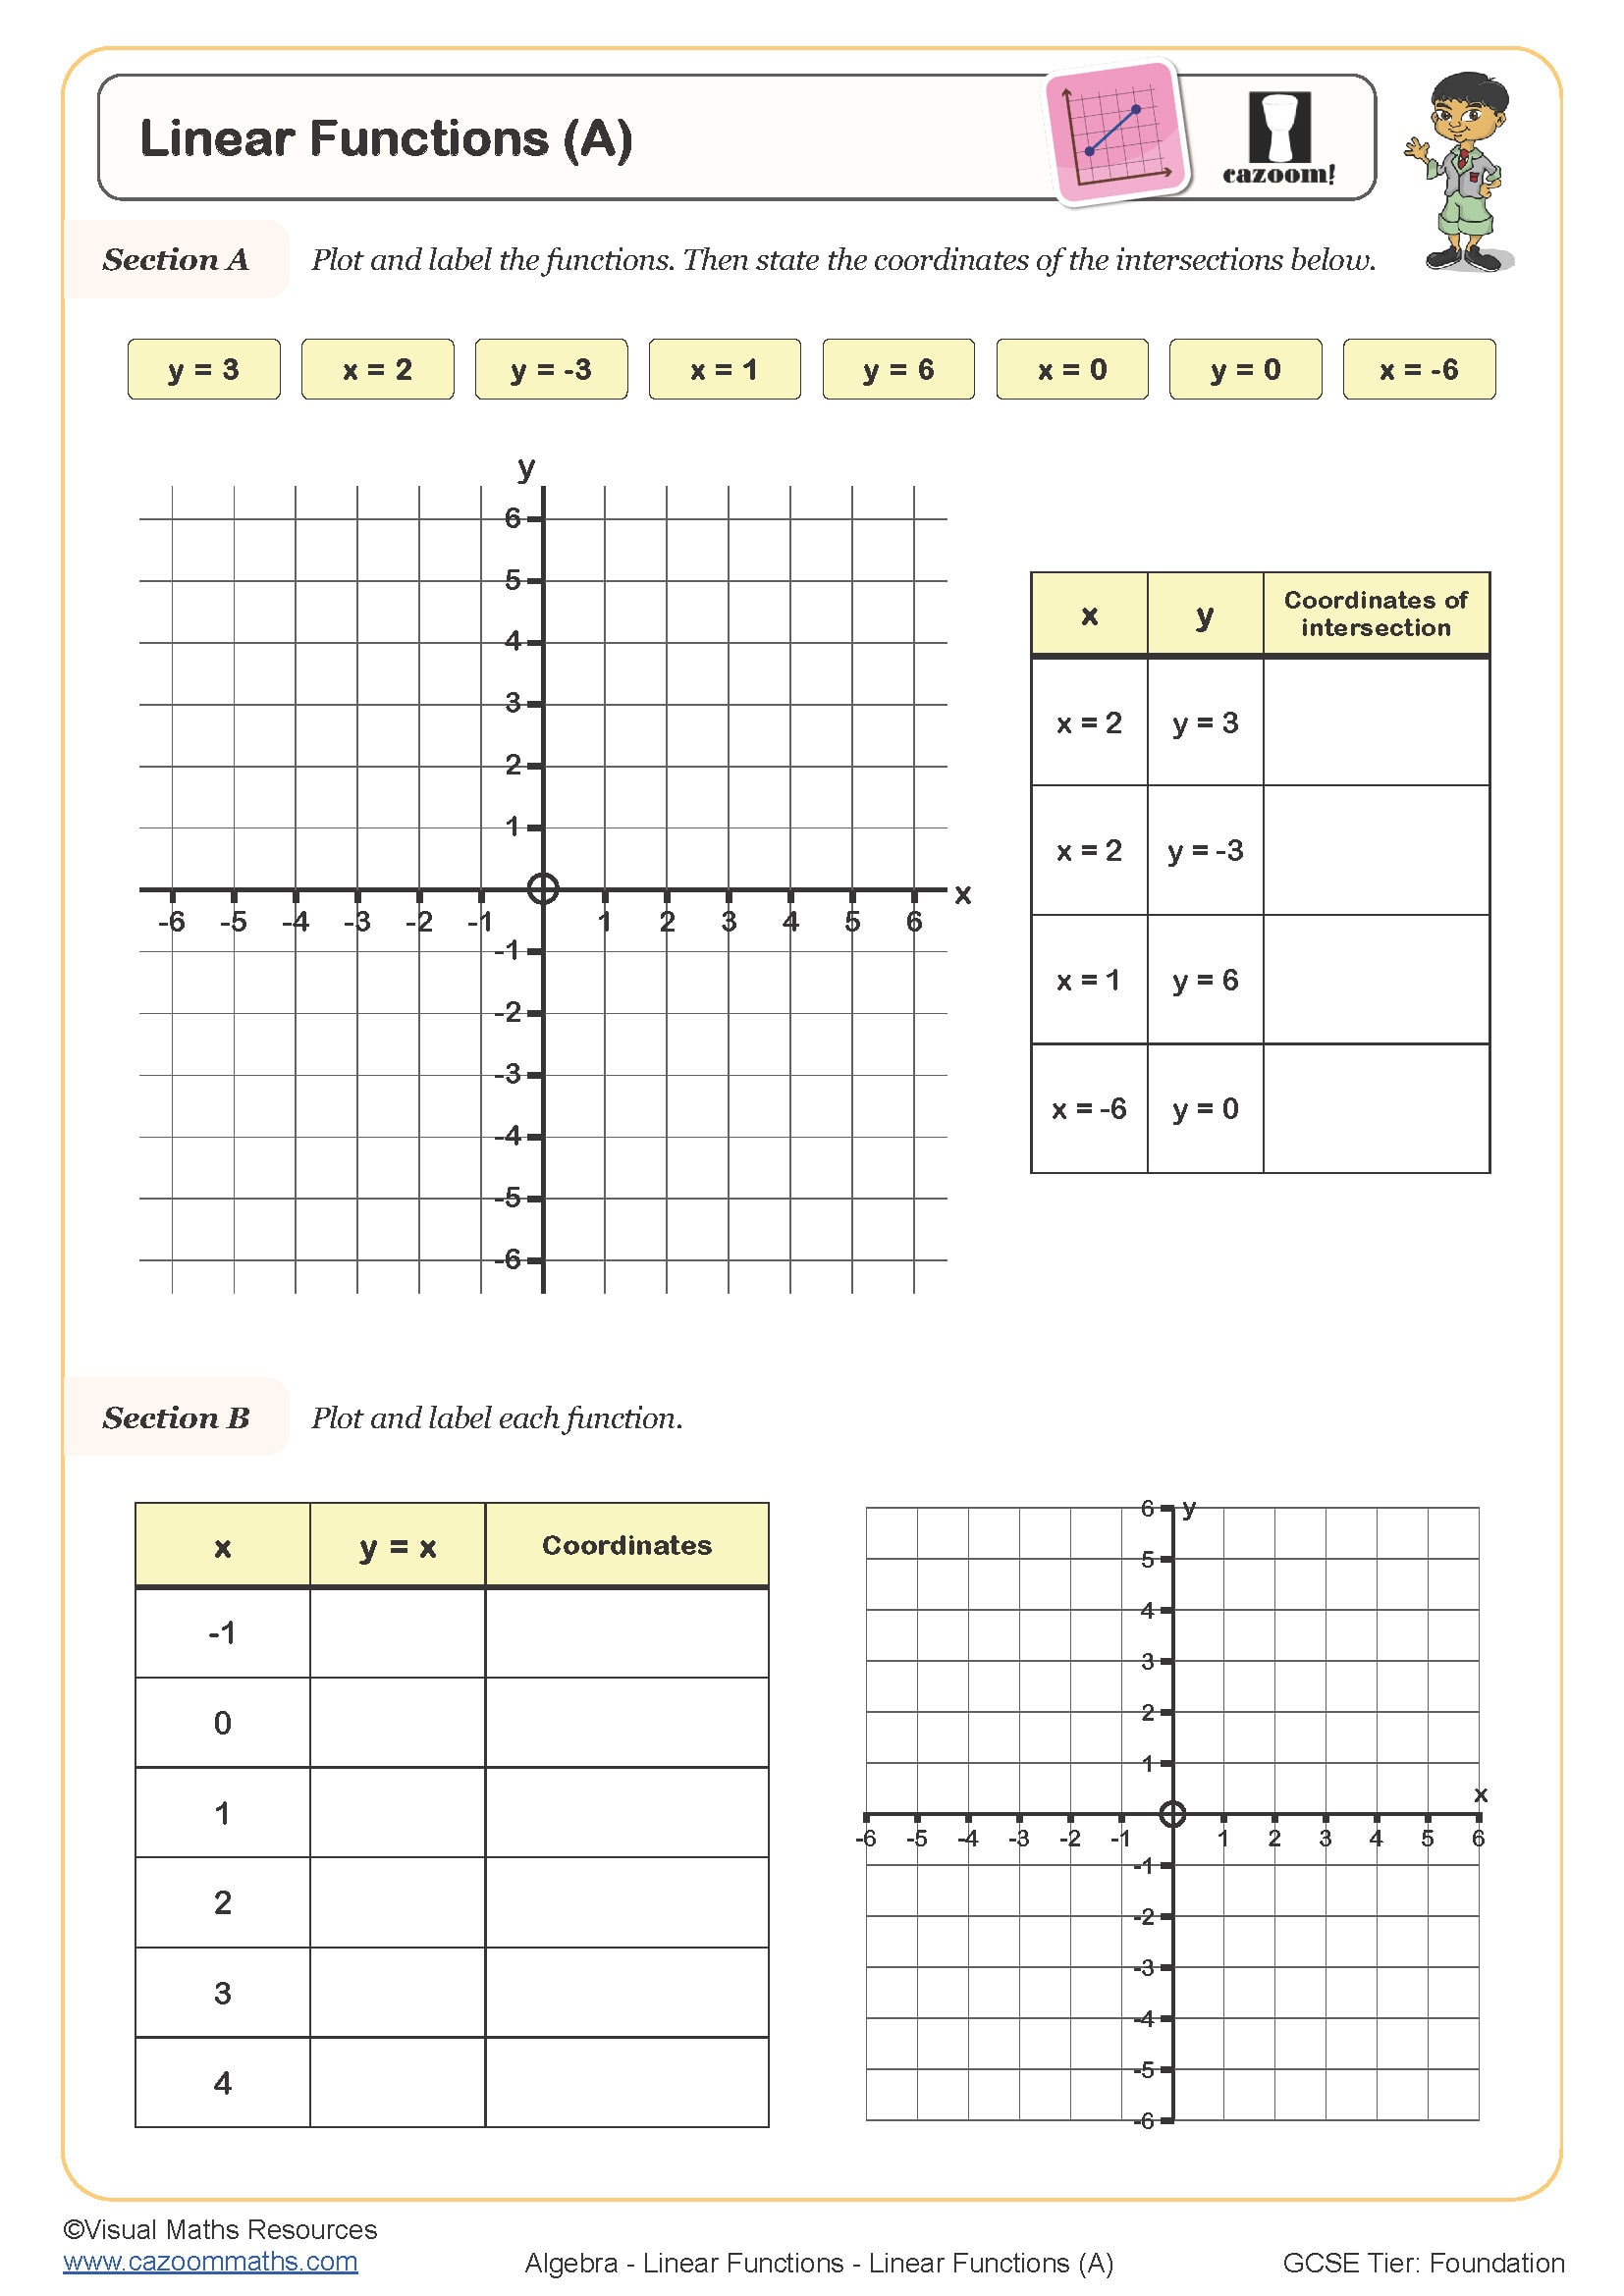
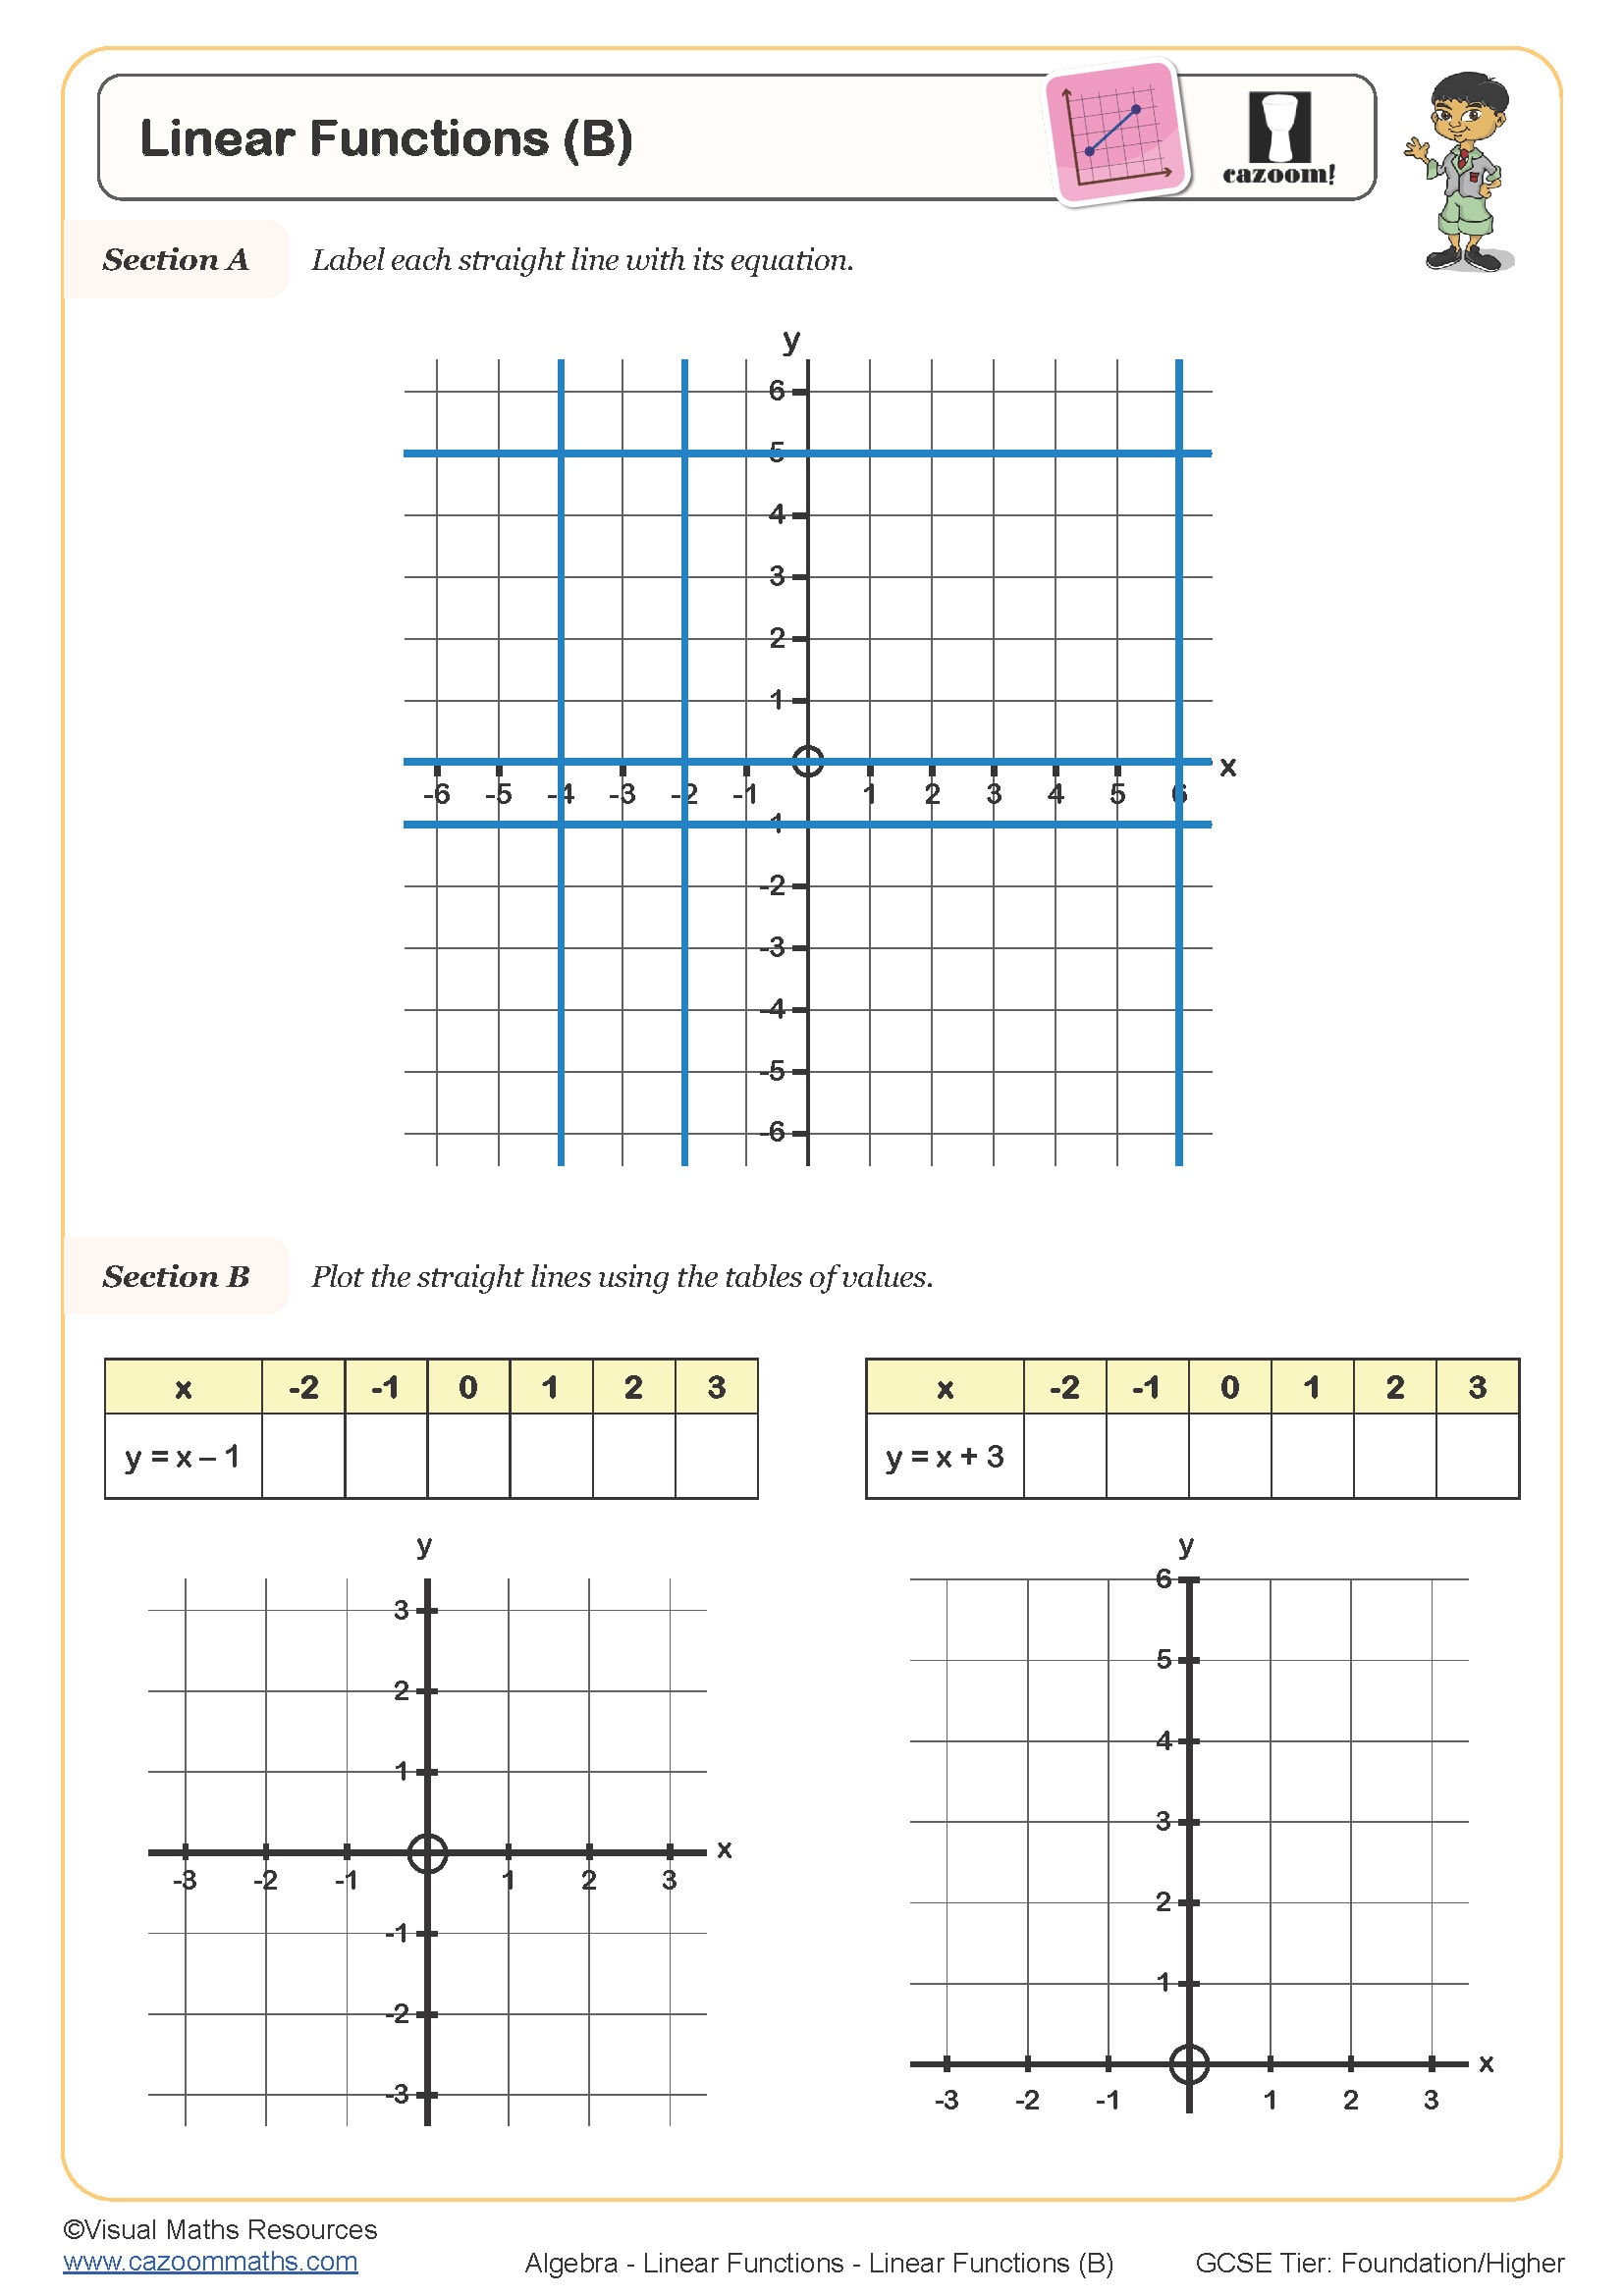
Each worksheet includes carefully structured questions progressing from straightforward plotting tasks to more challenging applications. Students practise creating tables of values, plotting coordinates accurately, drawing straight lines through points, and identifying key features of linear graphs. Questions incorporate various equation forms to build flexibility, and many include contextual problems that demonstrate practical applications of linear functions.
Complete answer sheets accompany every worksheet, showing worked solutions where appropriate. This allows students to check their graphs and self-correct, whilst teachers can quickly assess understanding or set homework with confidence. All resources download as PDFs, ready to print for classroom use or share digitally. The worksheets suit both initial teaching and revision, supporting students throughout their study of linear functions from KS3 through to GCSE preparation.