Rates of Change Worksheets
All worksheets are created by the team of experienced teachers at Cazoom Maths.
What Are Rates of Change in Maths?
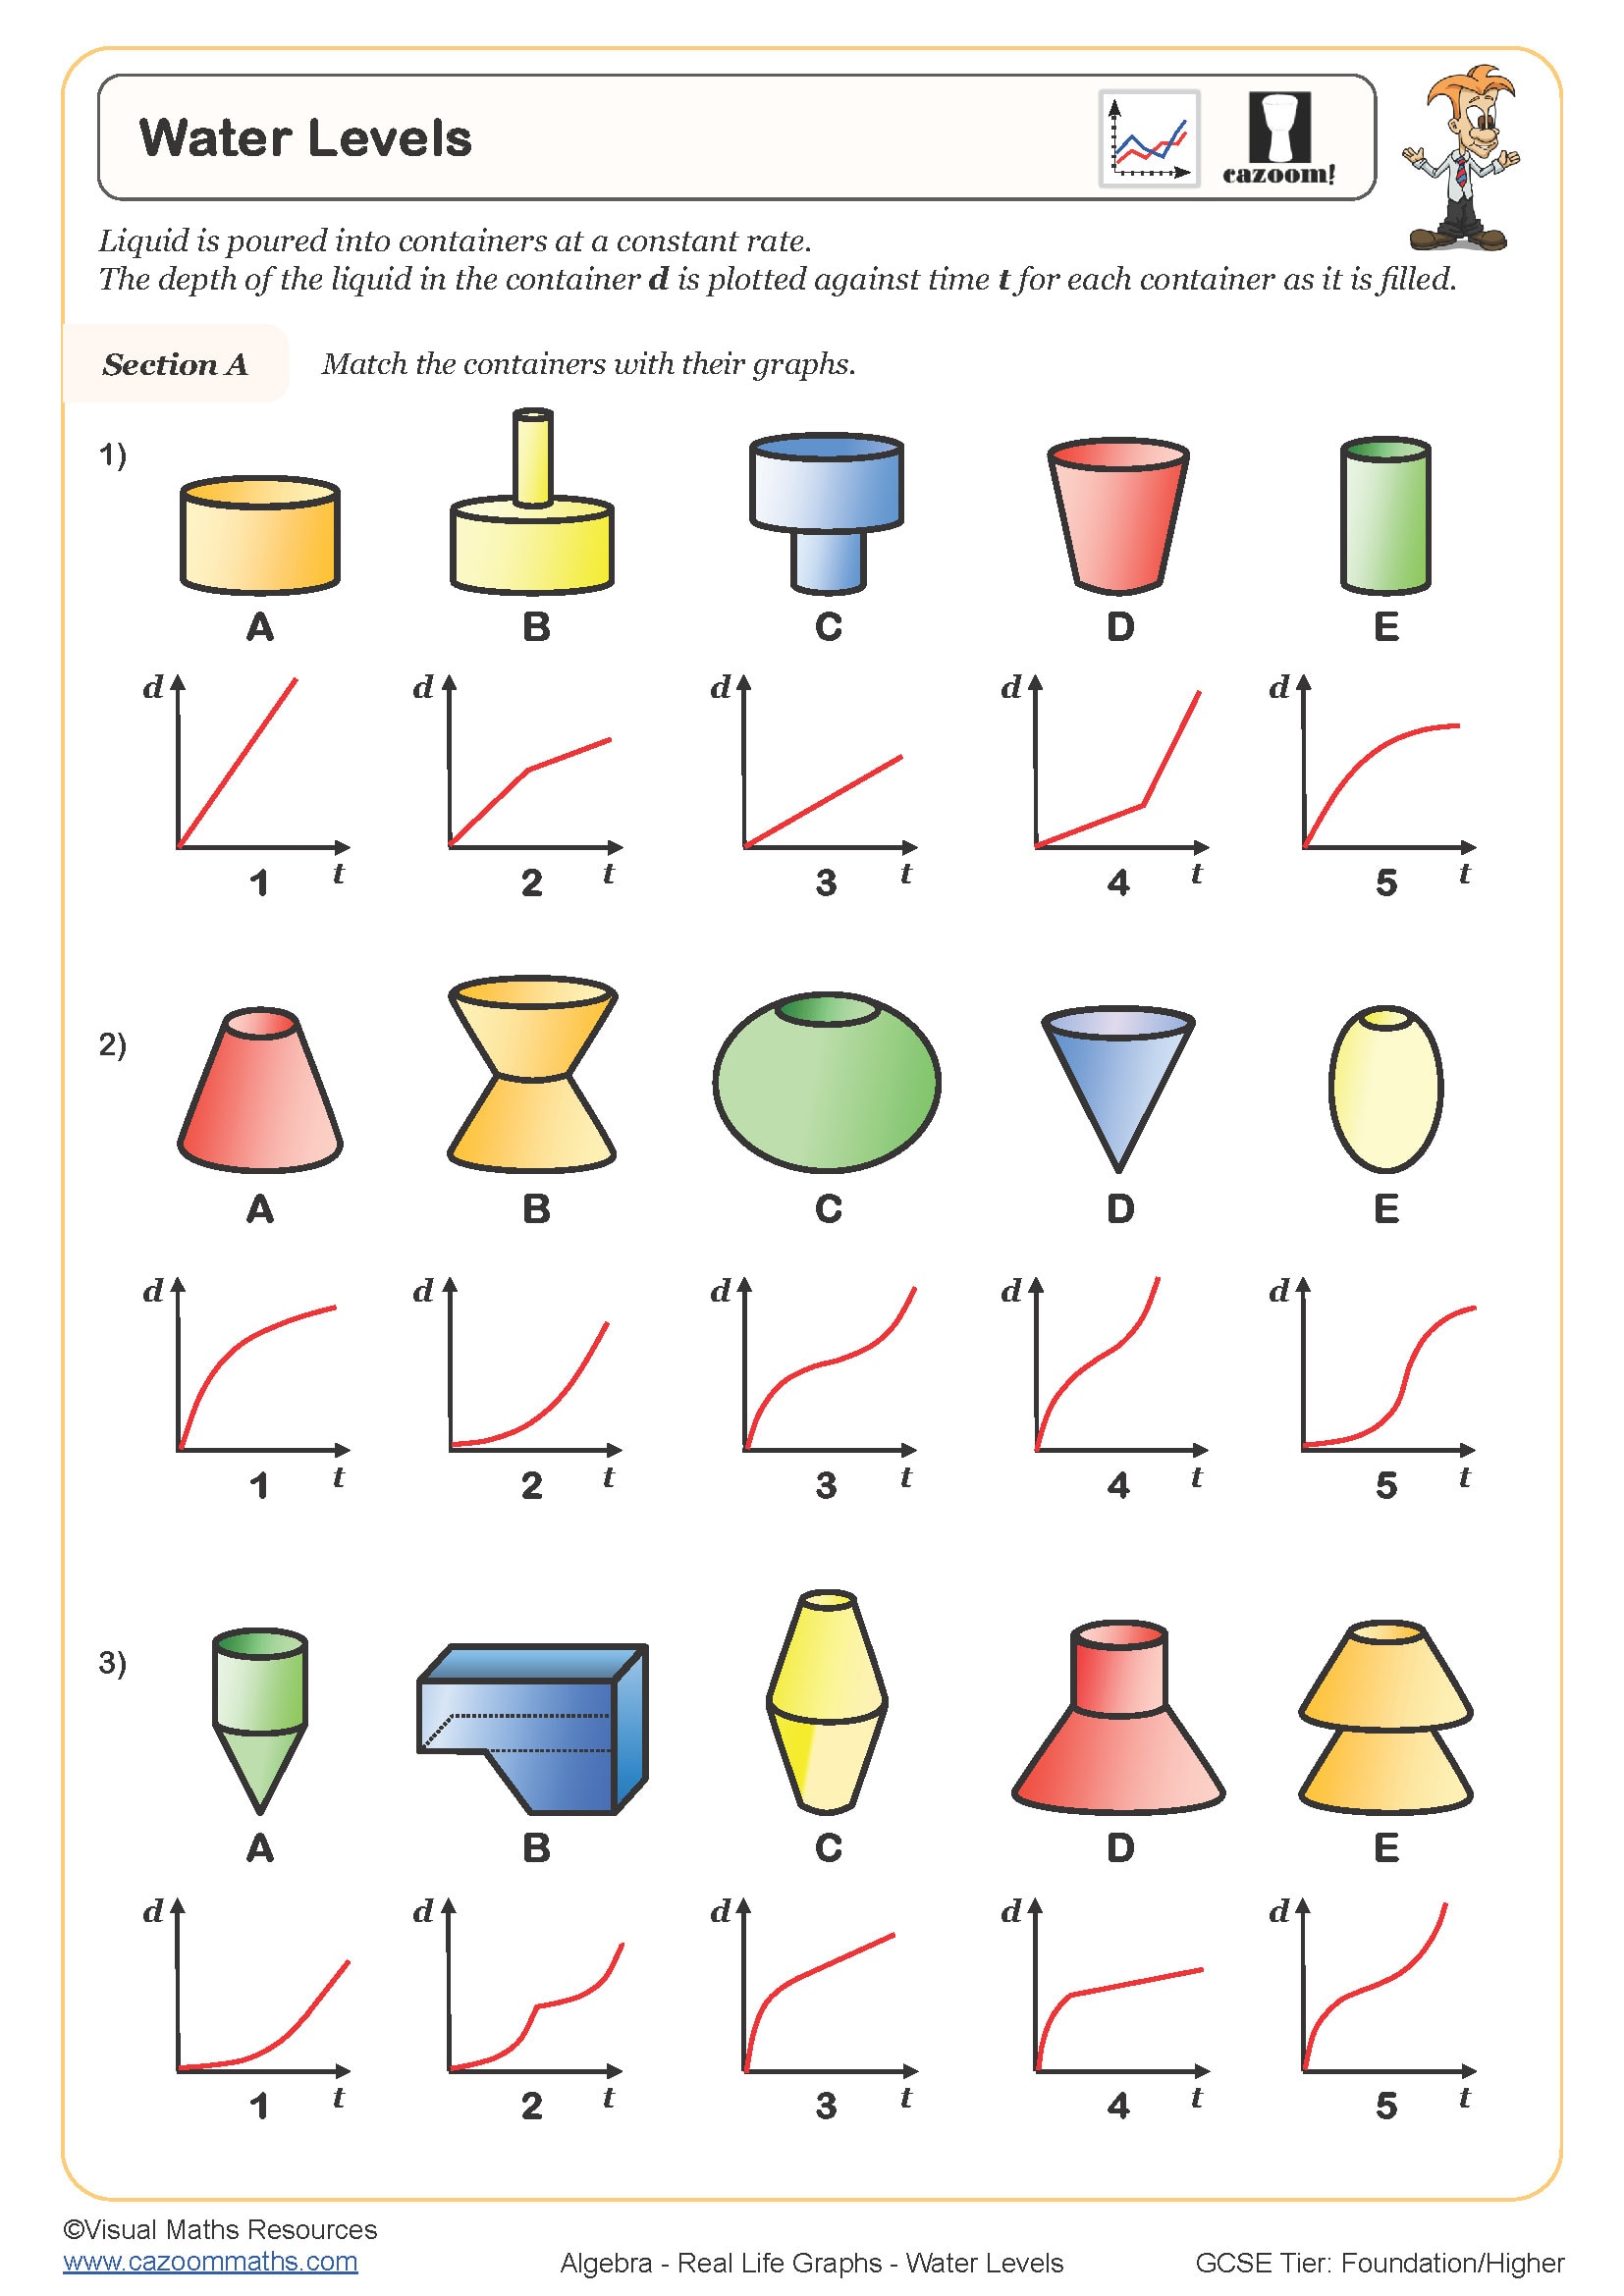
Rates of change measure how one quantity varies in relation to another. In the National Curriculum, students first encounter this through gradient of straight lines, then progress to interpreting gradients of curves and understanding instantaneous rates. The concept connects algebraic thinking with graphical representation, forming essential groundwork for calculus at A-level.
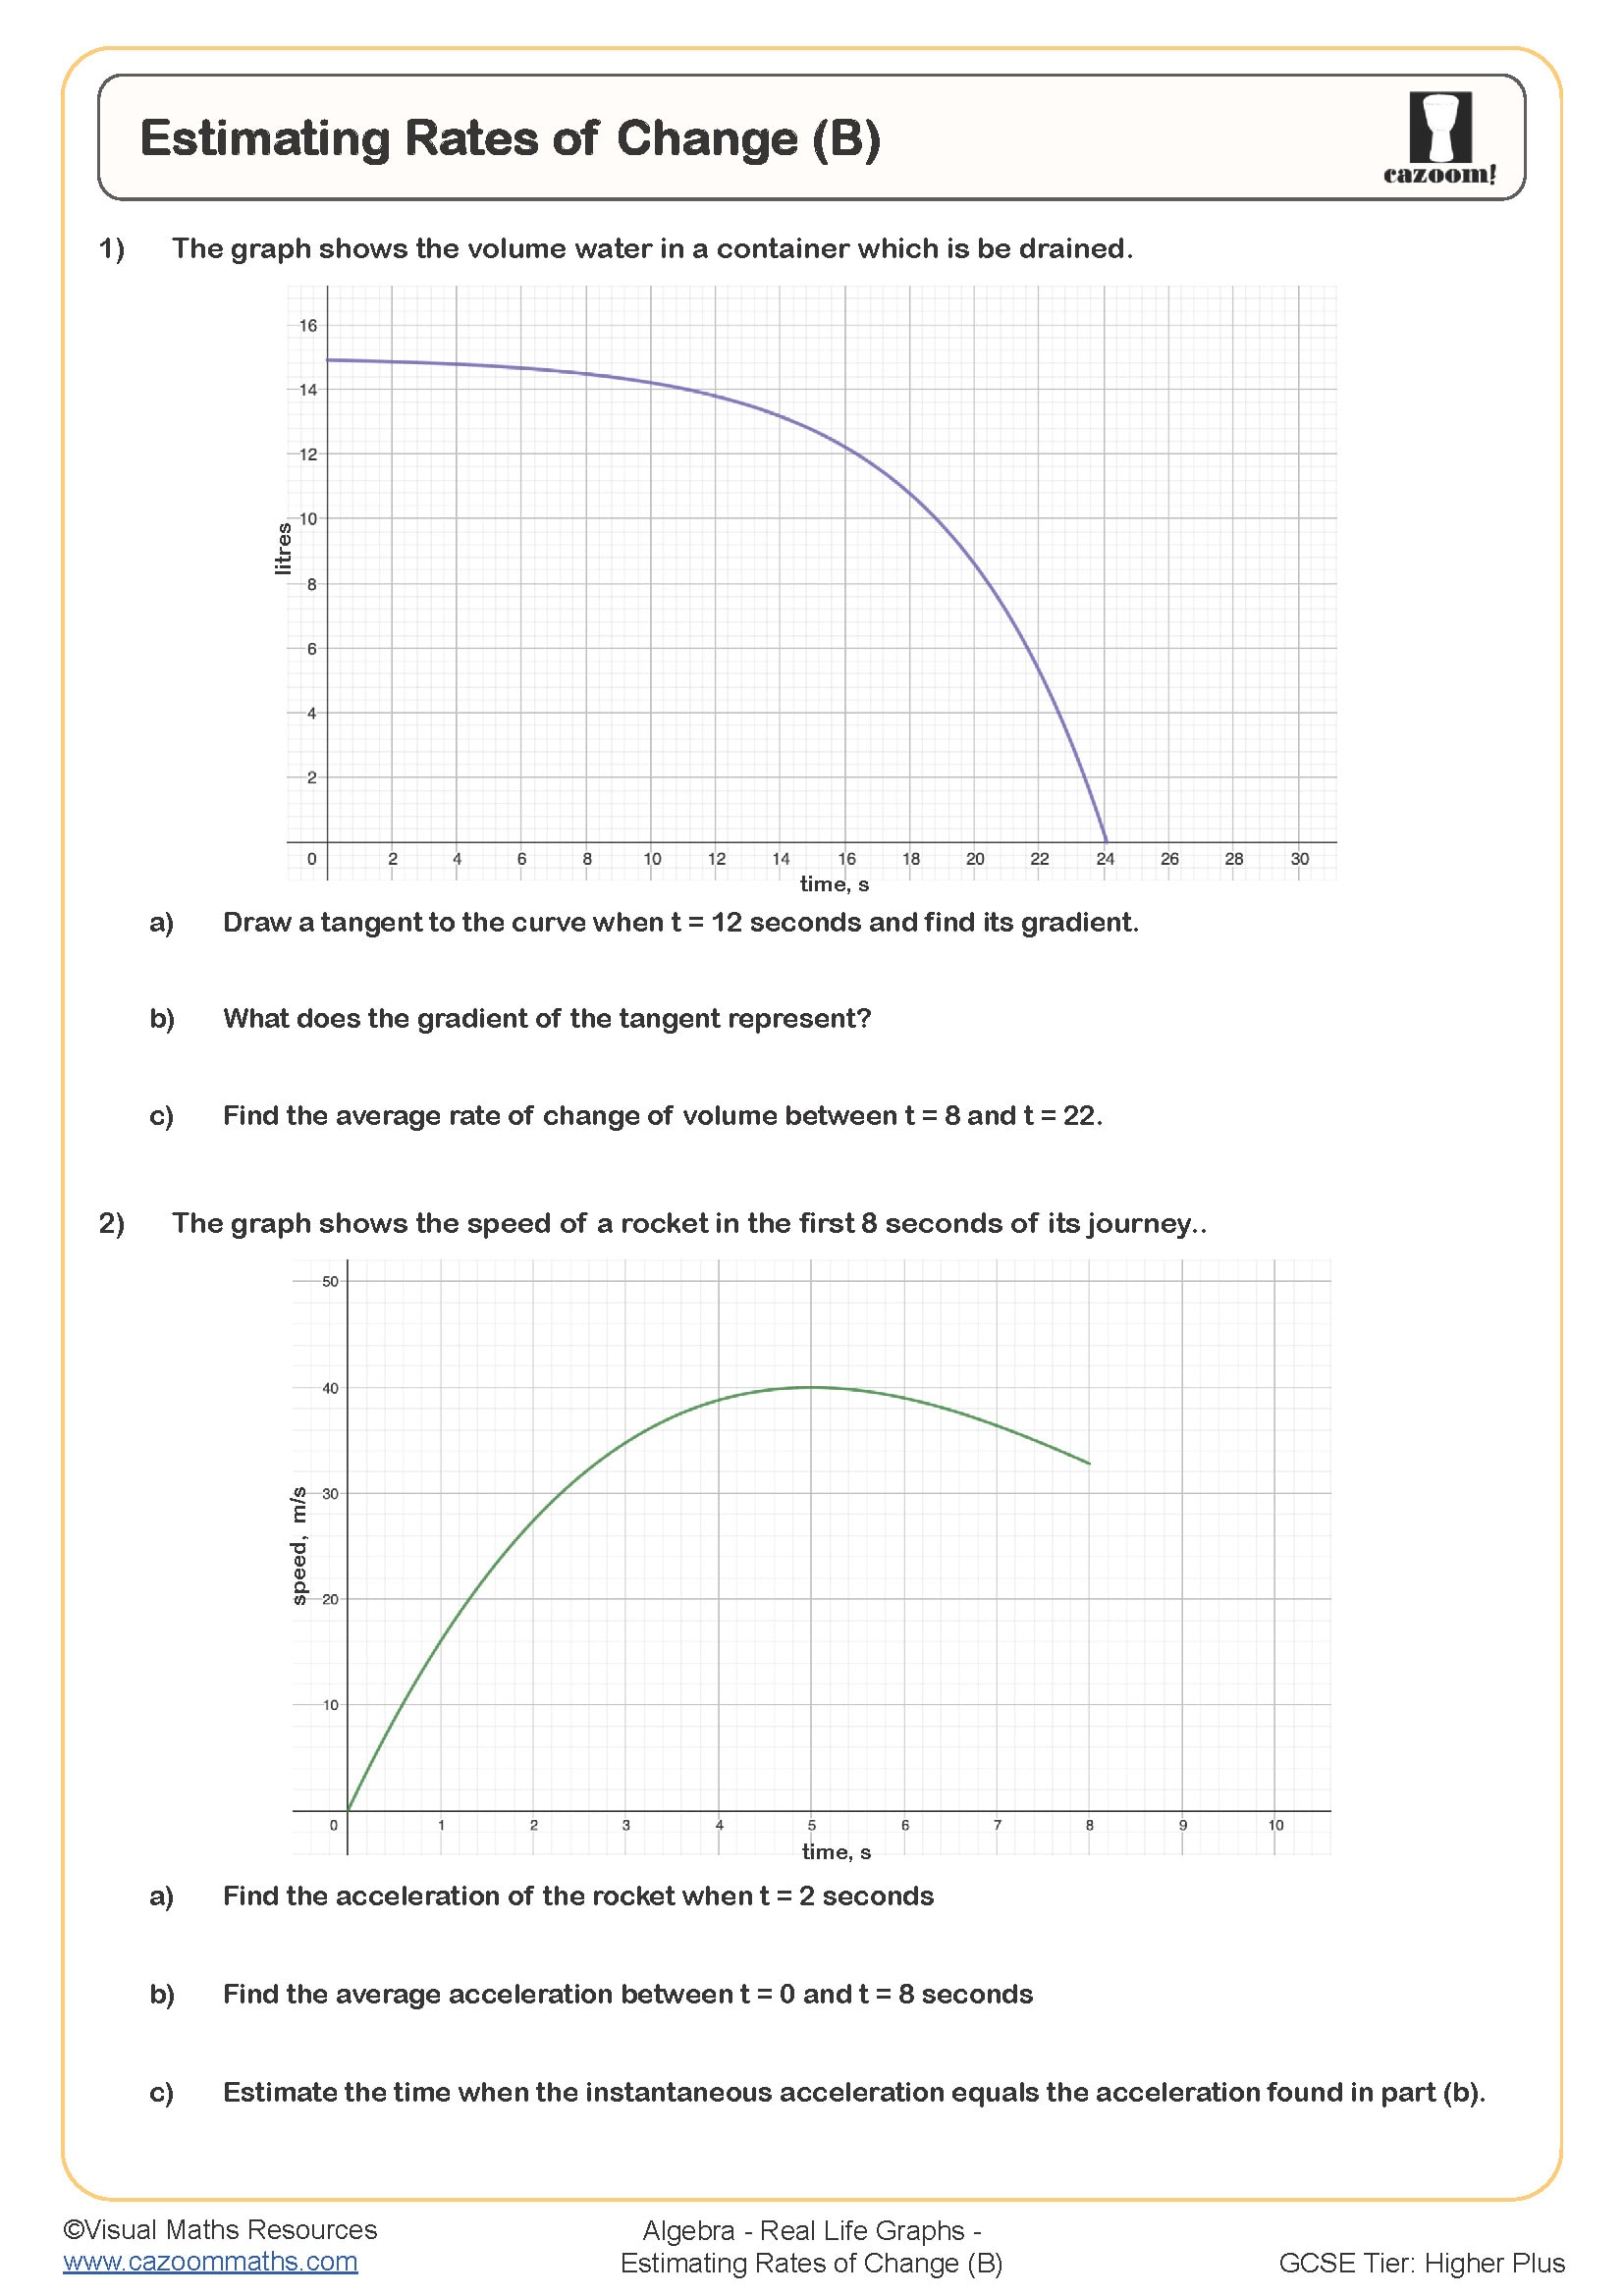
Common applications include speed (distance changing over time), population growth, and temperature variation. Students learn to calculate average rates of change from tables and graphs, interpret steepness as magnitude of change, and distinguish between constant and variable rates. This topic appears throughout GCSE examination papers, particularly in contexts requiring graph interpretation and practical problem-solving.
Which Year Groups Study Rates of Change?
Rates of change appear in the curriculum from Year 8 through to Year 11, spanning both key stages. At KS3 (Years 8-9), students develop foundational understanding through gradient calculations and distance-time graphs. They learn to recognise that gradient represents rate of change and practise finding rates from linear relationships.
At KS4 (Years 10-11), the concept deepens significantly. Students analyse non-linear graphs, calculate rates from curved sections, and apply understanding to GCSE contexts including velocity-time graphs and compound measures. Foundation tier students work with constant rates whilst Higher tier students tackle instantaneous rates and gradients of tangents, preparing them for differentiation in post-16 mathematics.
How Do You Calculate Rate of Change from Graphs?
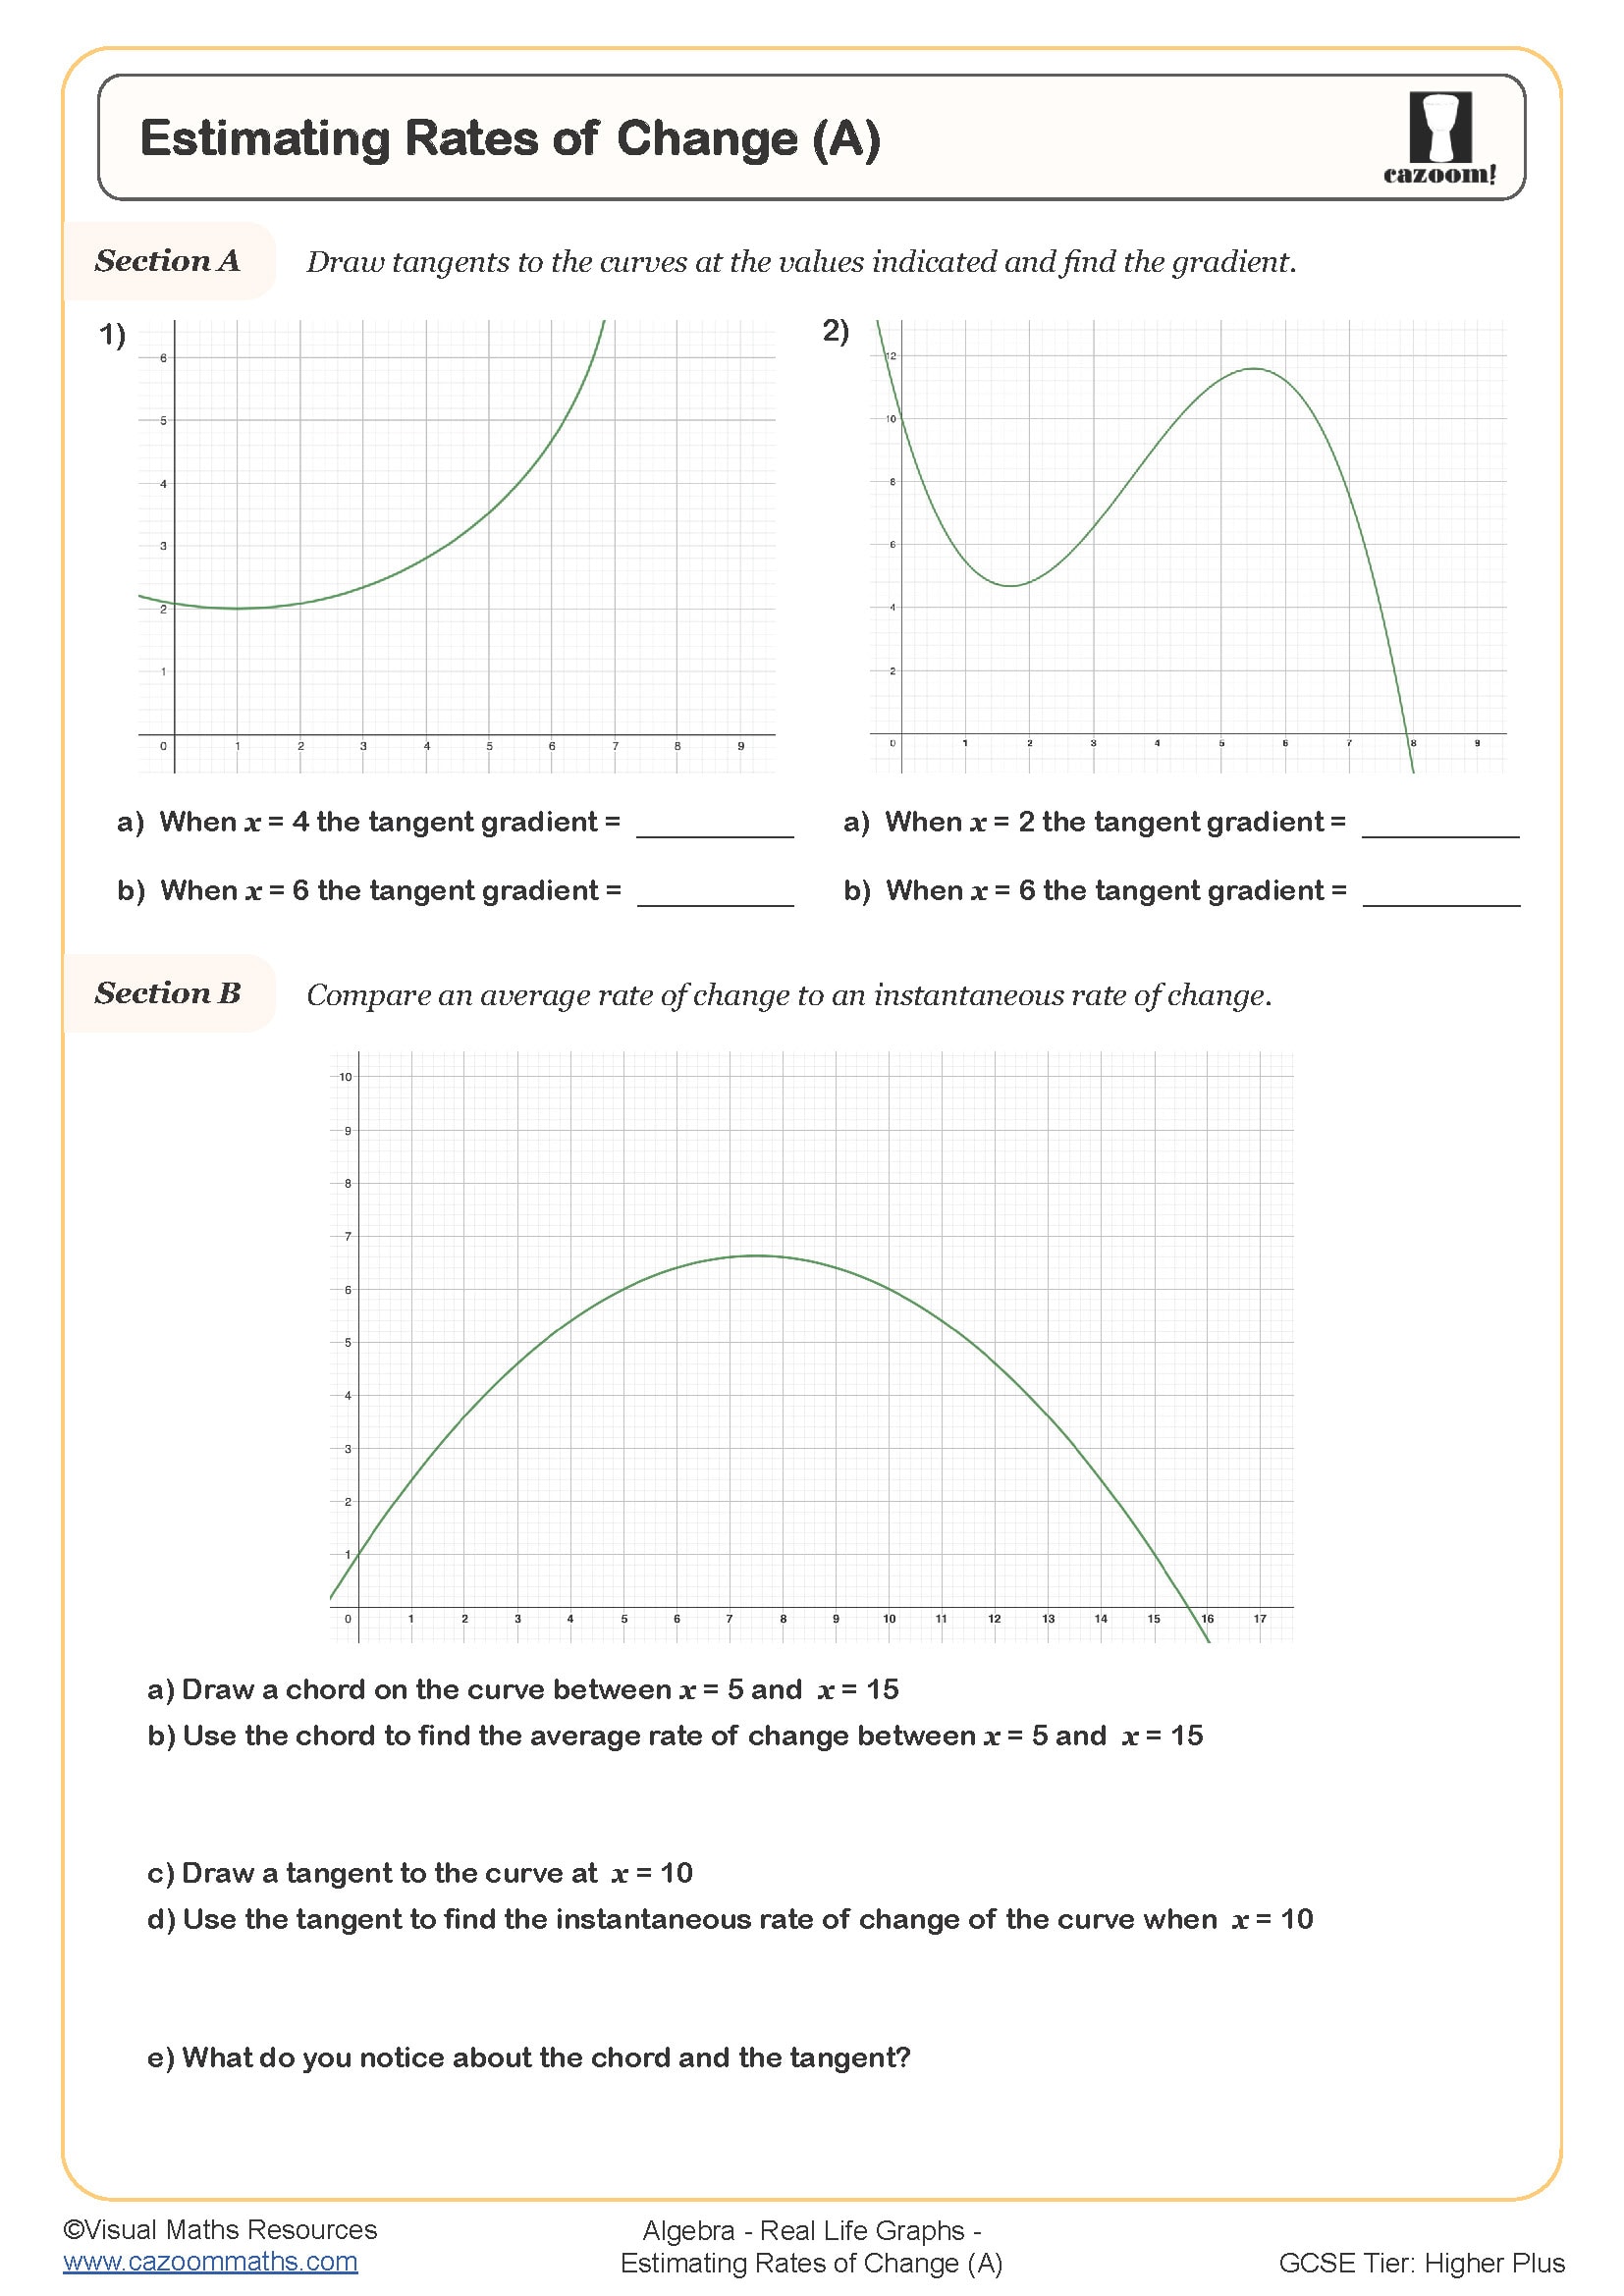
Calculating rate of change from graphs requires identifying the gradient between two points or at a specific point. For straight-line sections, students use the formula (change in y)/(change in x), selecting appropriate coordinates from the graph. This gives the average rate of change between those positions.
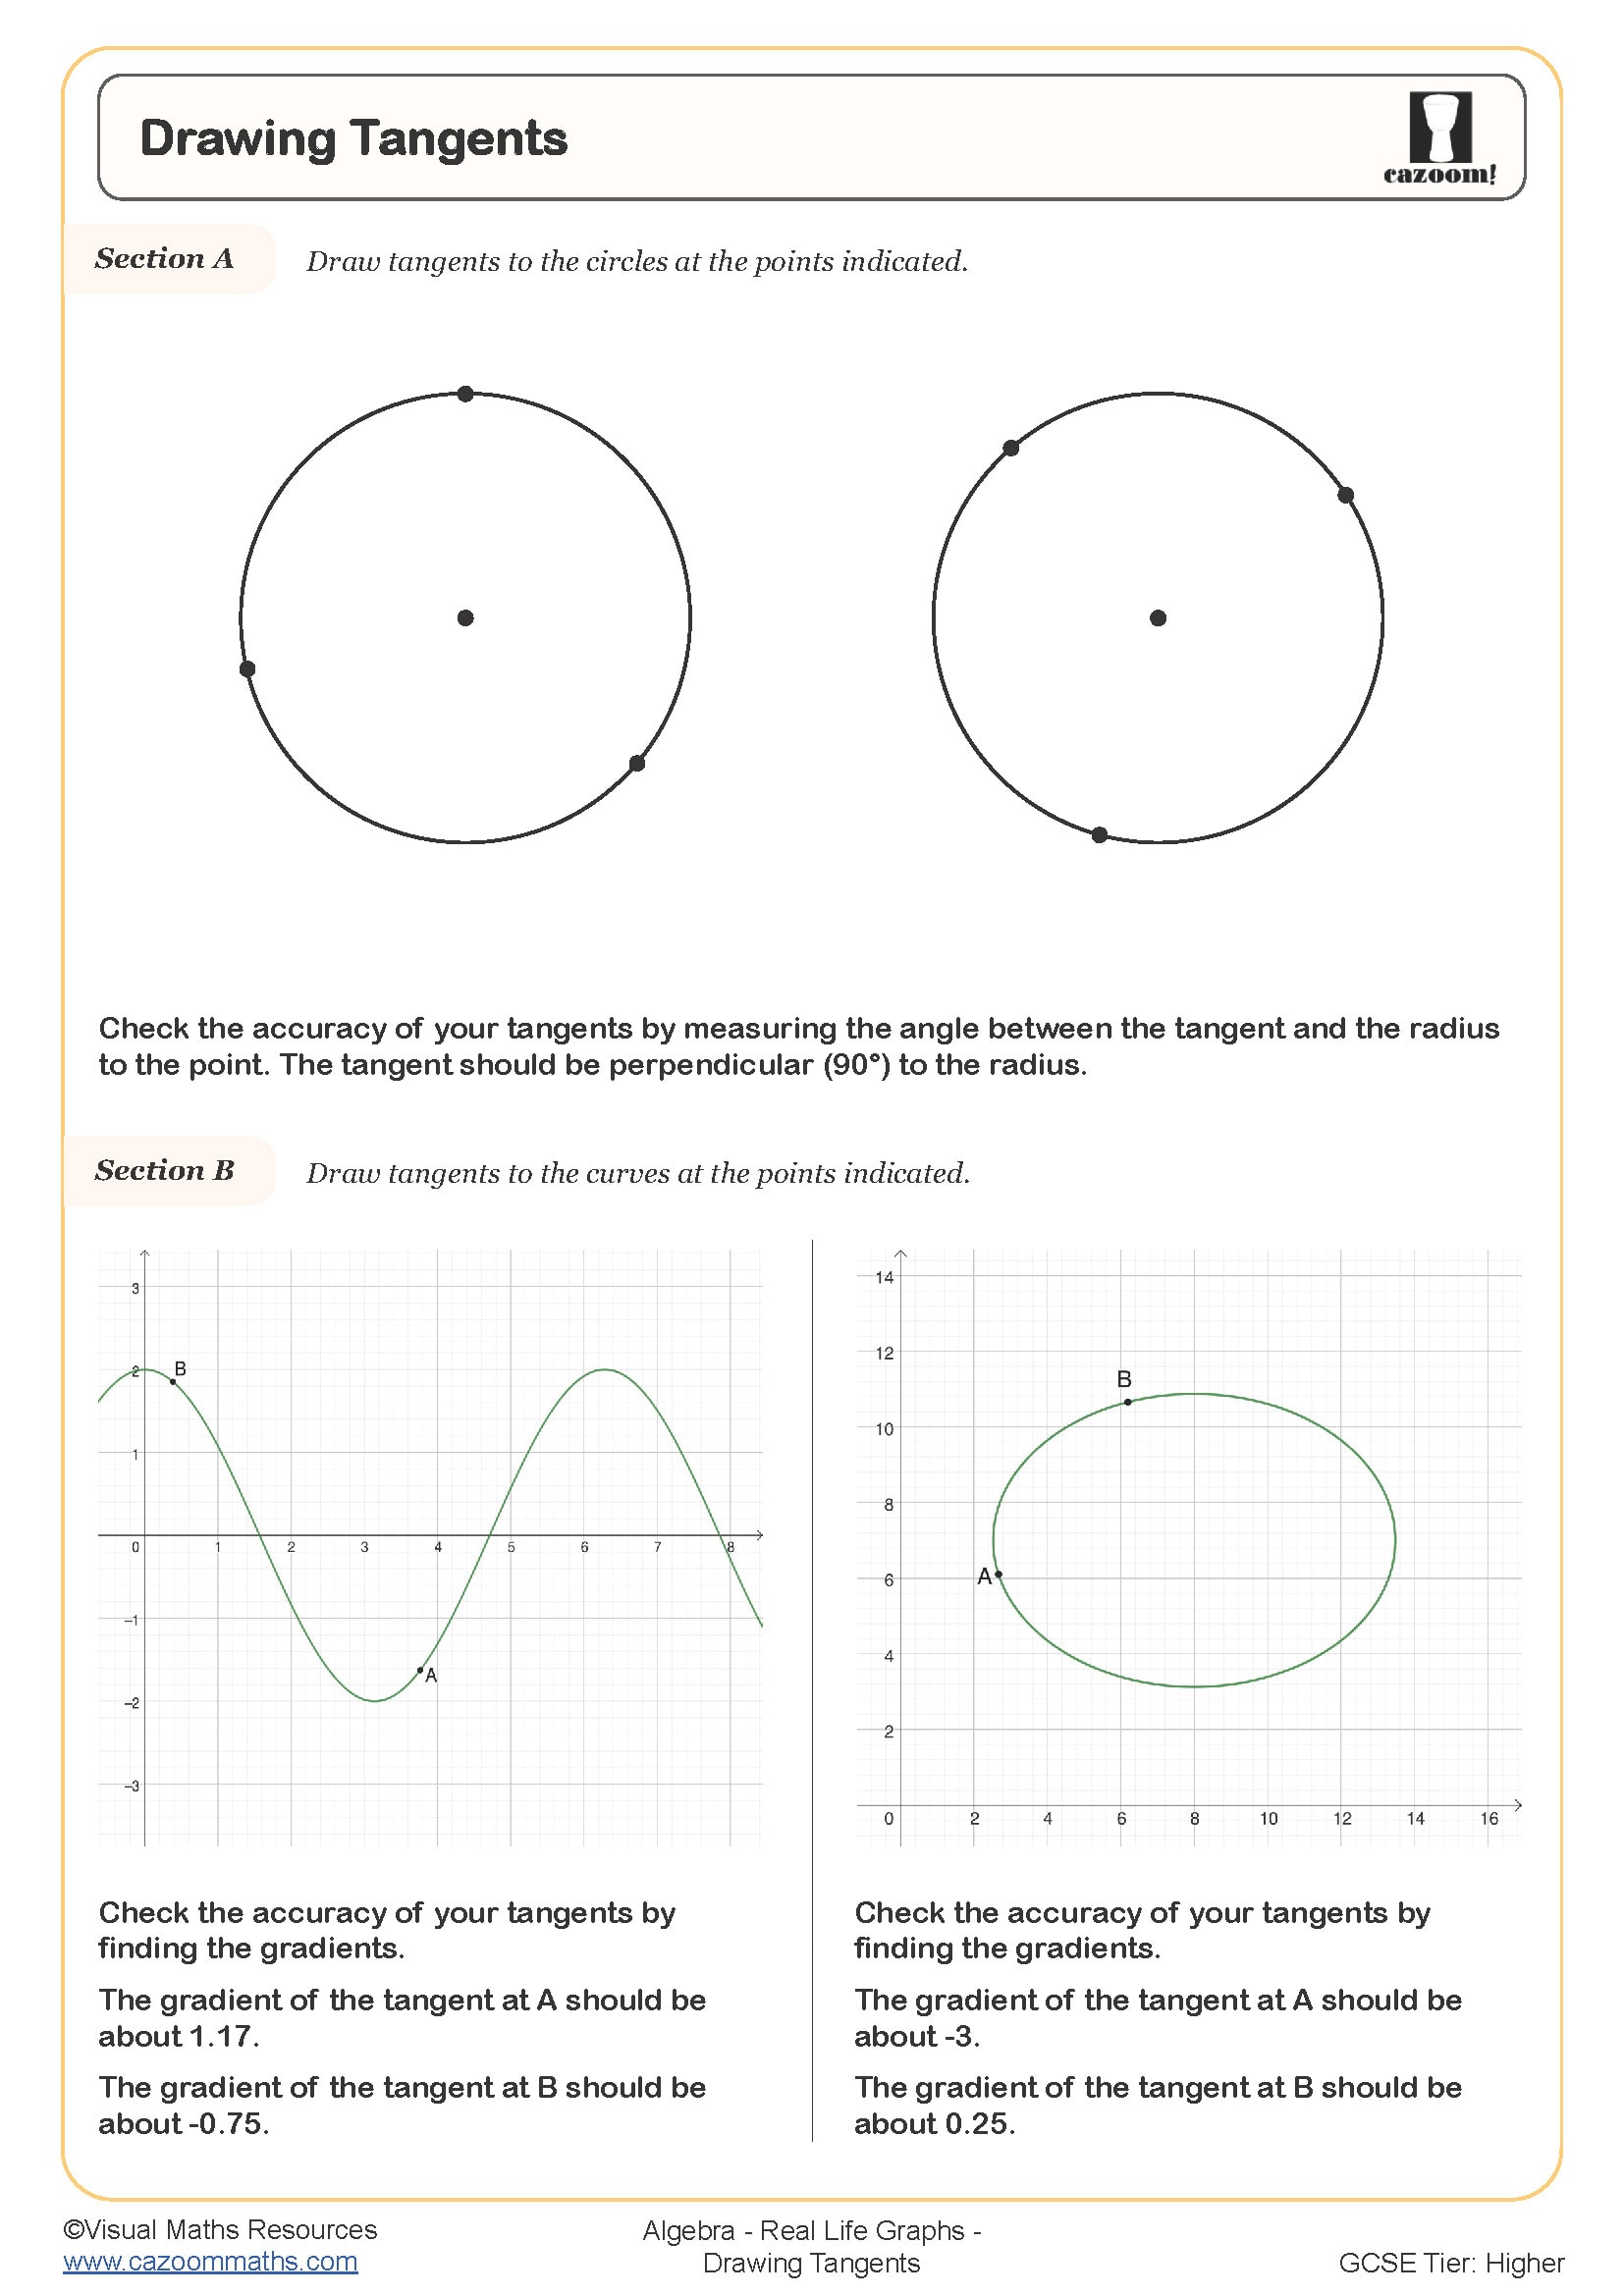
For curved graphs, the process differs. Average rate between two points uses the same gradient formula, but instantaneous rate at a point requires drawing a tangent line and finding its gradient. Students must select points carefully on the tangent, ensuring accuracy. Our worksheets provide graph paper exercises where students practise both methods, developing skills in reading scales precisely and interpreting their calculated rates within problem contexts.
Do the Worksheets Include Worked Solutions?
Every rates of change worksheet comes with complete answer sheets showing all working and final answers. This allows students to check their understanding independently and identify precisely where errors occur in their calculations. Teachers can use these for efficient marking or set worksheets as self-marking homework tasks.
The answer sheets display methods clearly, helping students understand the steps required. For graph-based questions, solutions indicate where measurements should be taken and how to apply gradient formulae correctly. This supporting material makes the worksheets effective for both classroom teaching and revision, as students receive immediate feedback on their approach to different question types throughout their study of rates of change.