Real Life Graphs Worksheets
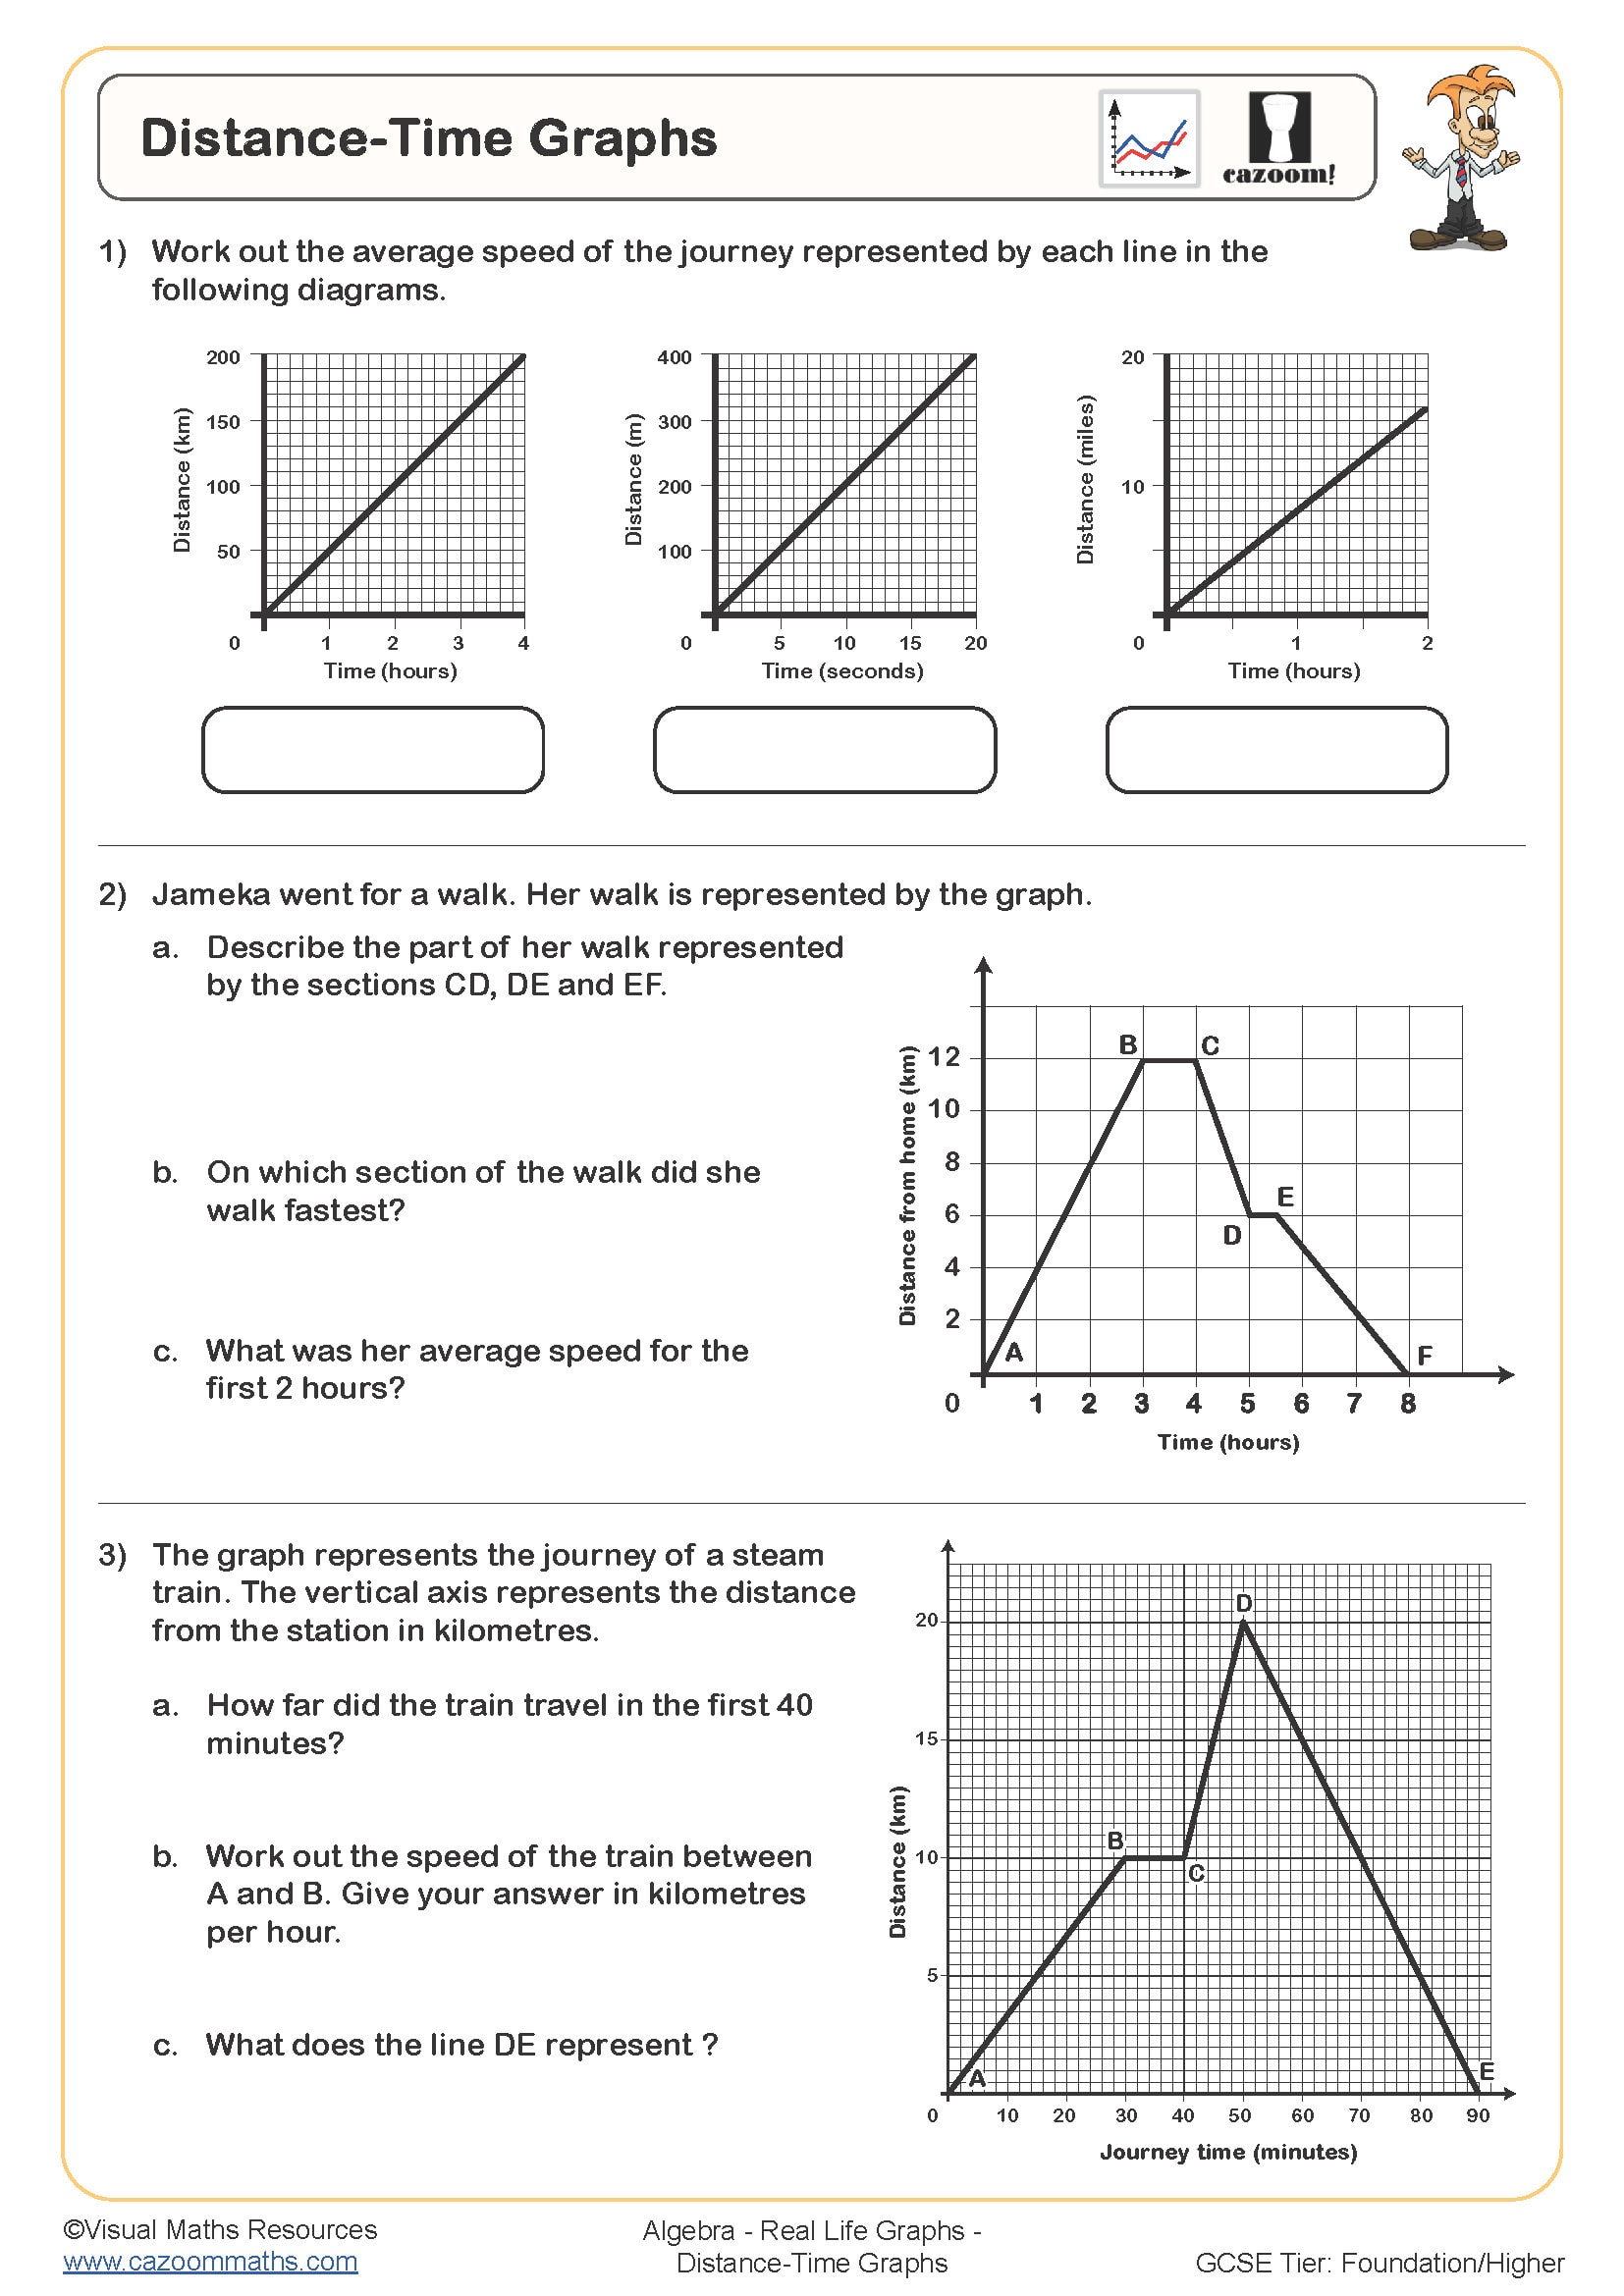
Distance Time Graphs
Year groups: 8, 9
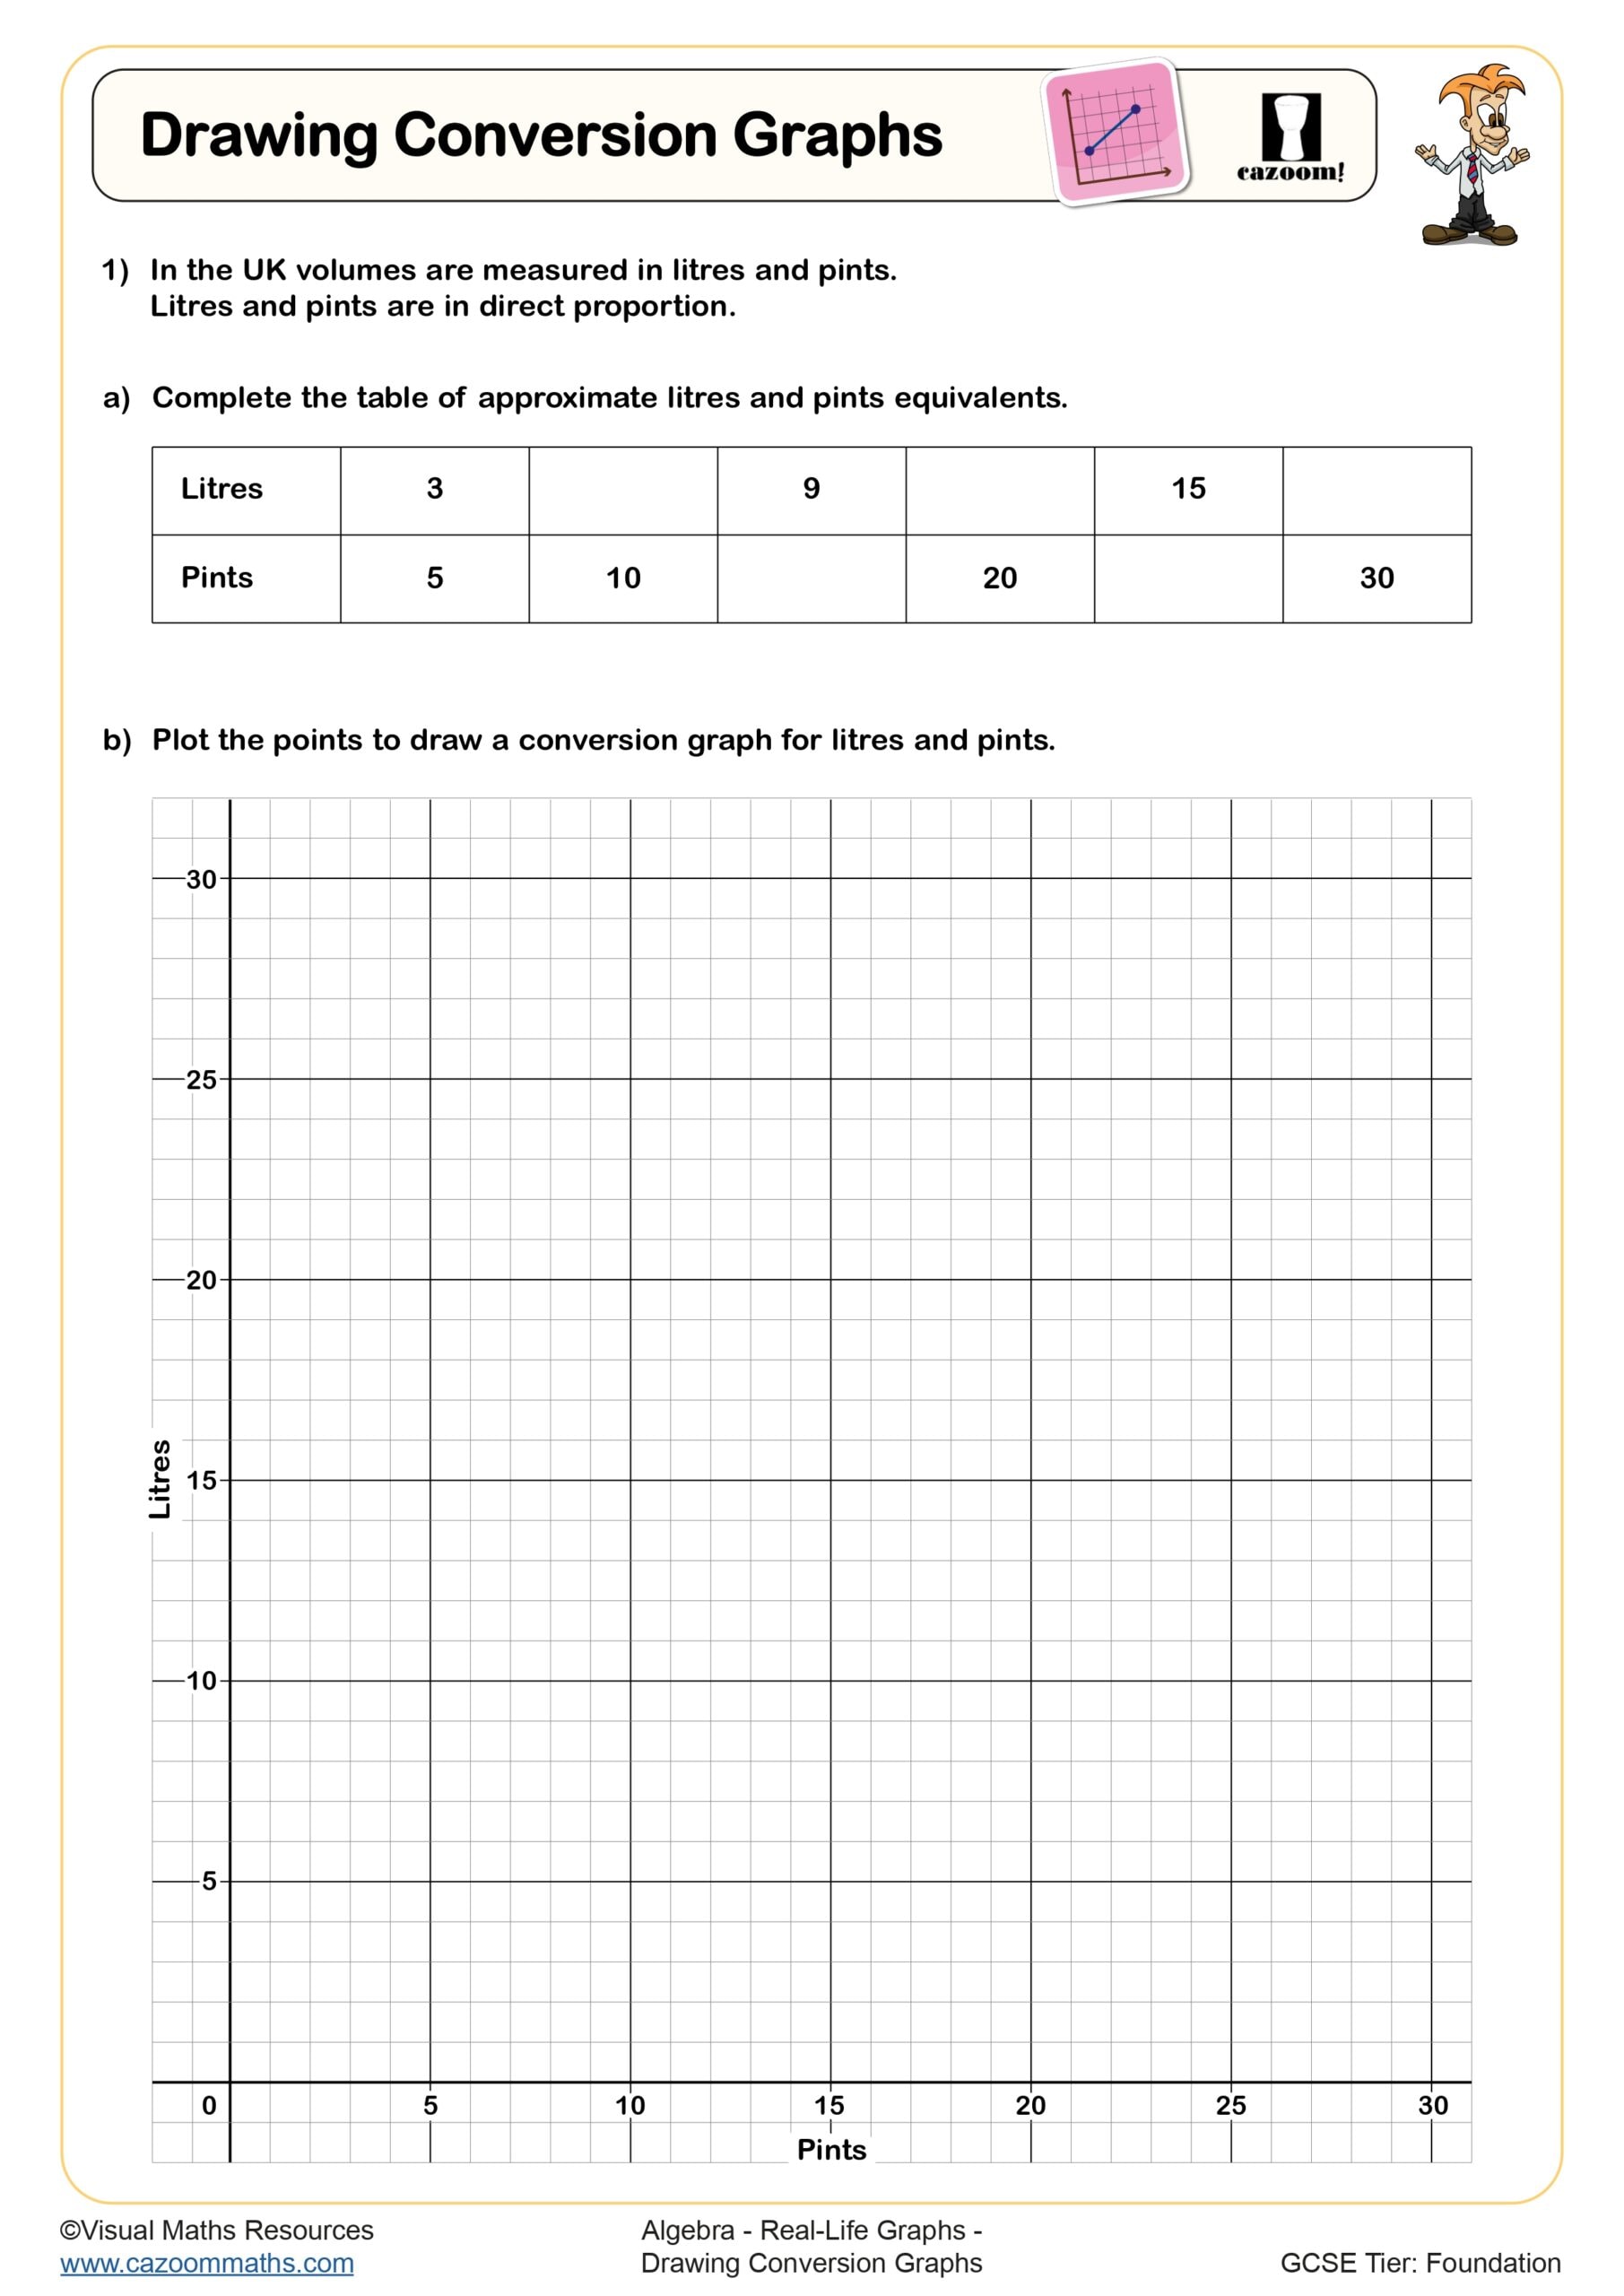
Drawing Conversion Graphs
Year groups: 8, 9
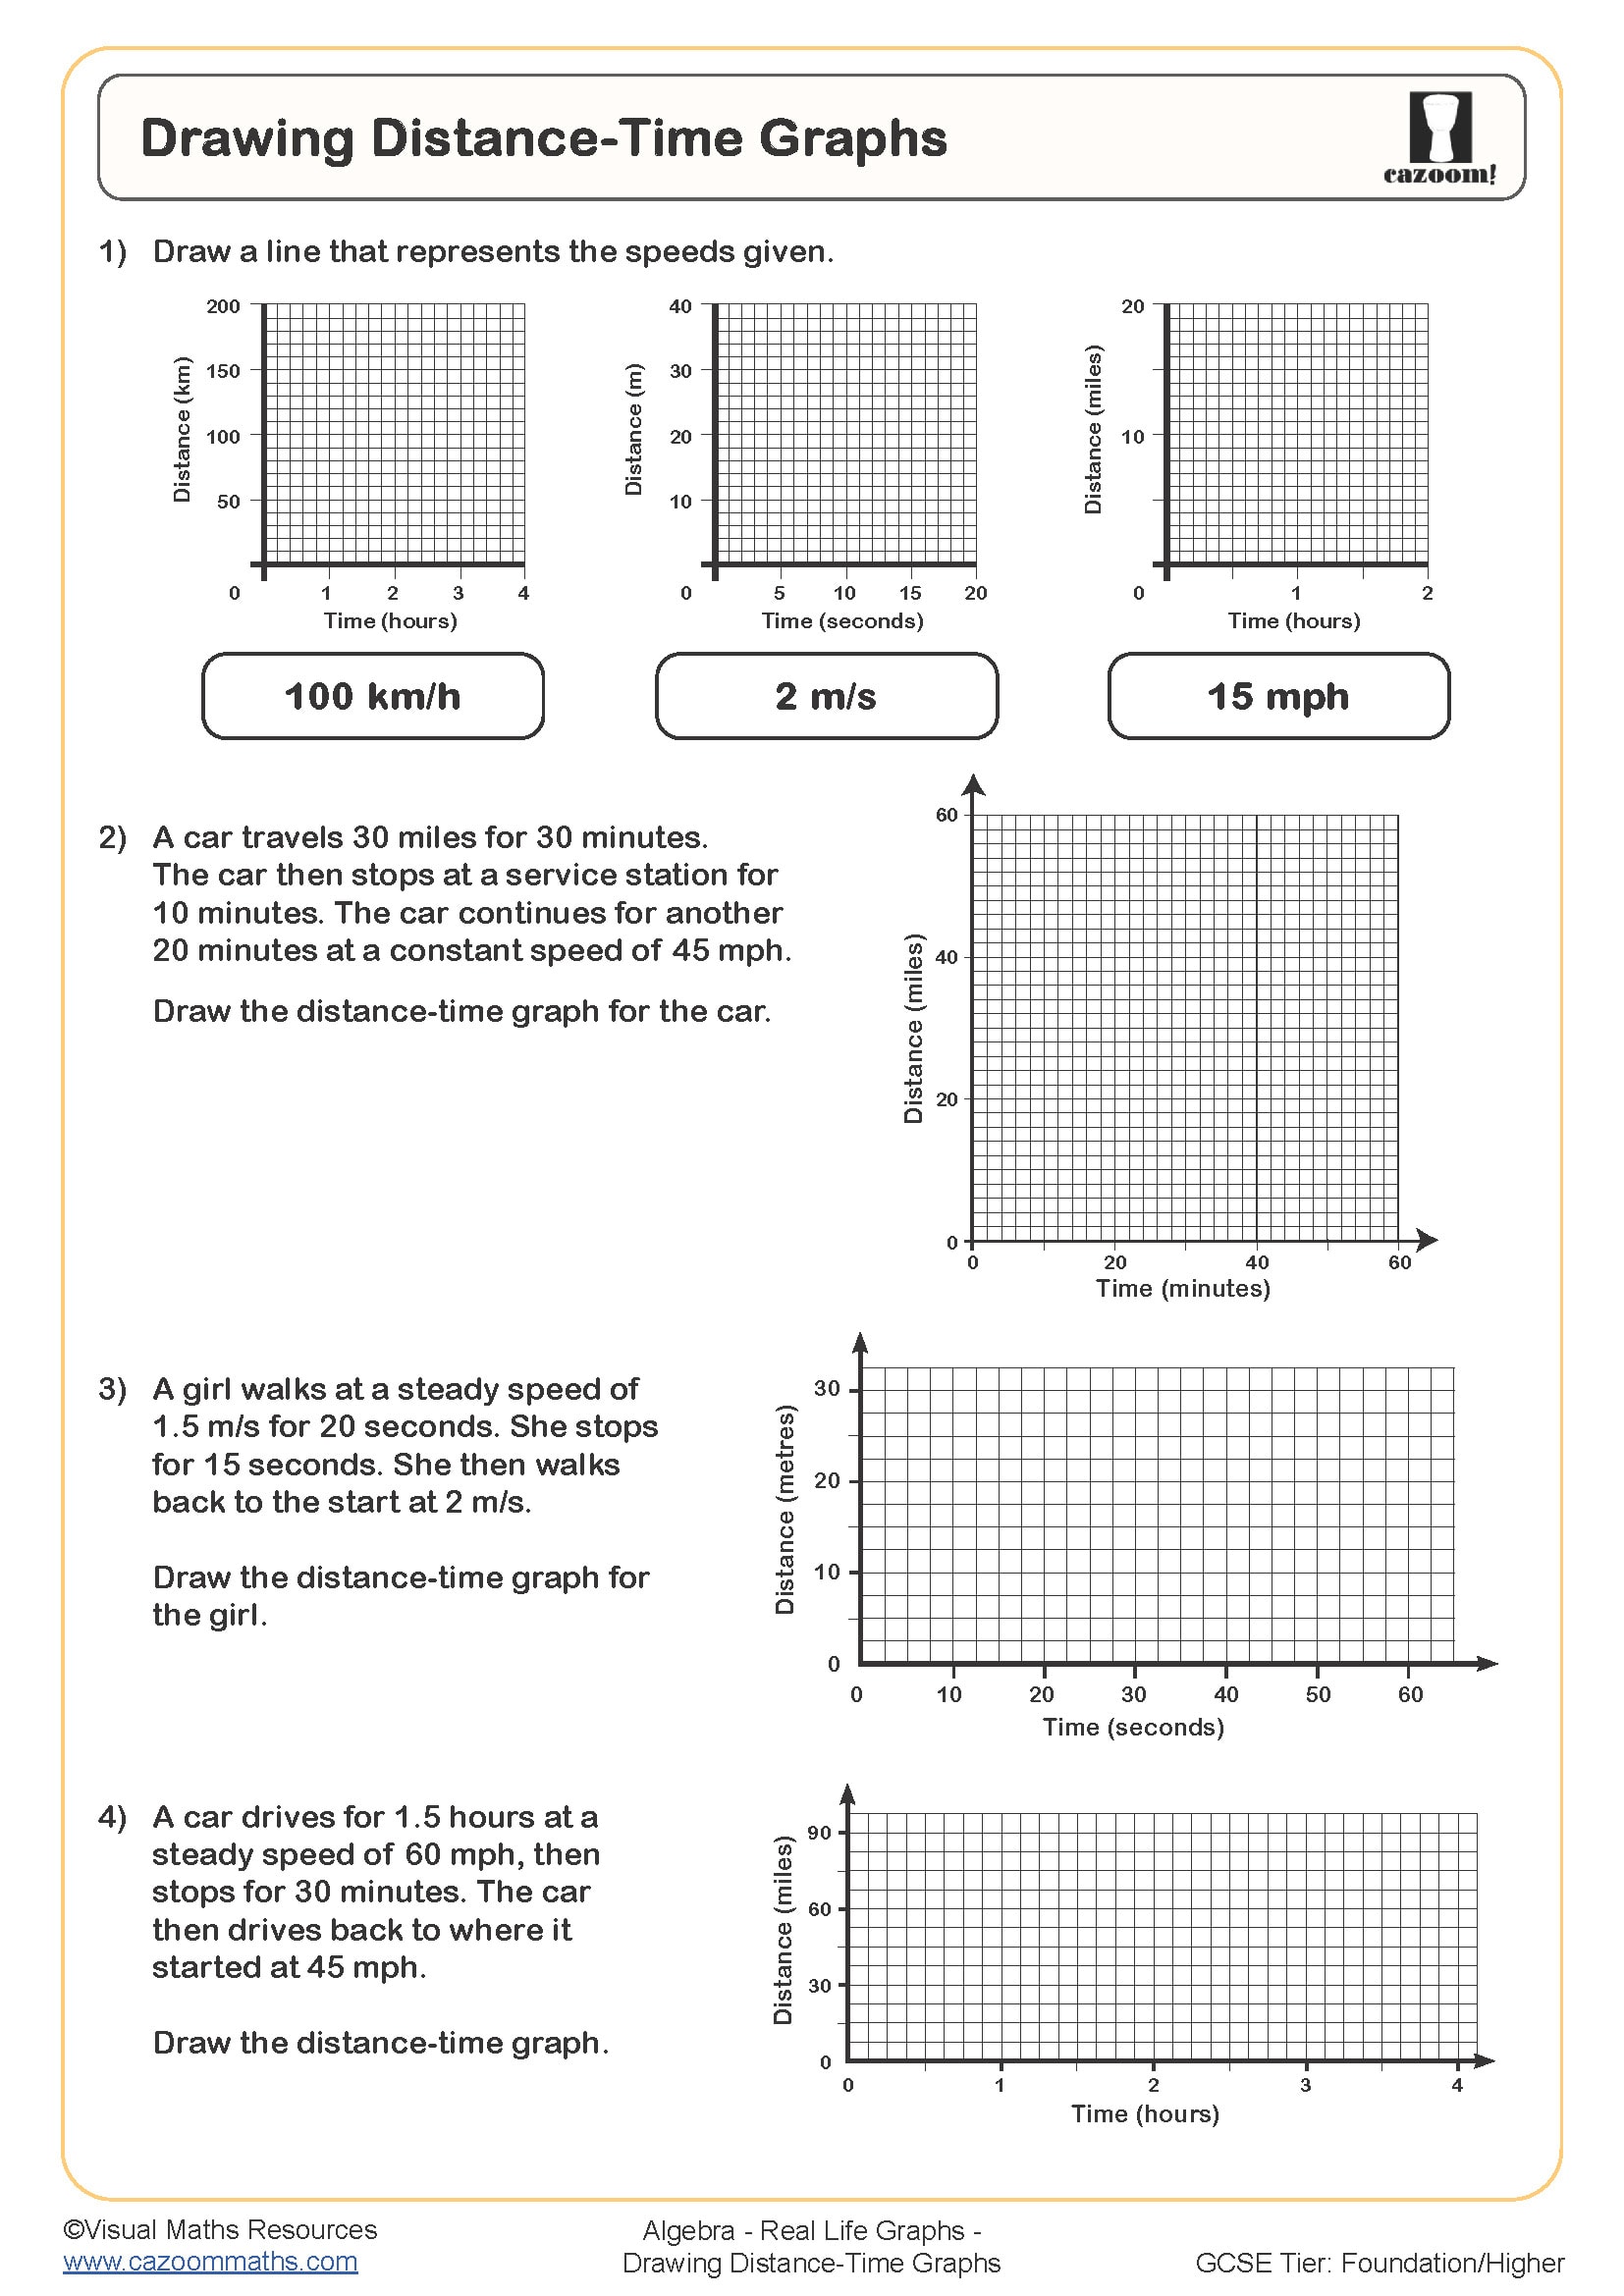
Drawing Distance Time Graphs
Year groups: 8, 9
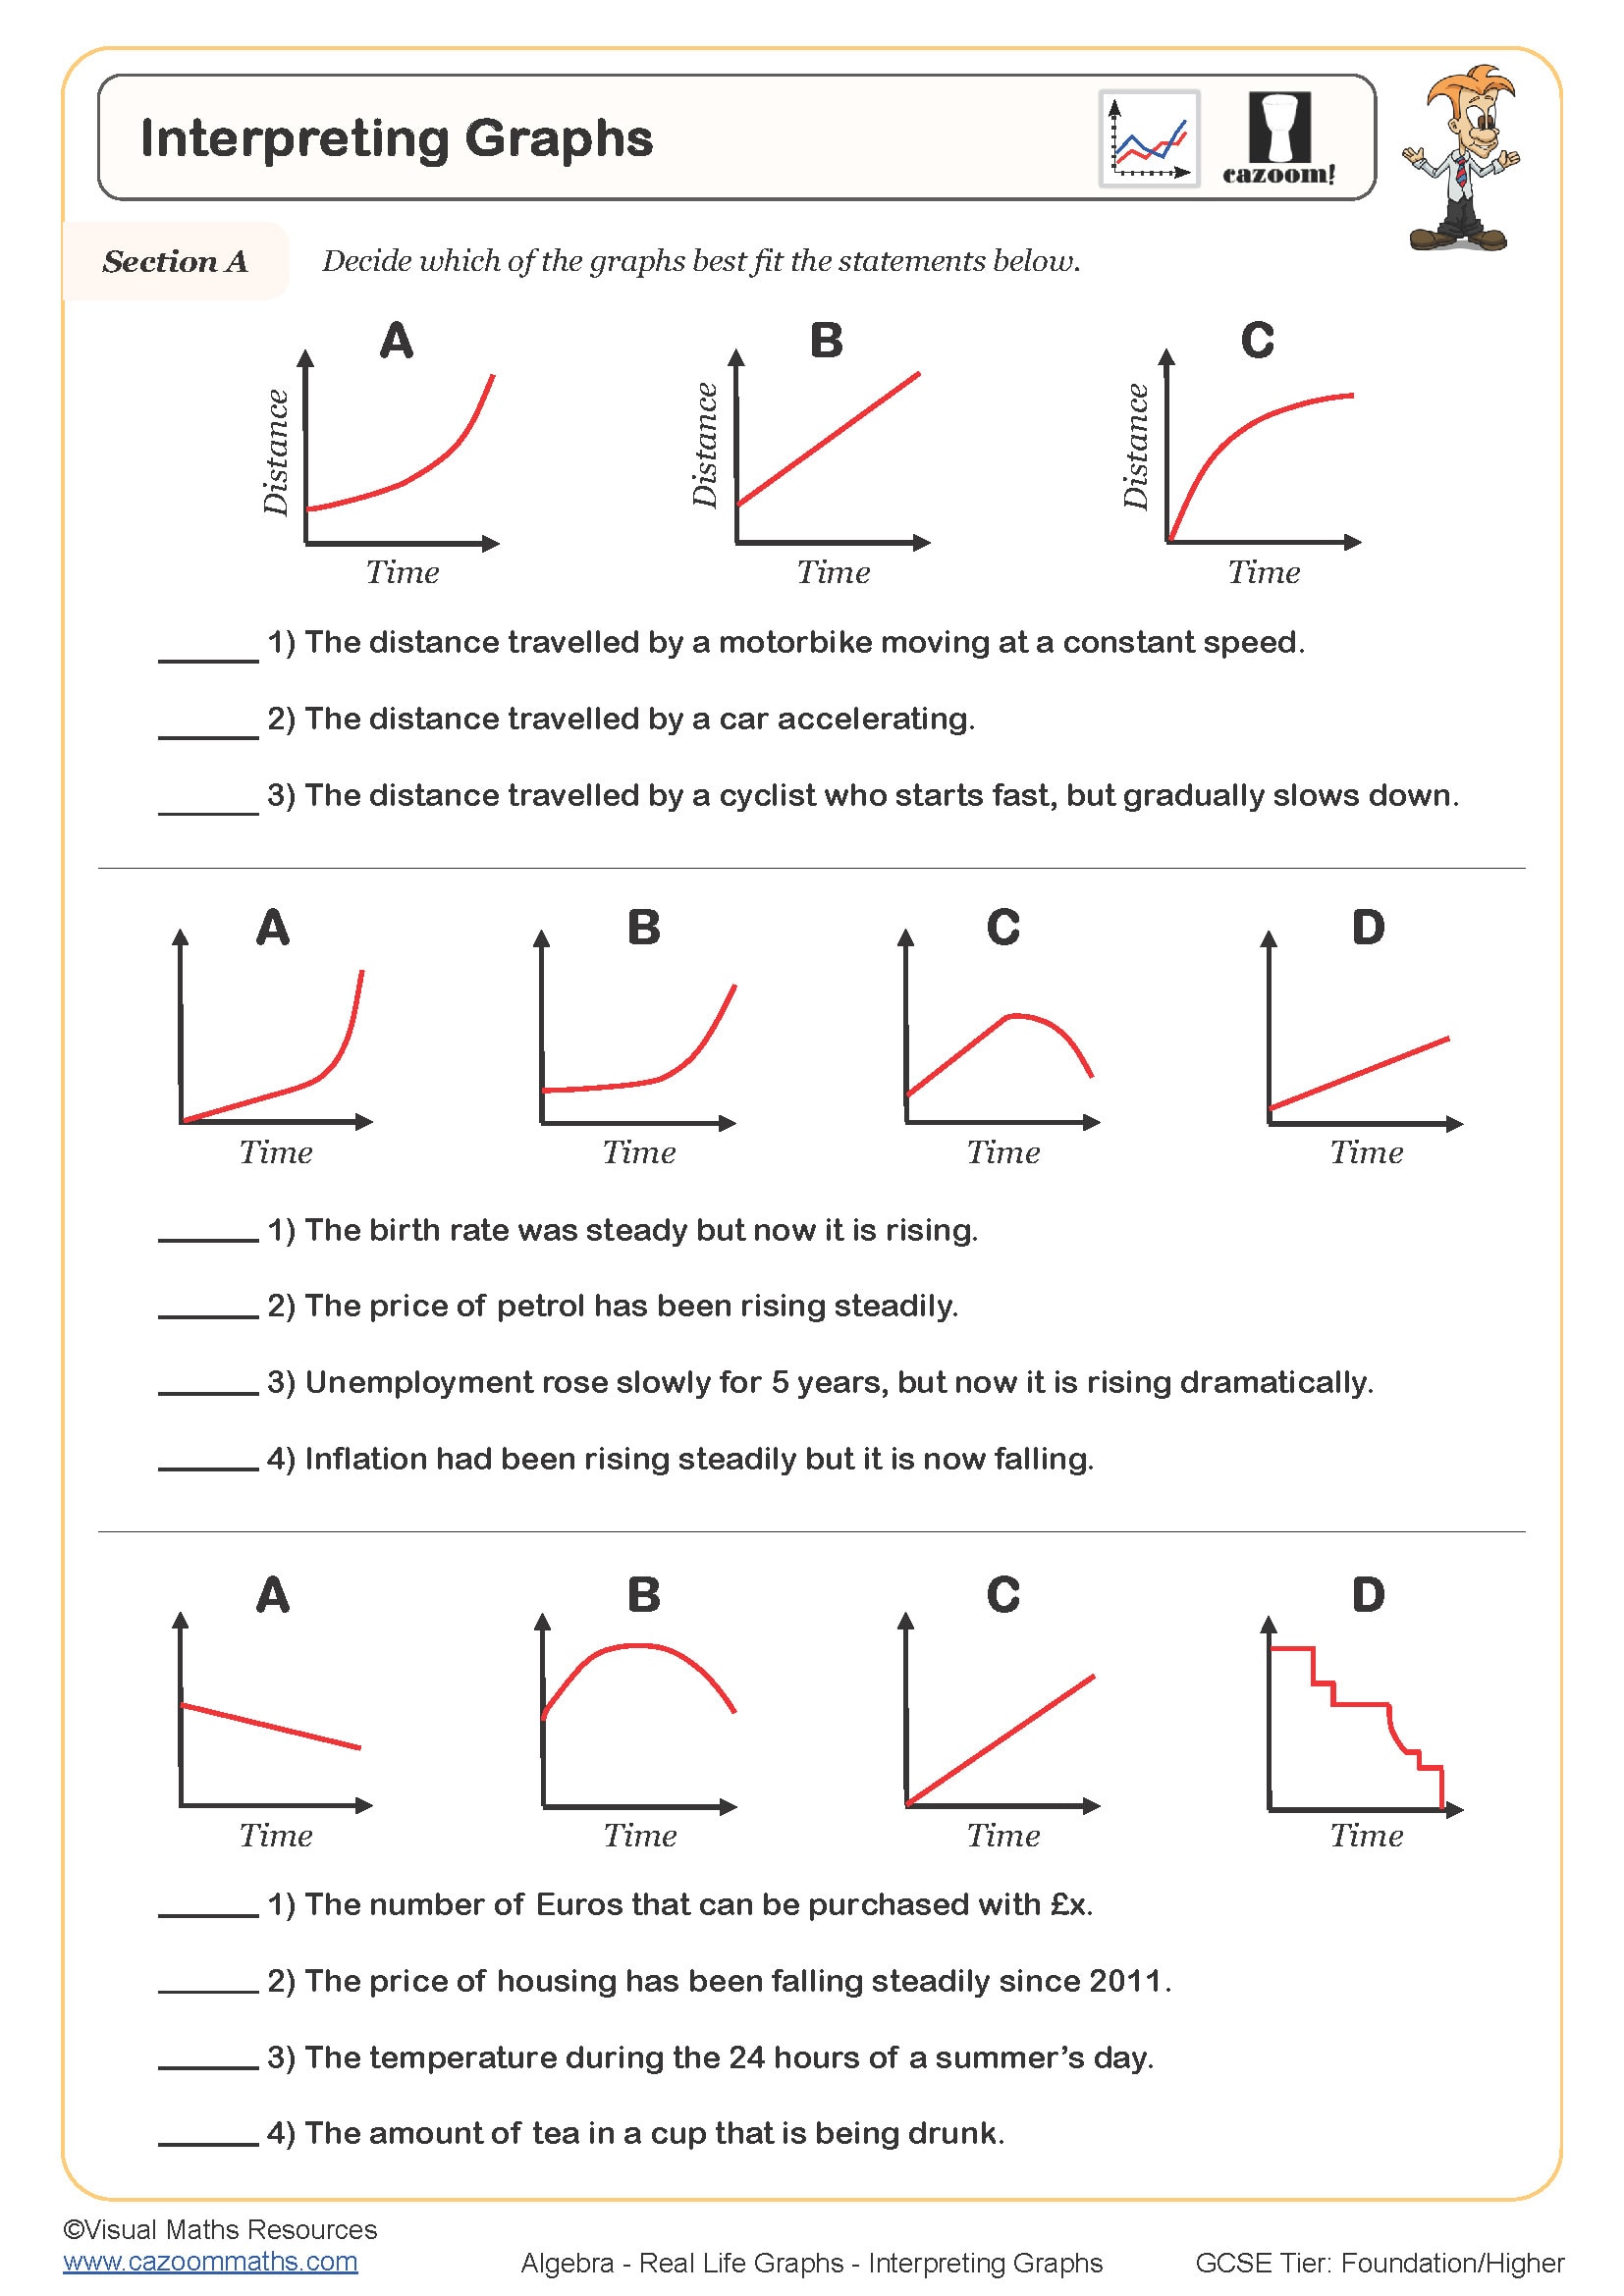
Interpreting Graphs
Year groups: 8, 9
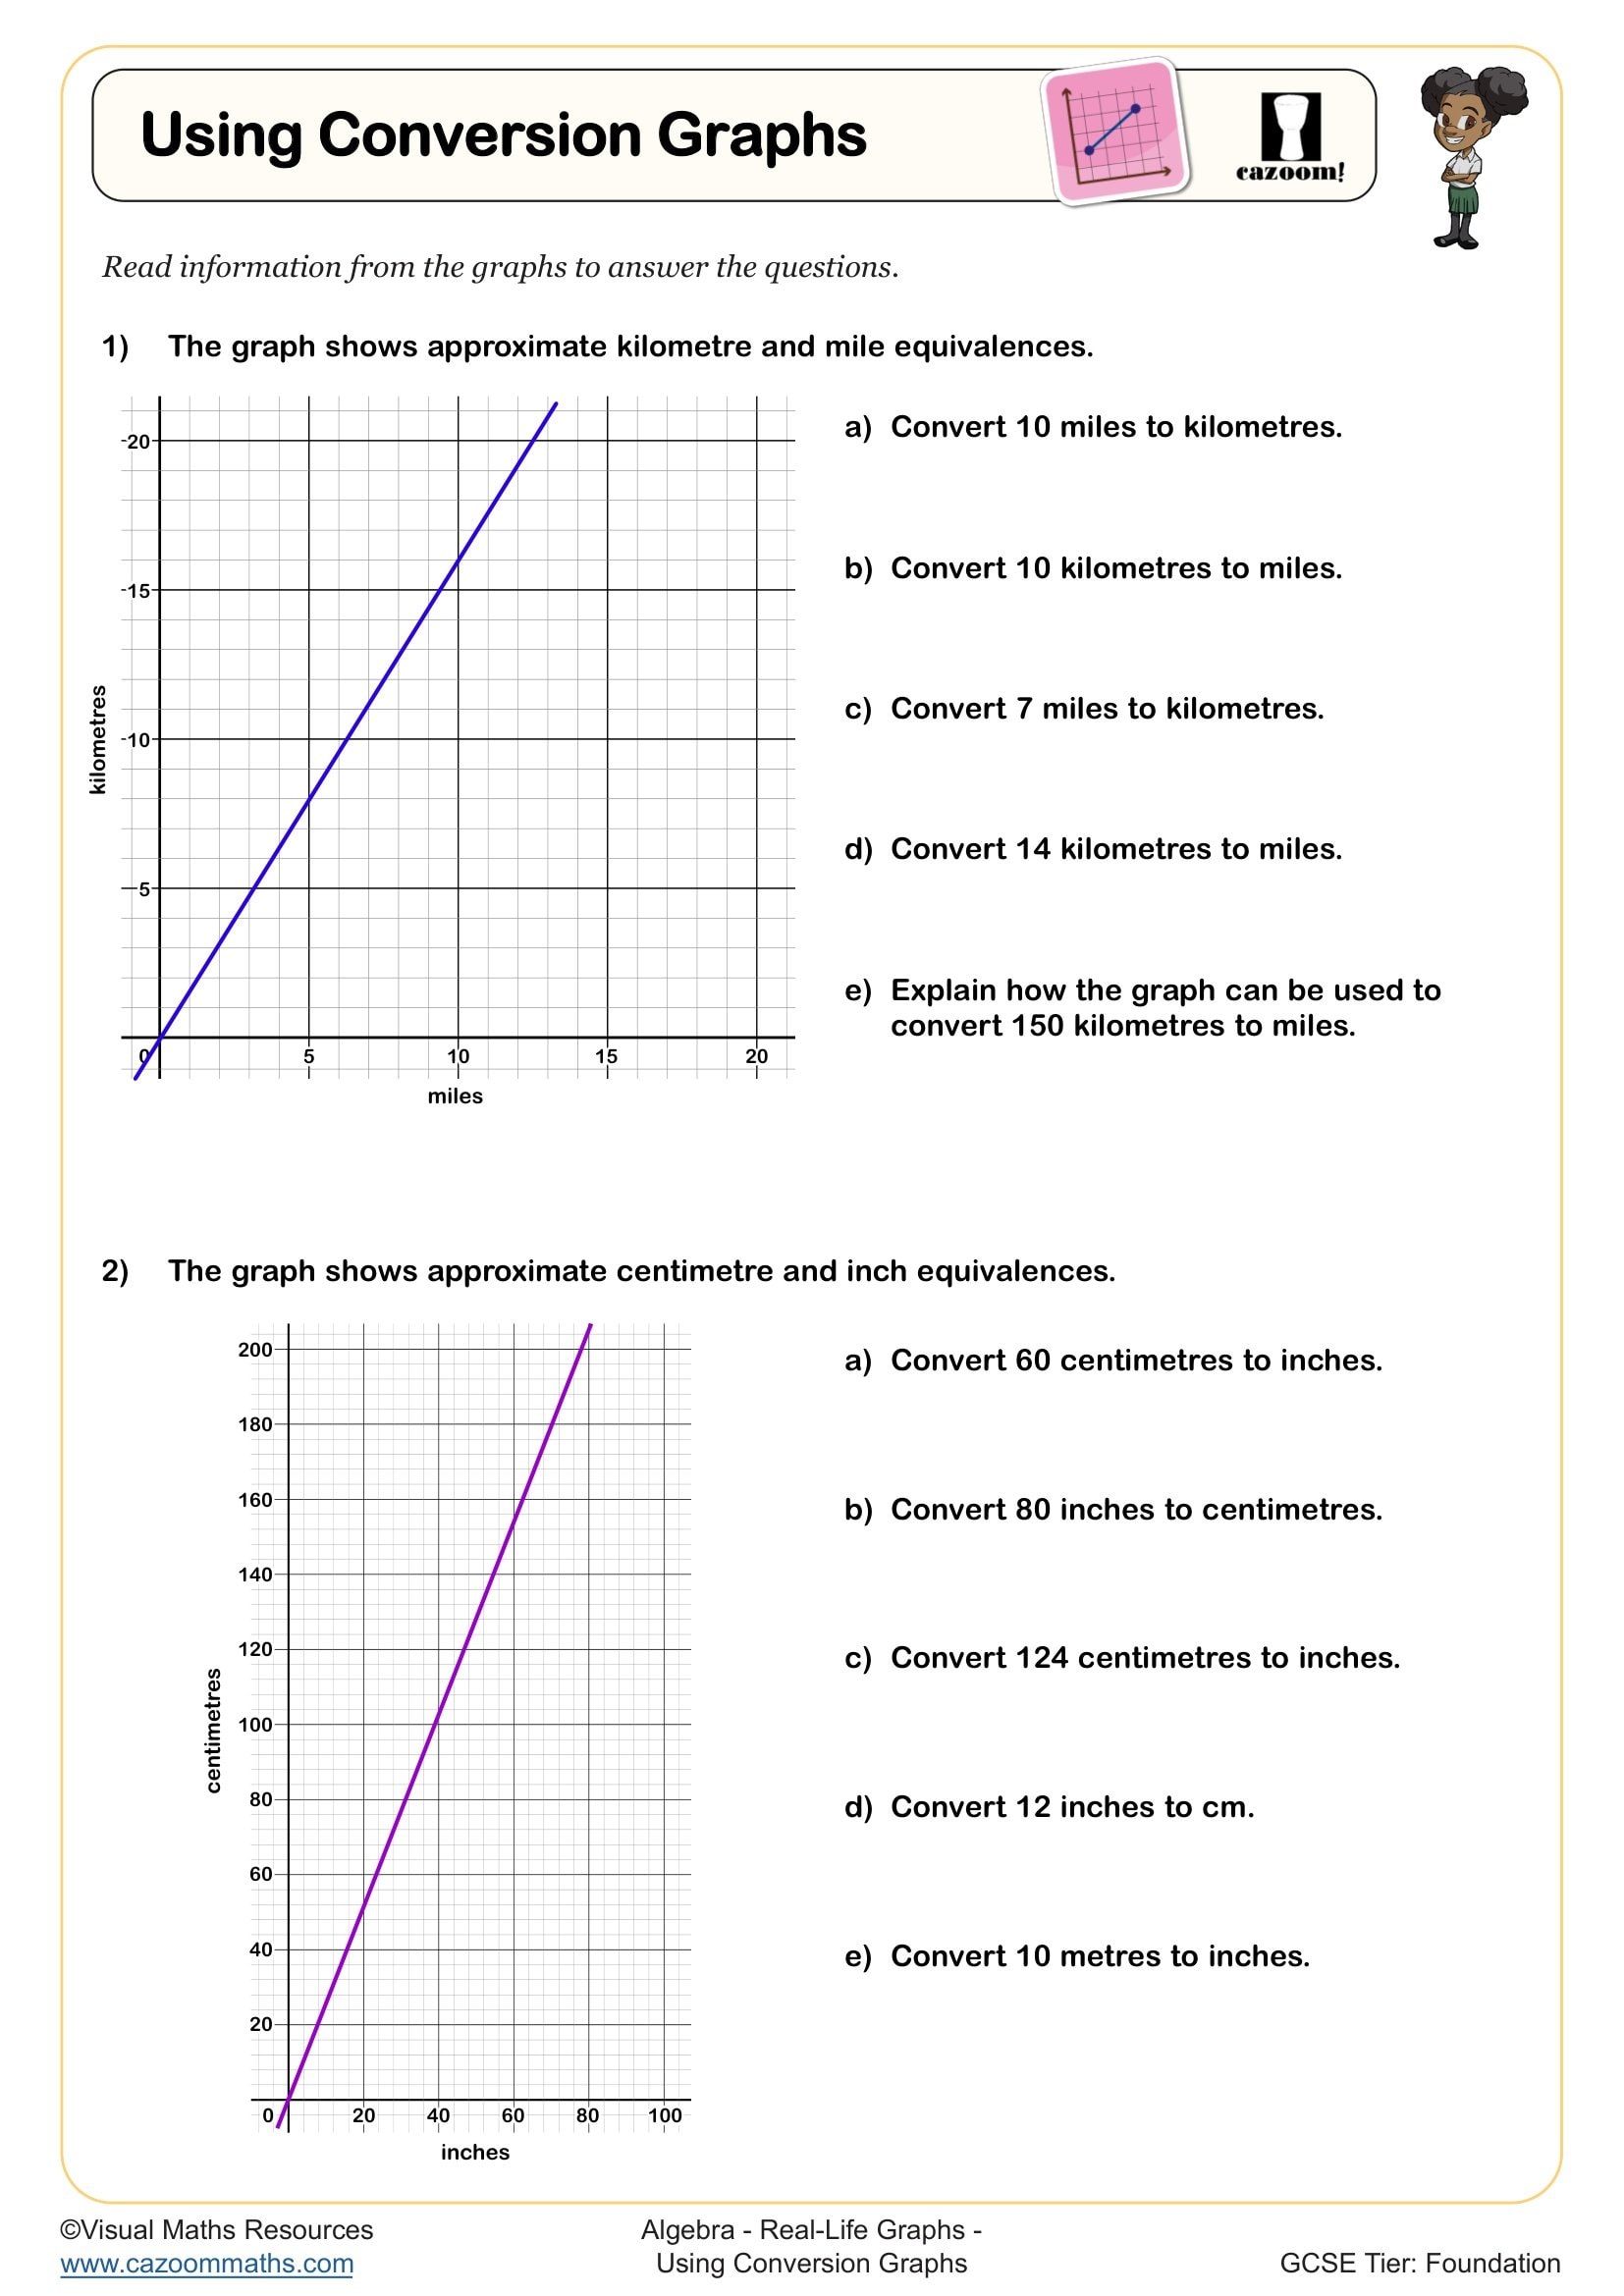
Using Conversion Graphs
Year groups: 8, 9
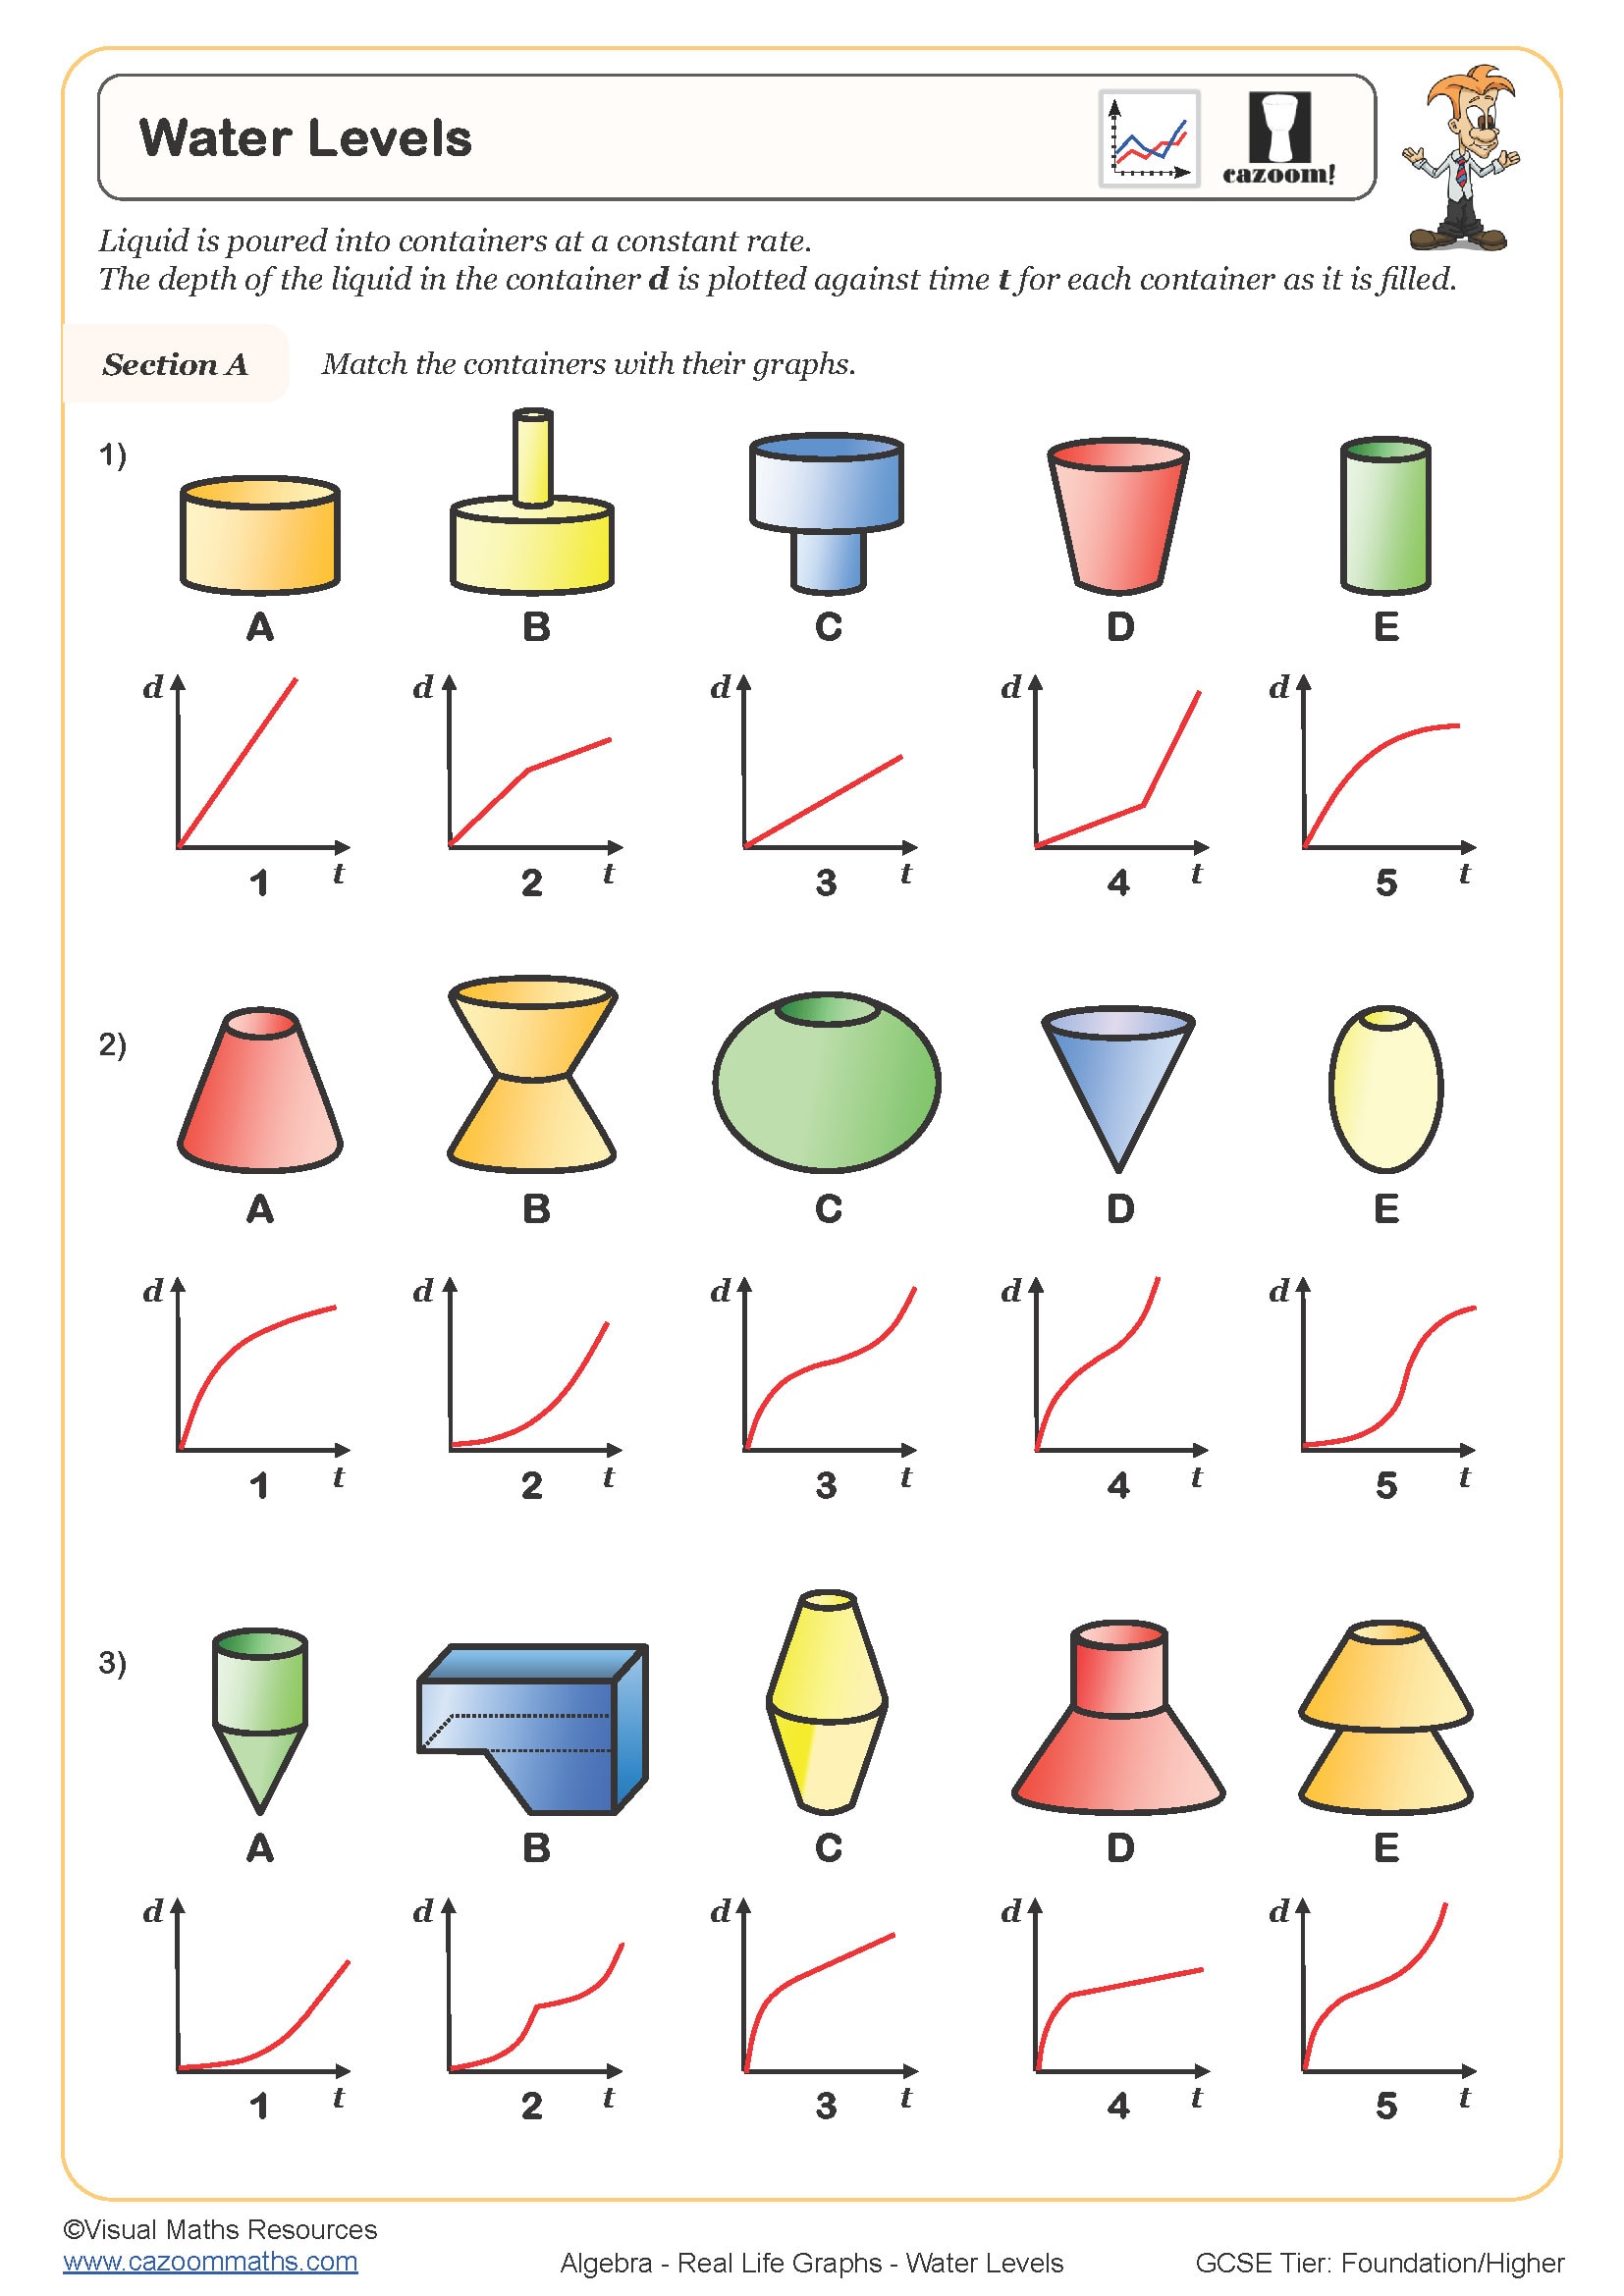
Water Levels
Year groups: 8, 9
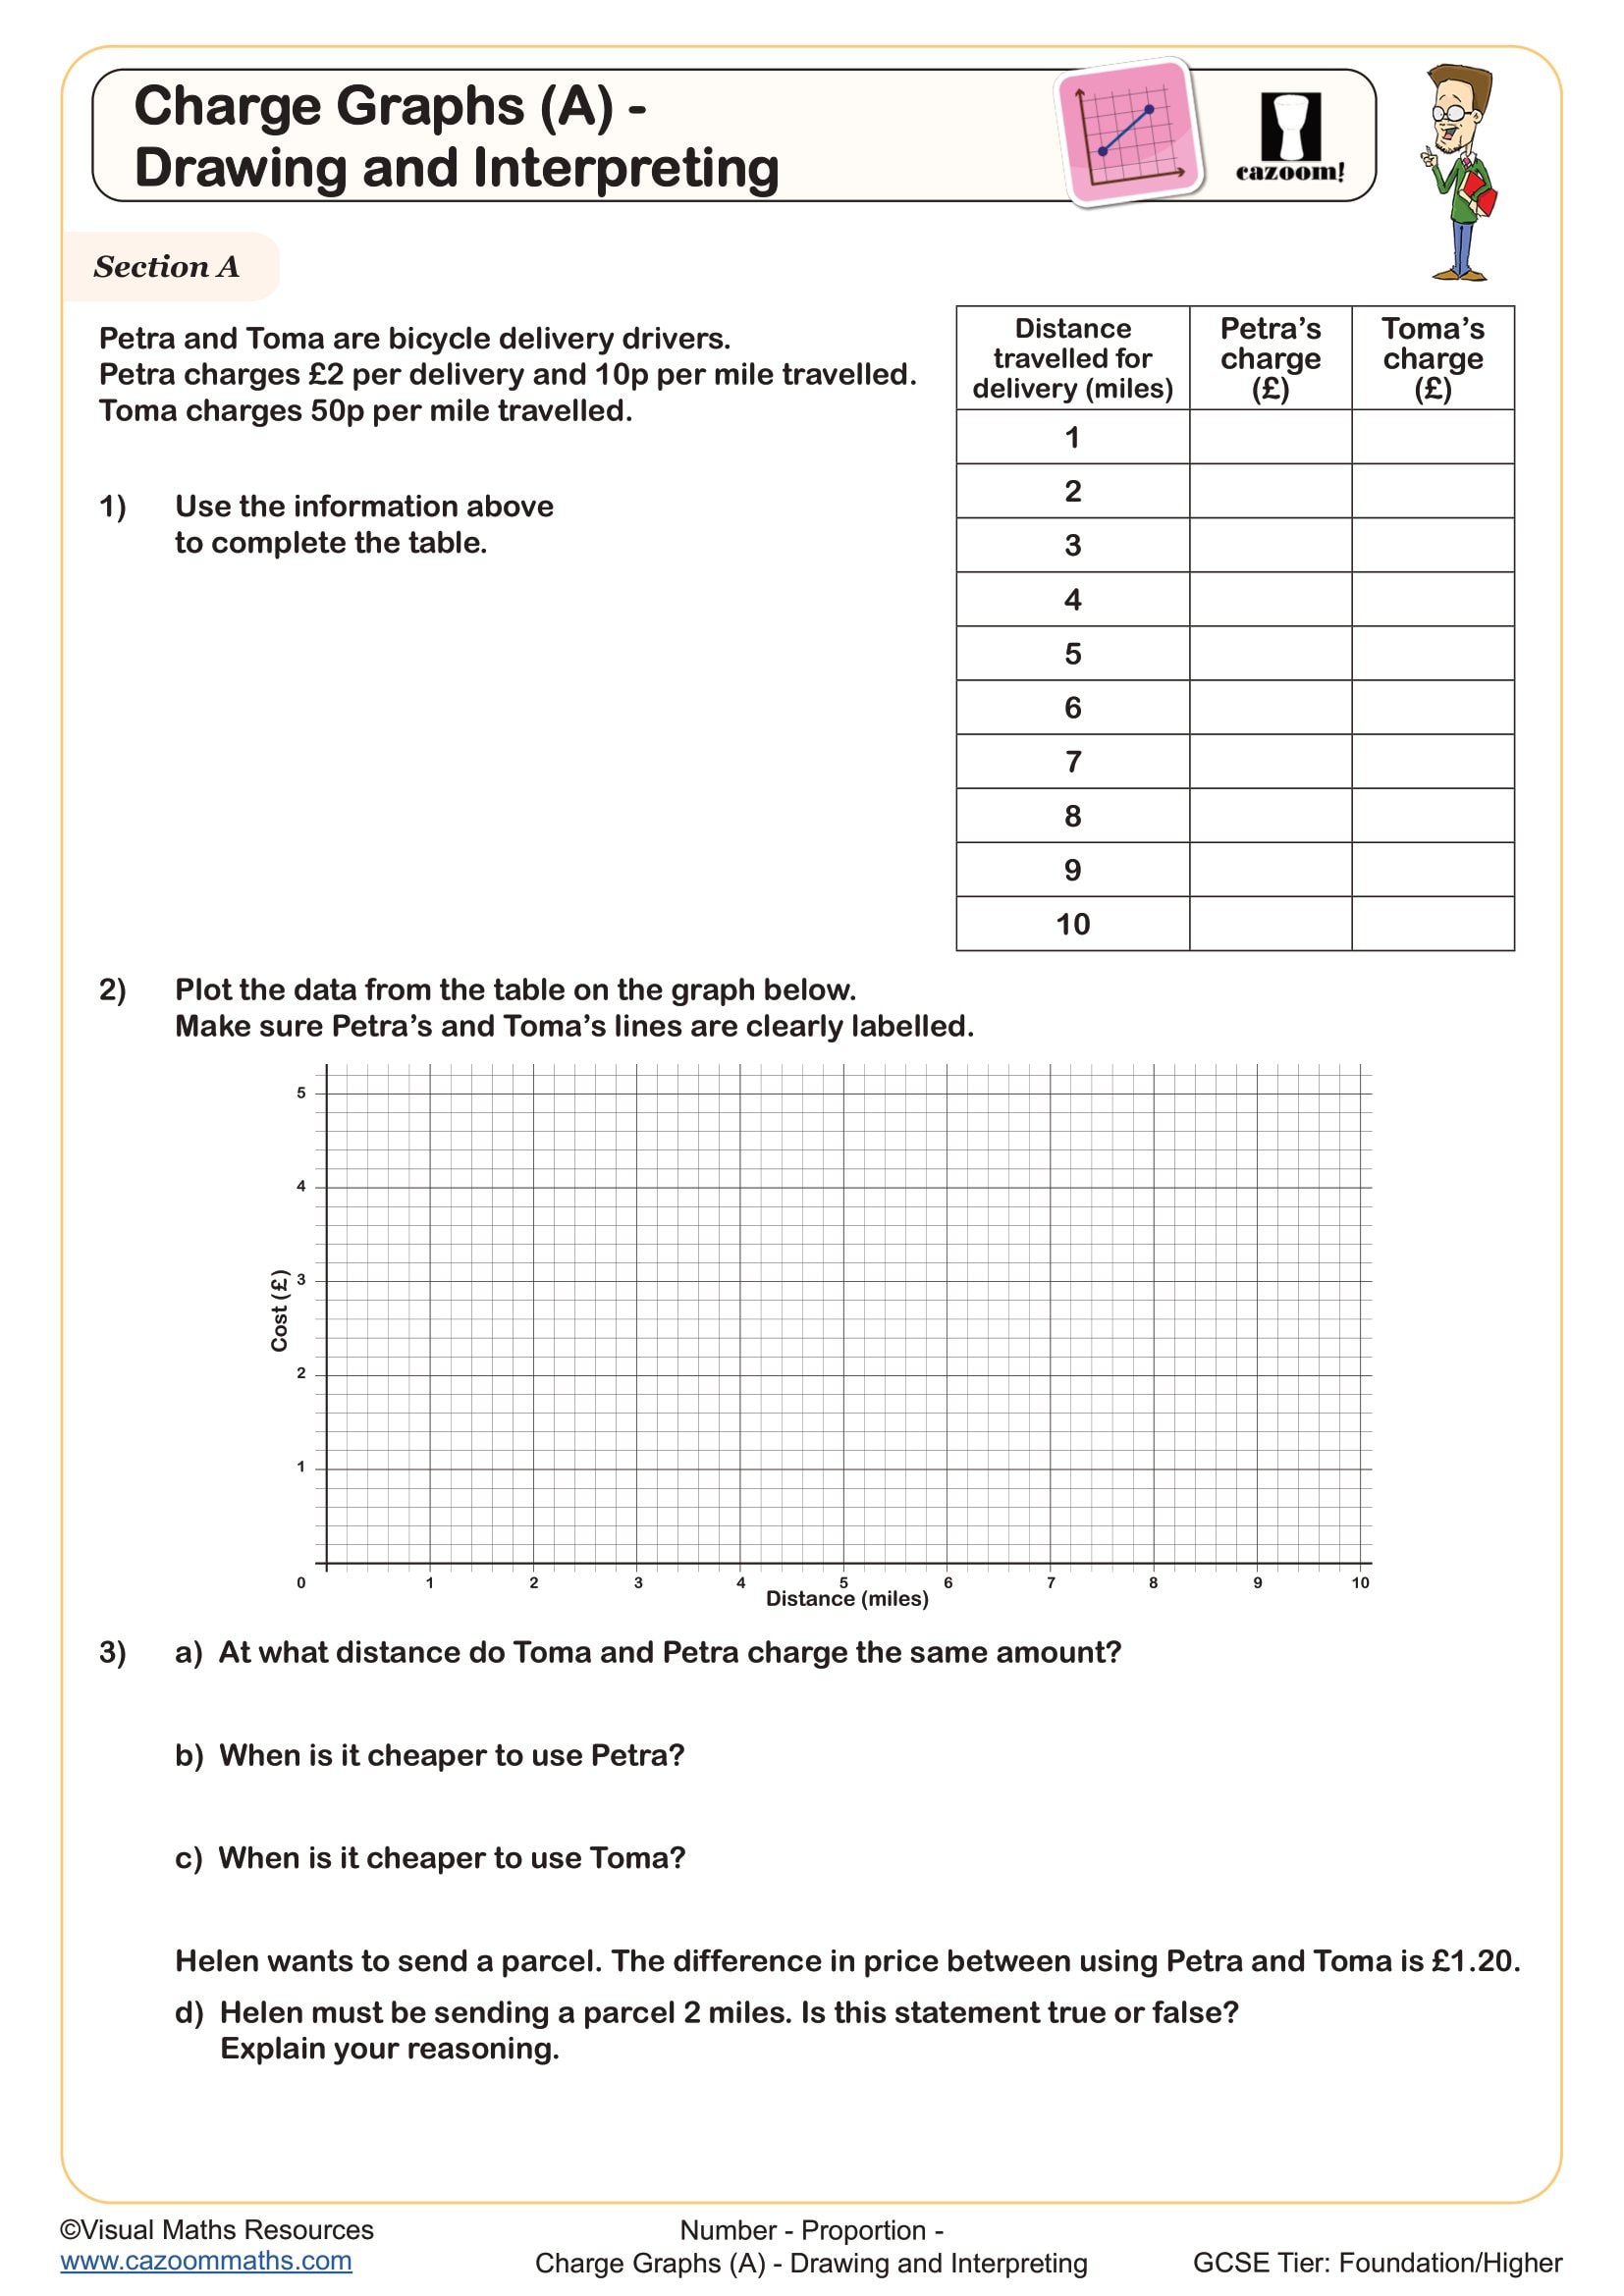
Charge Graphs (A) - Drawing and Interpreting
Year groups: 9, 10
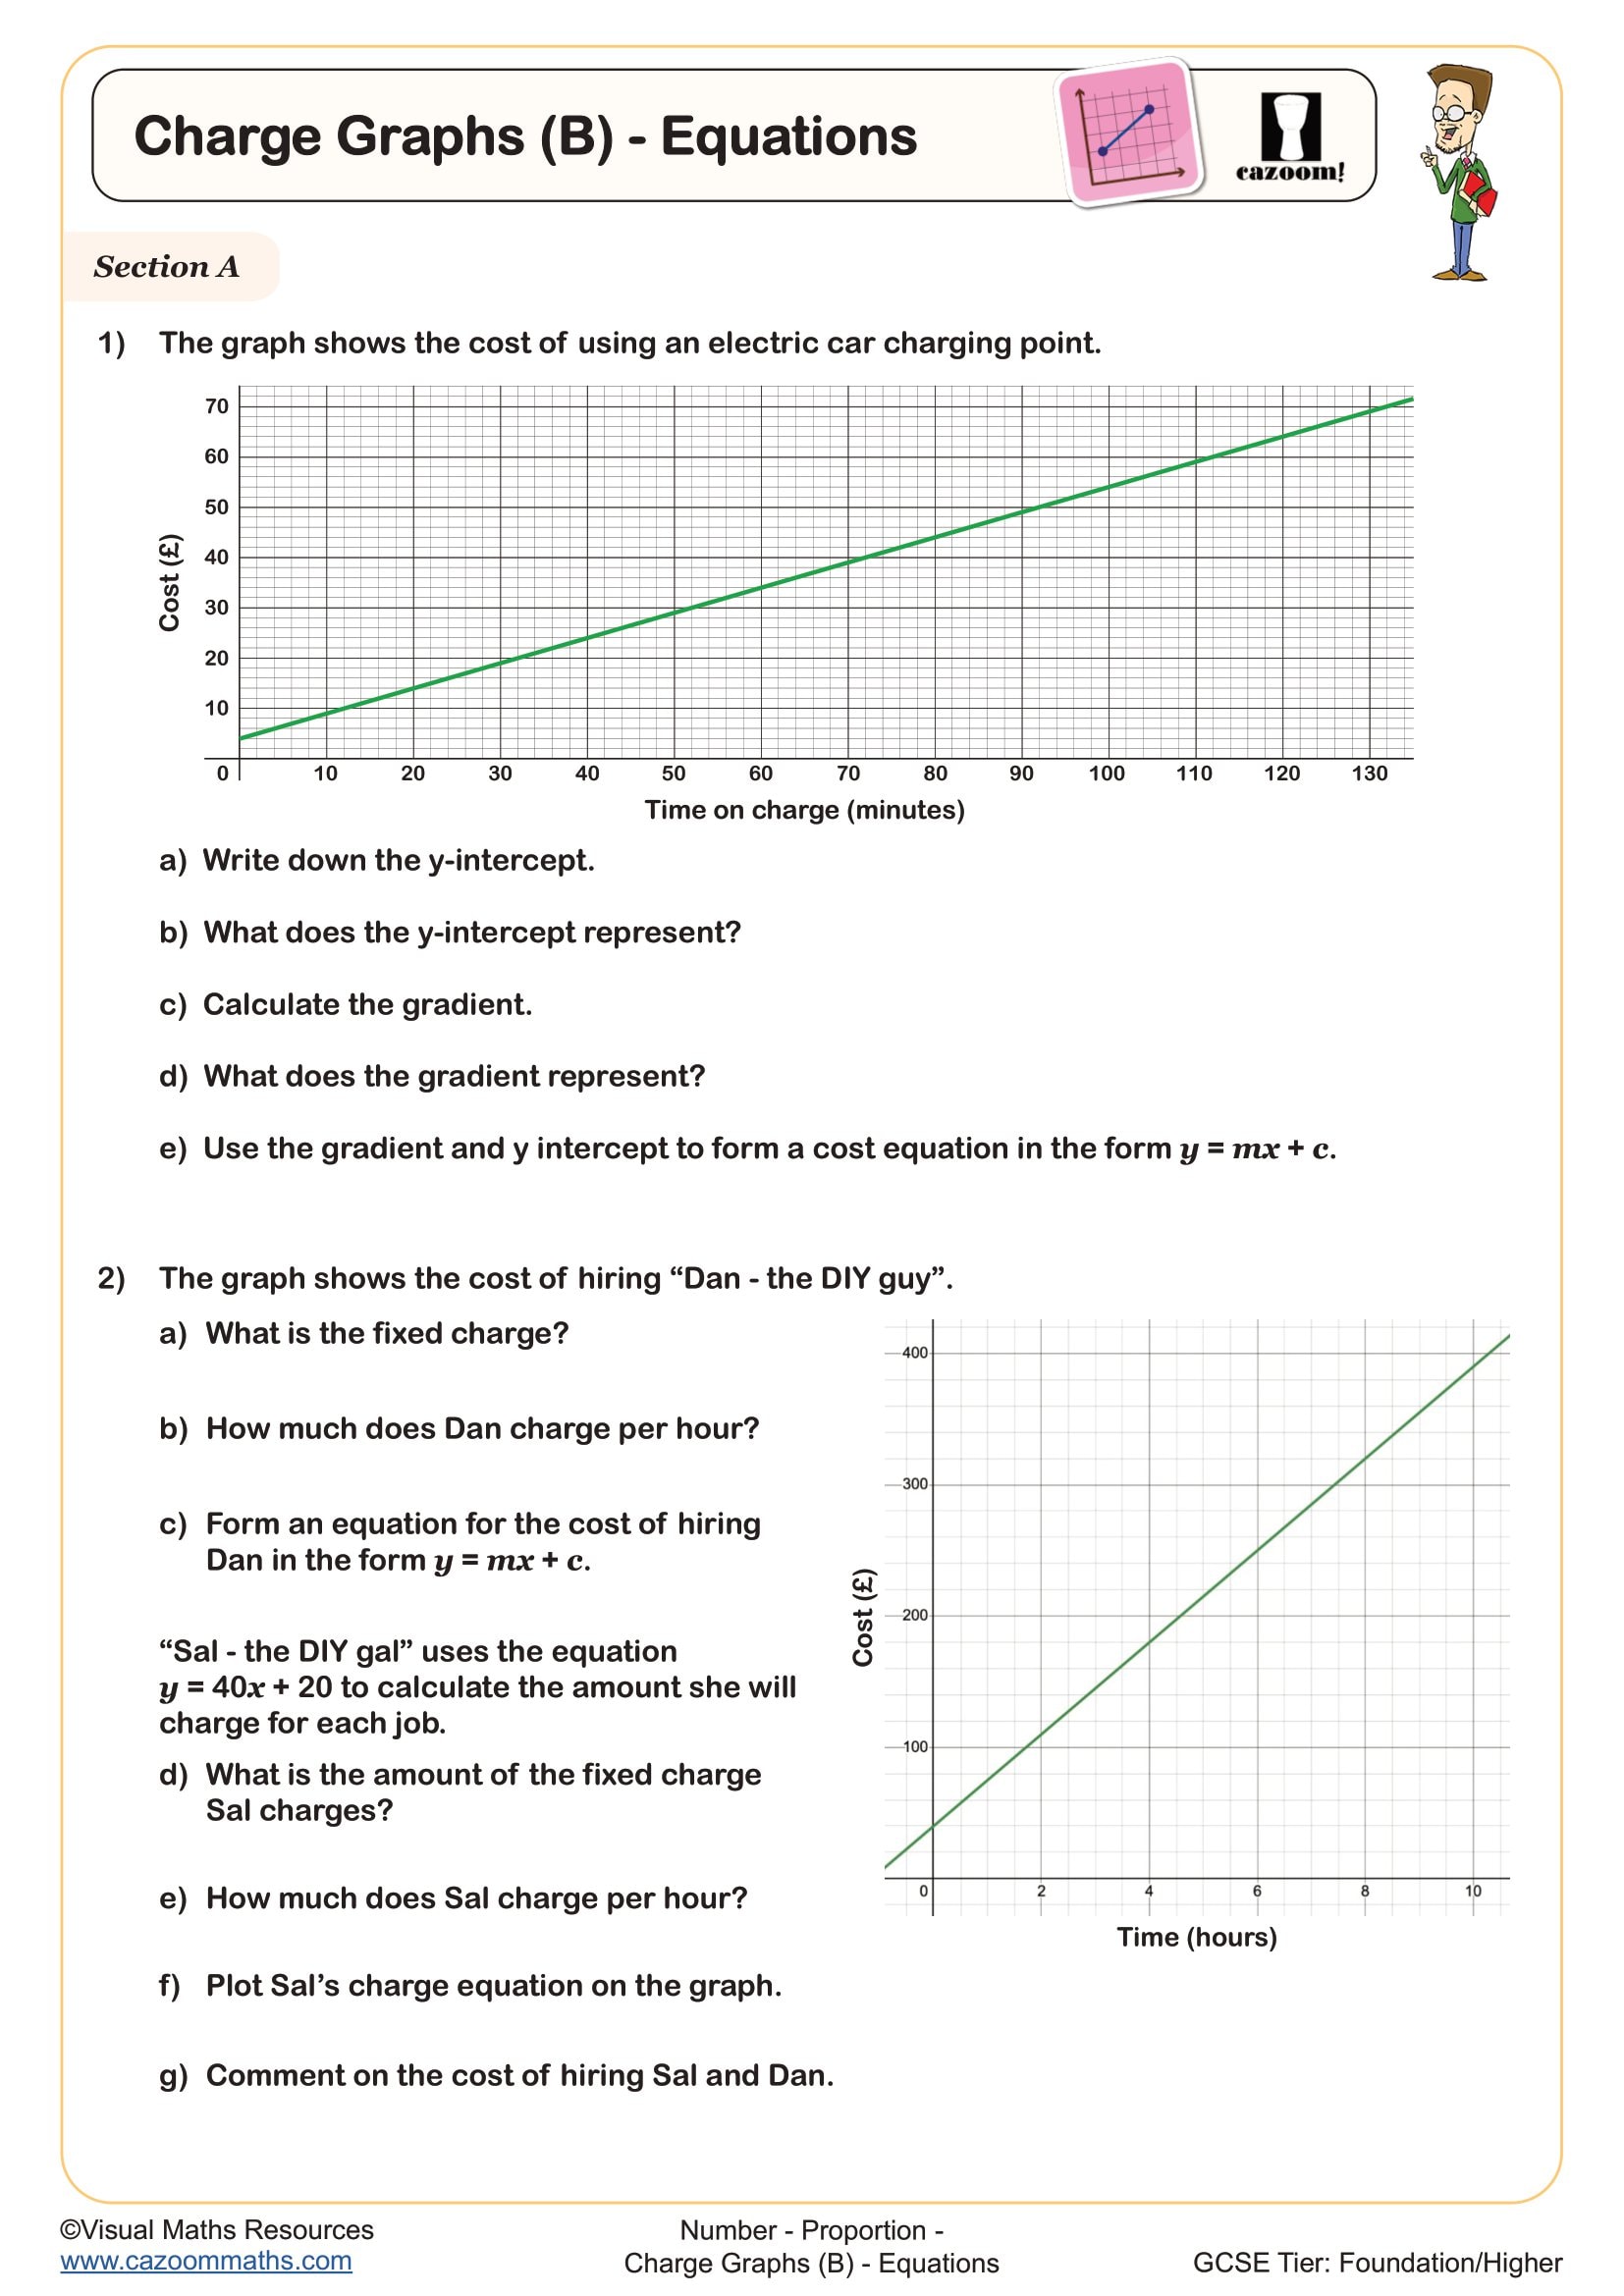
Charge Graphs (B) - Equations
Year groups: 9, 10
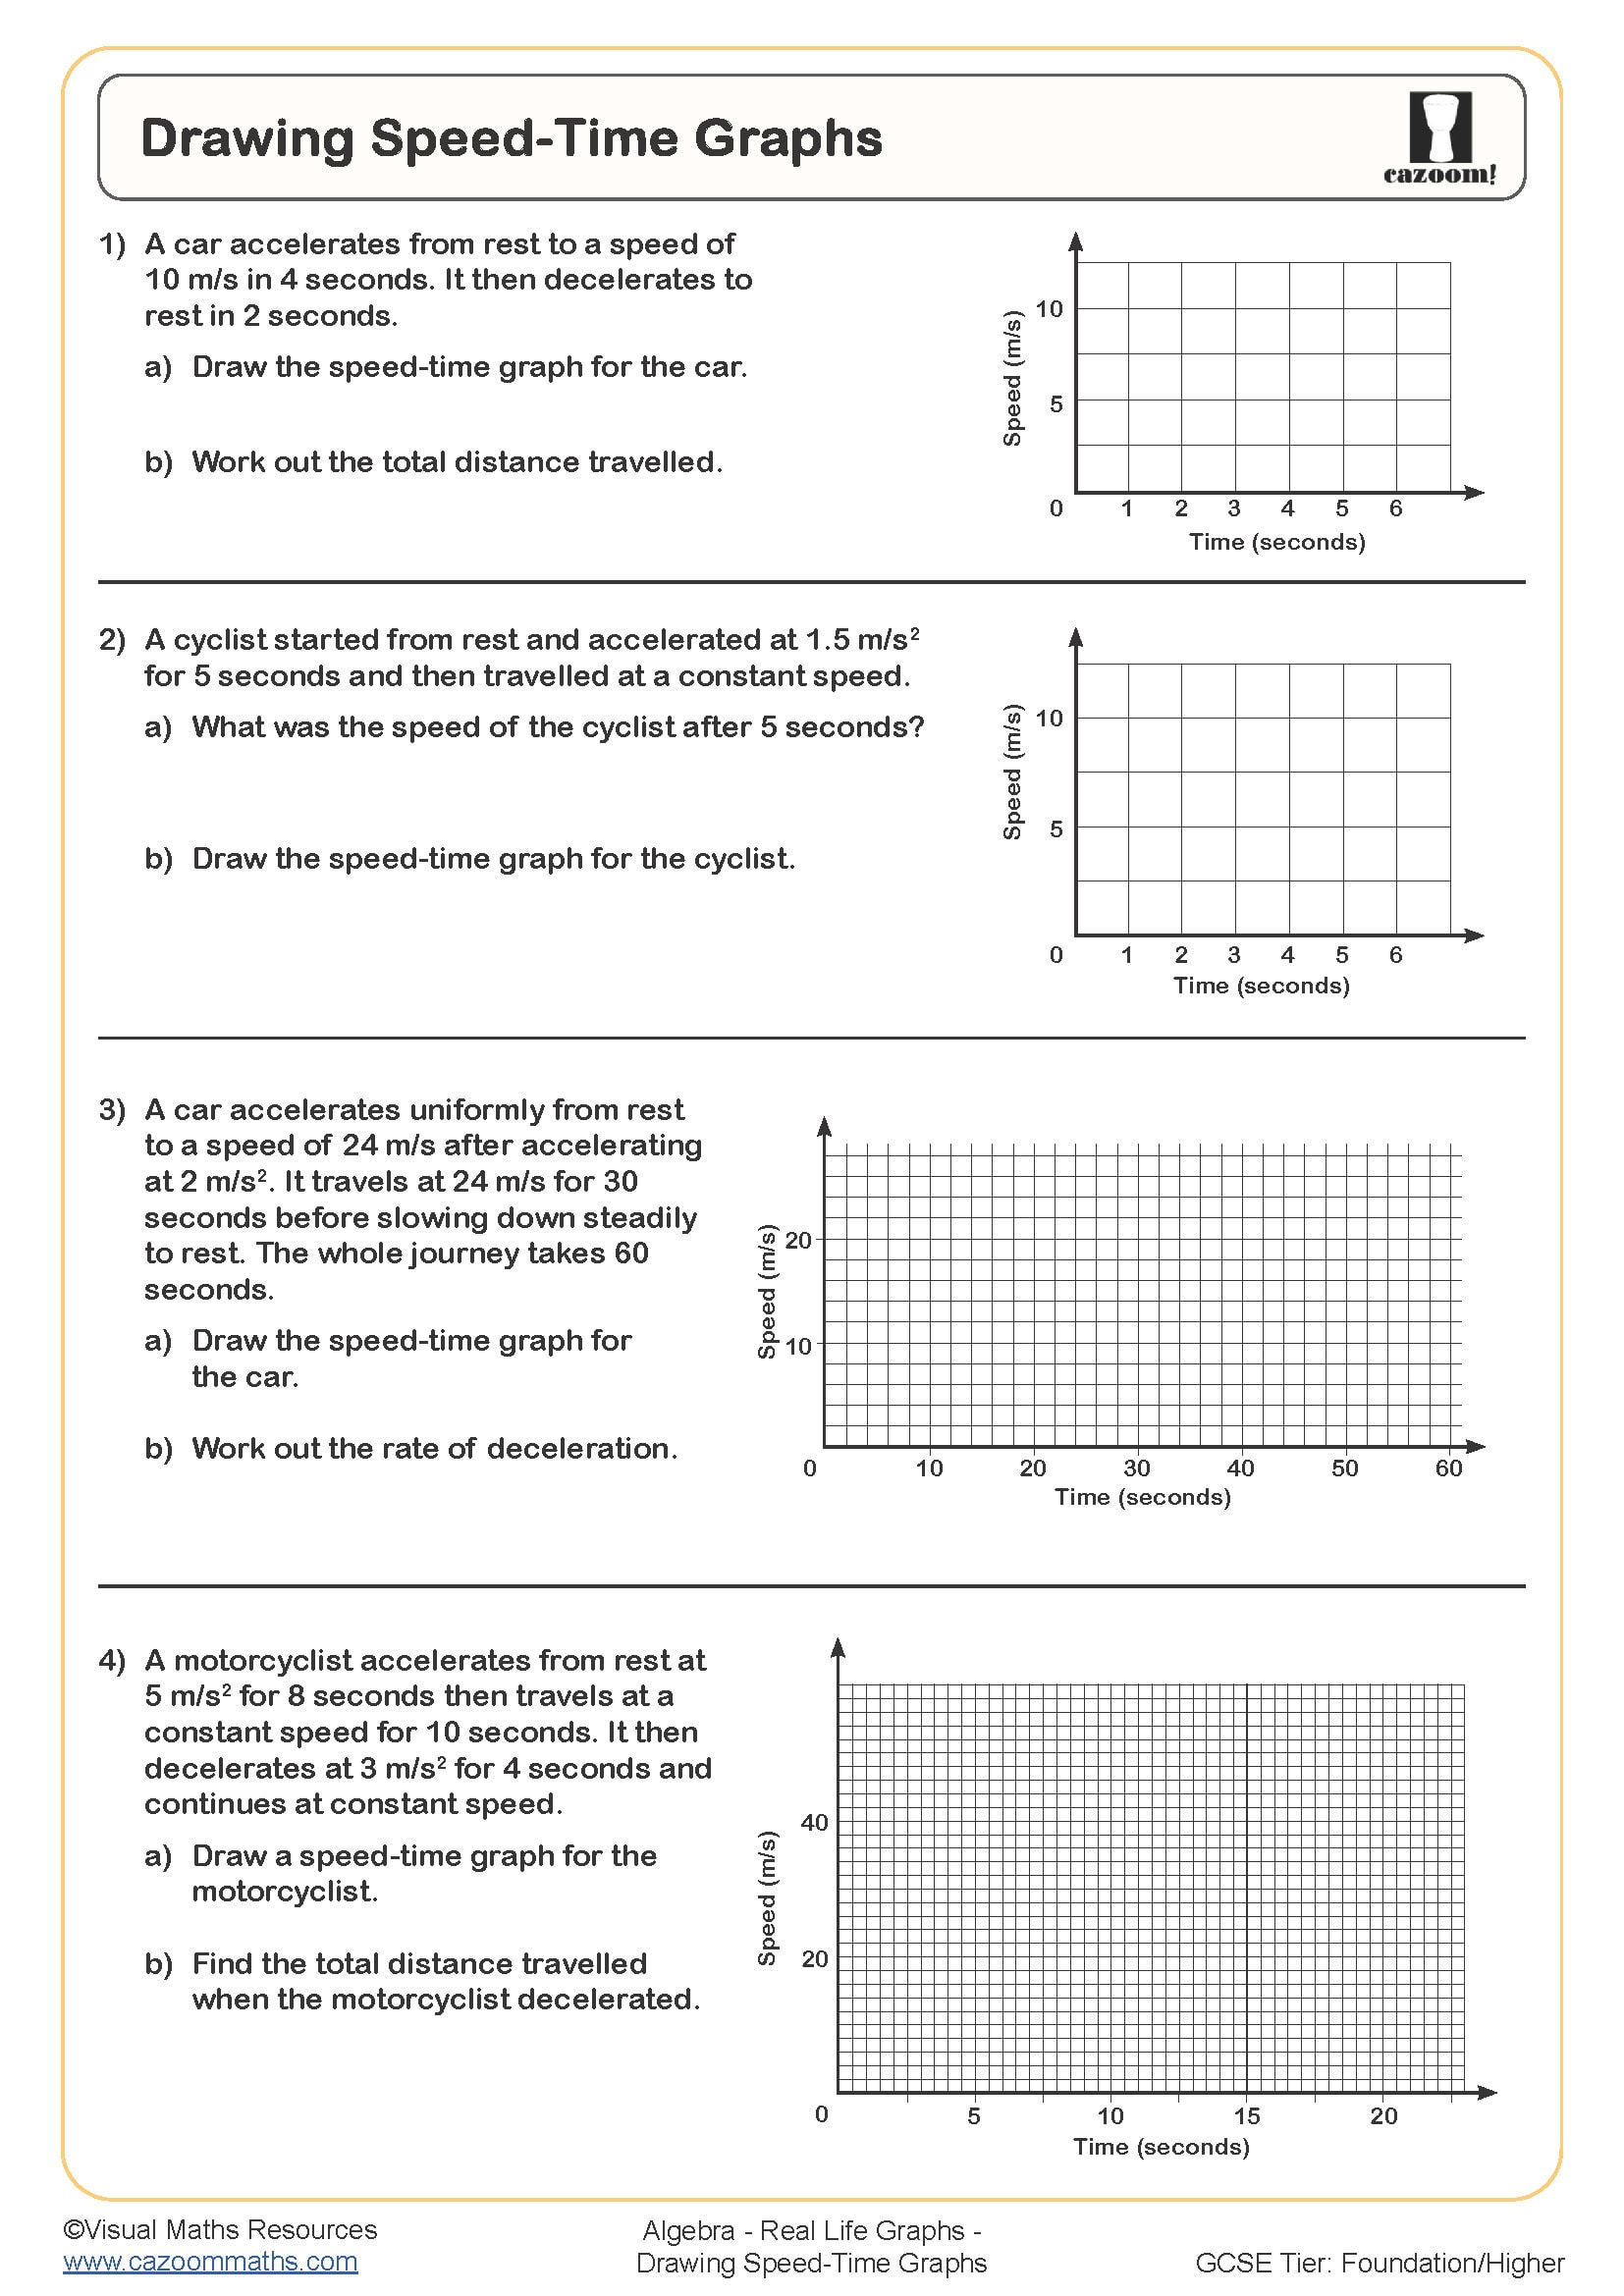
Drawing Speed Time Graphs
Year groups: 9, 10
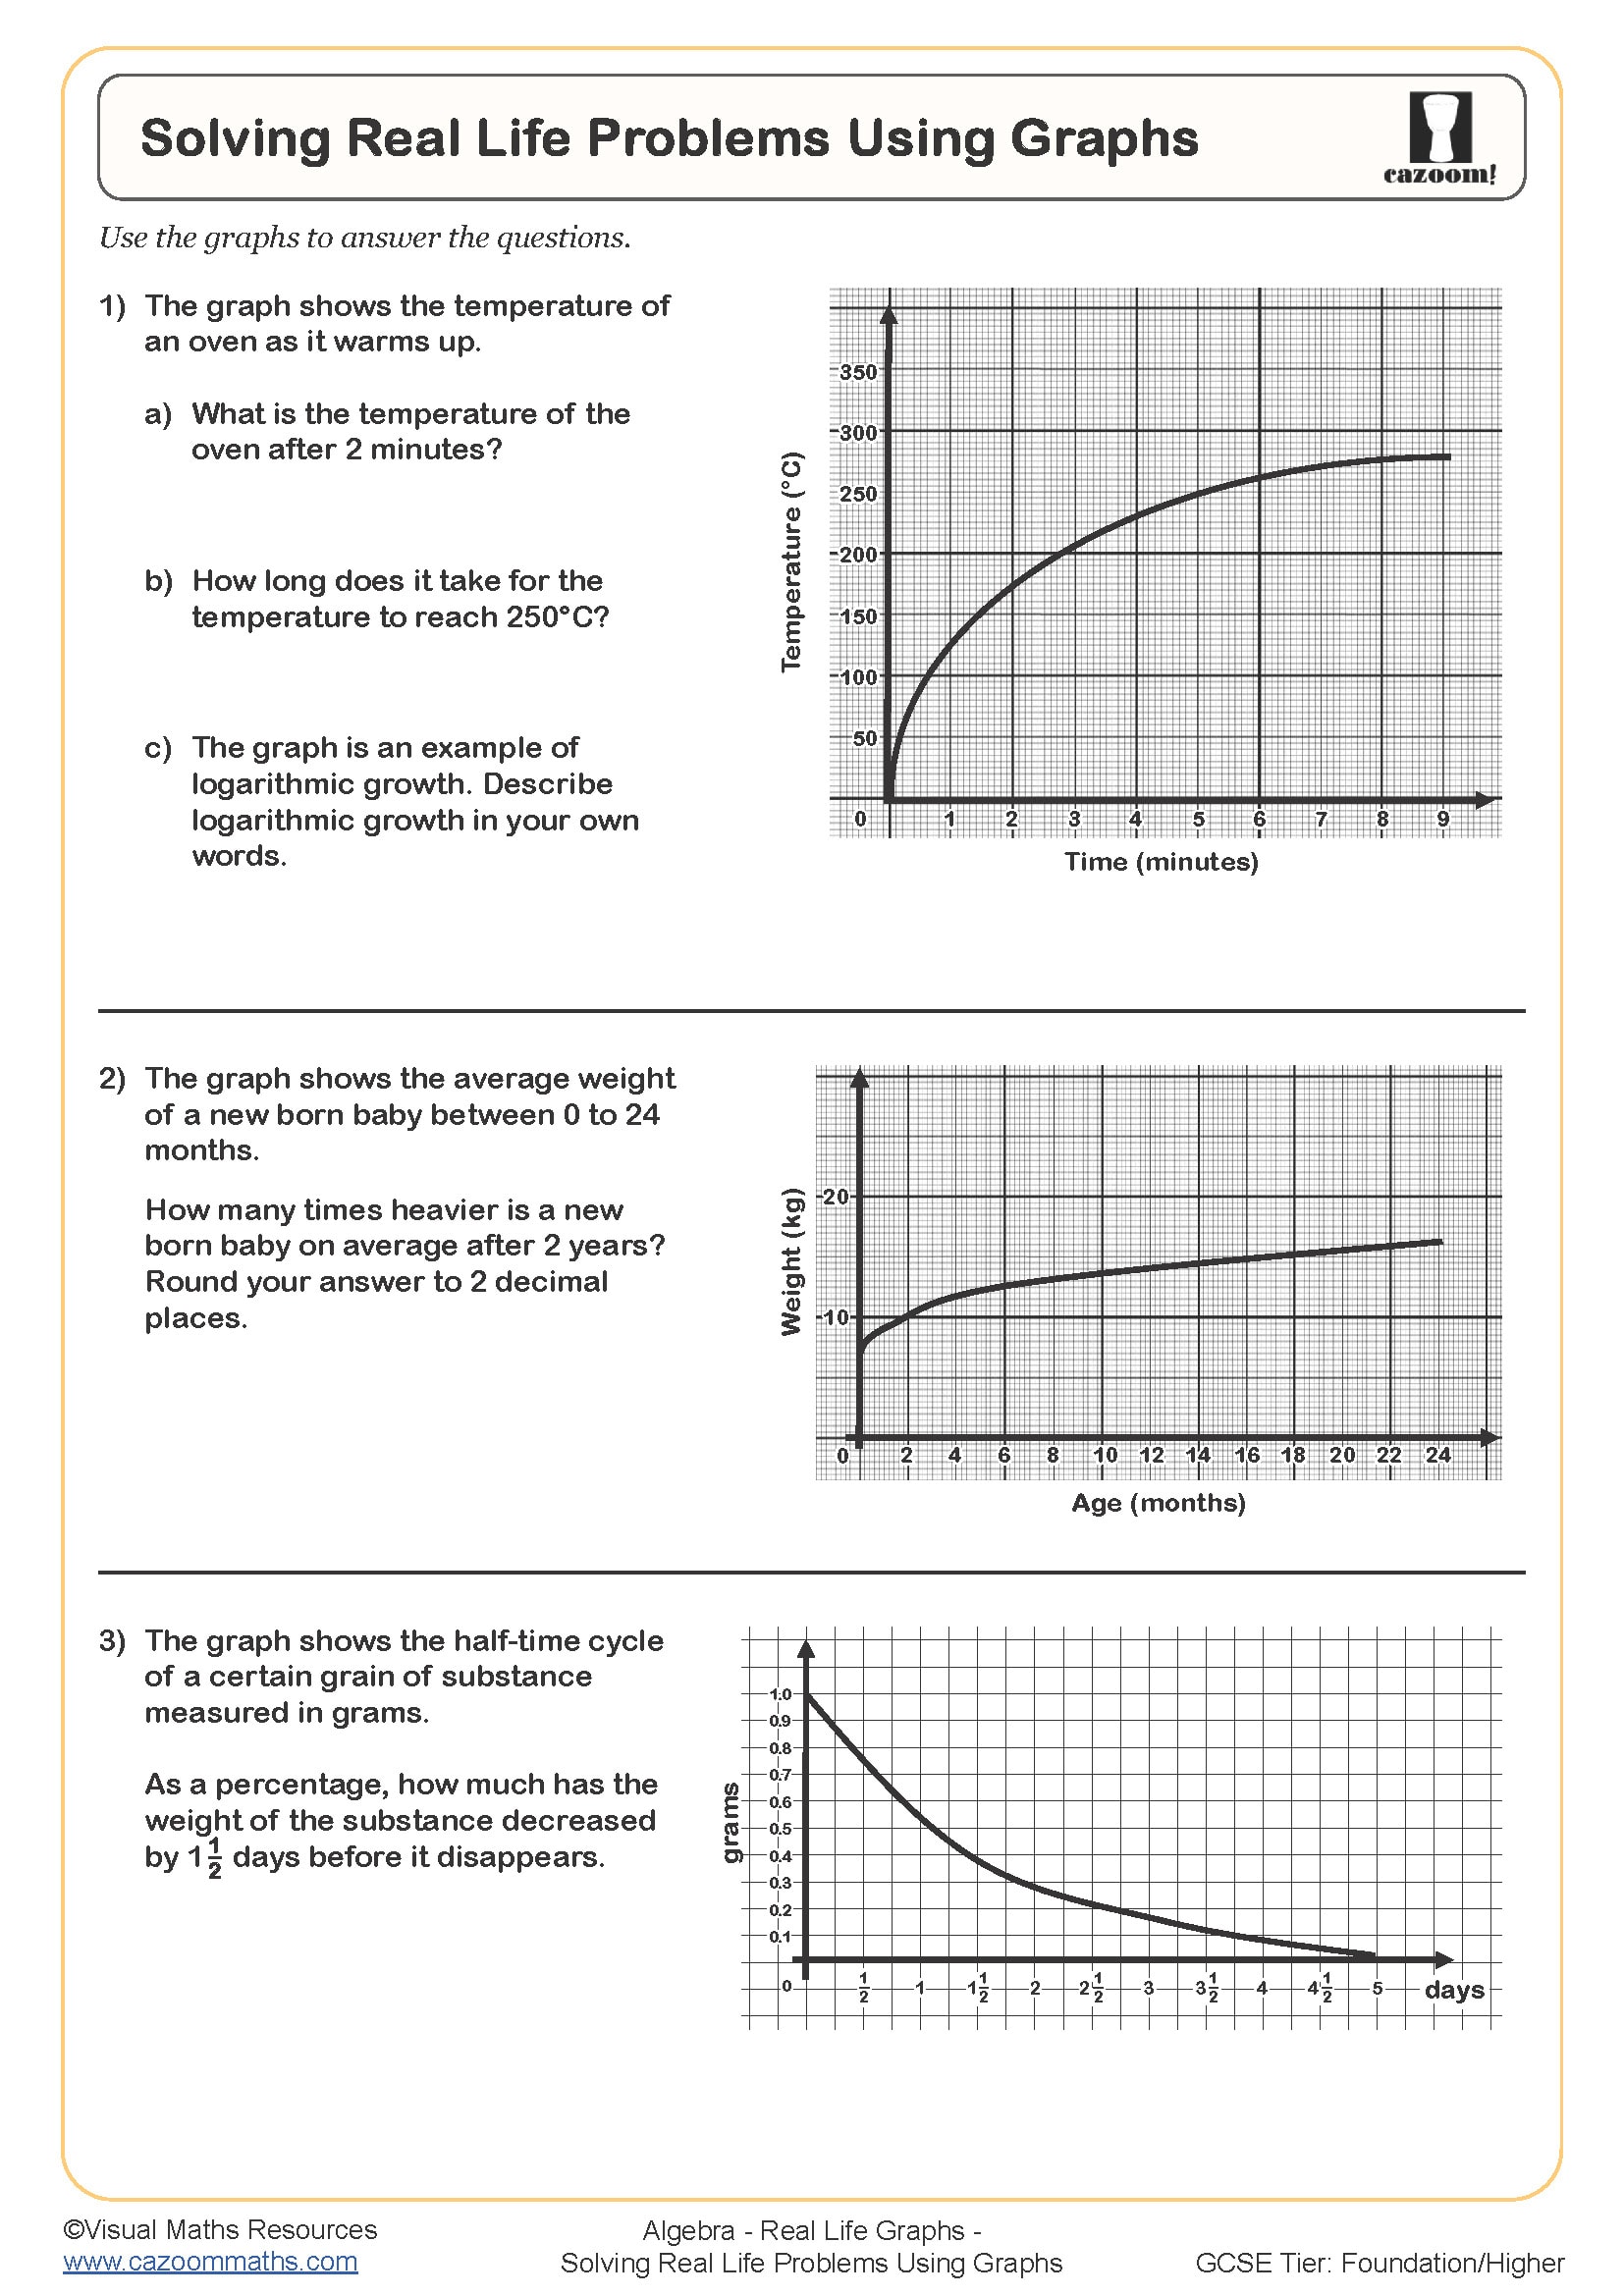
Solving real life problems using graphs
Year groups: 9, 10
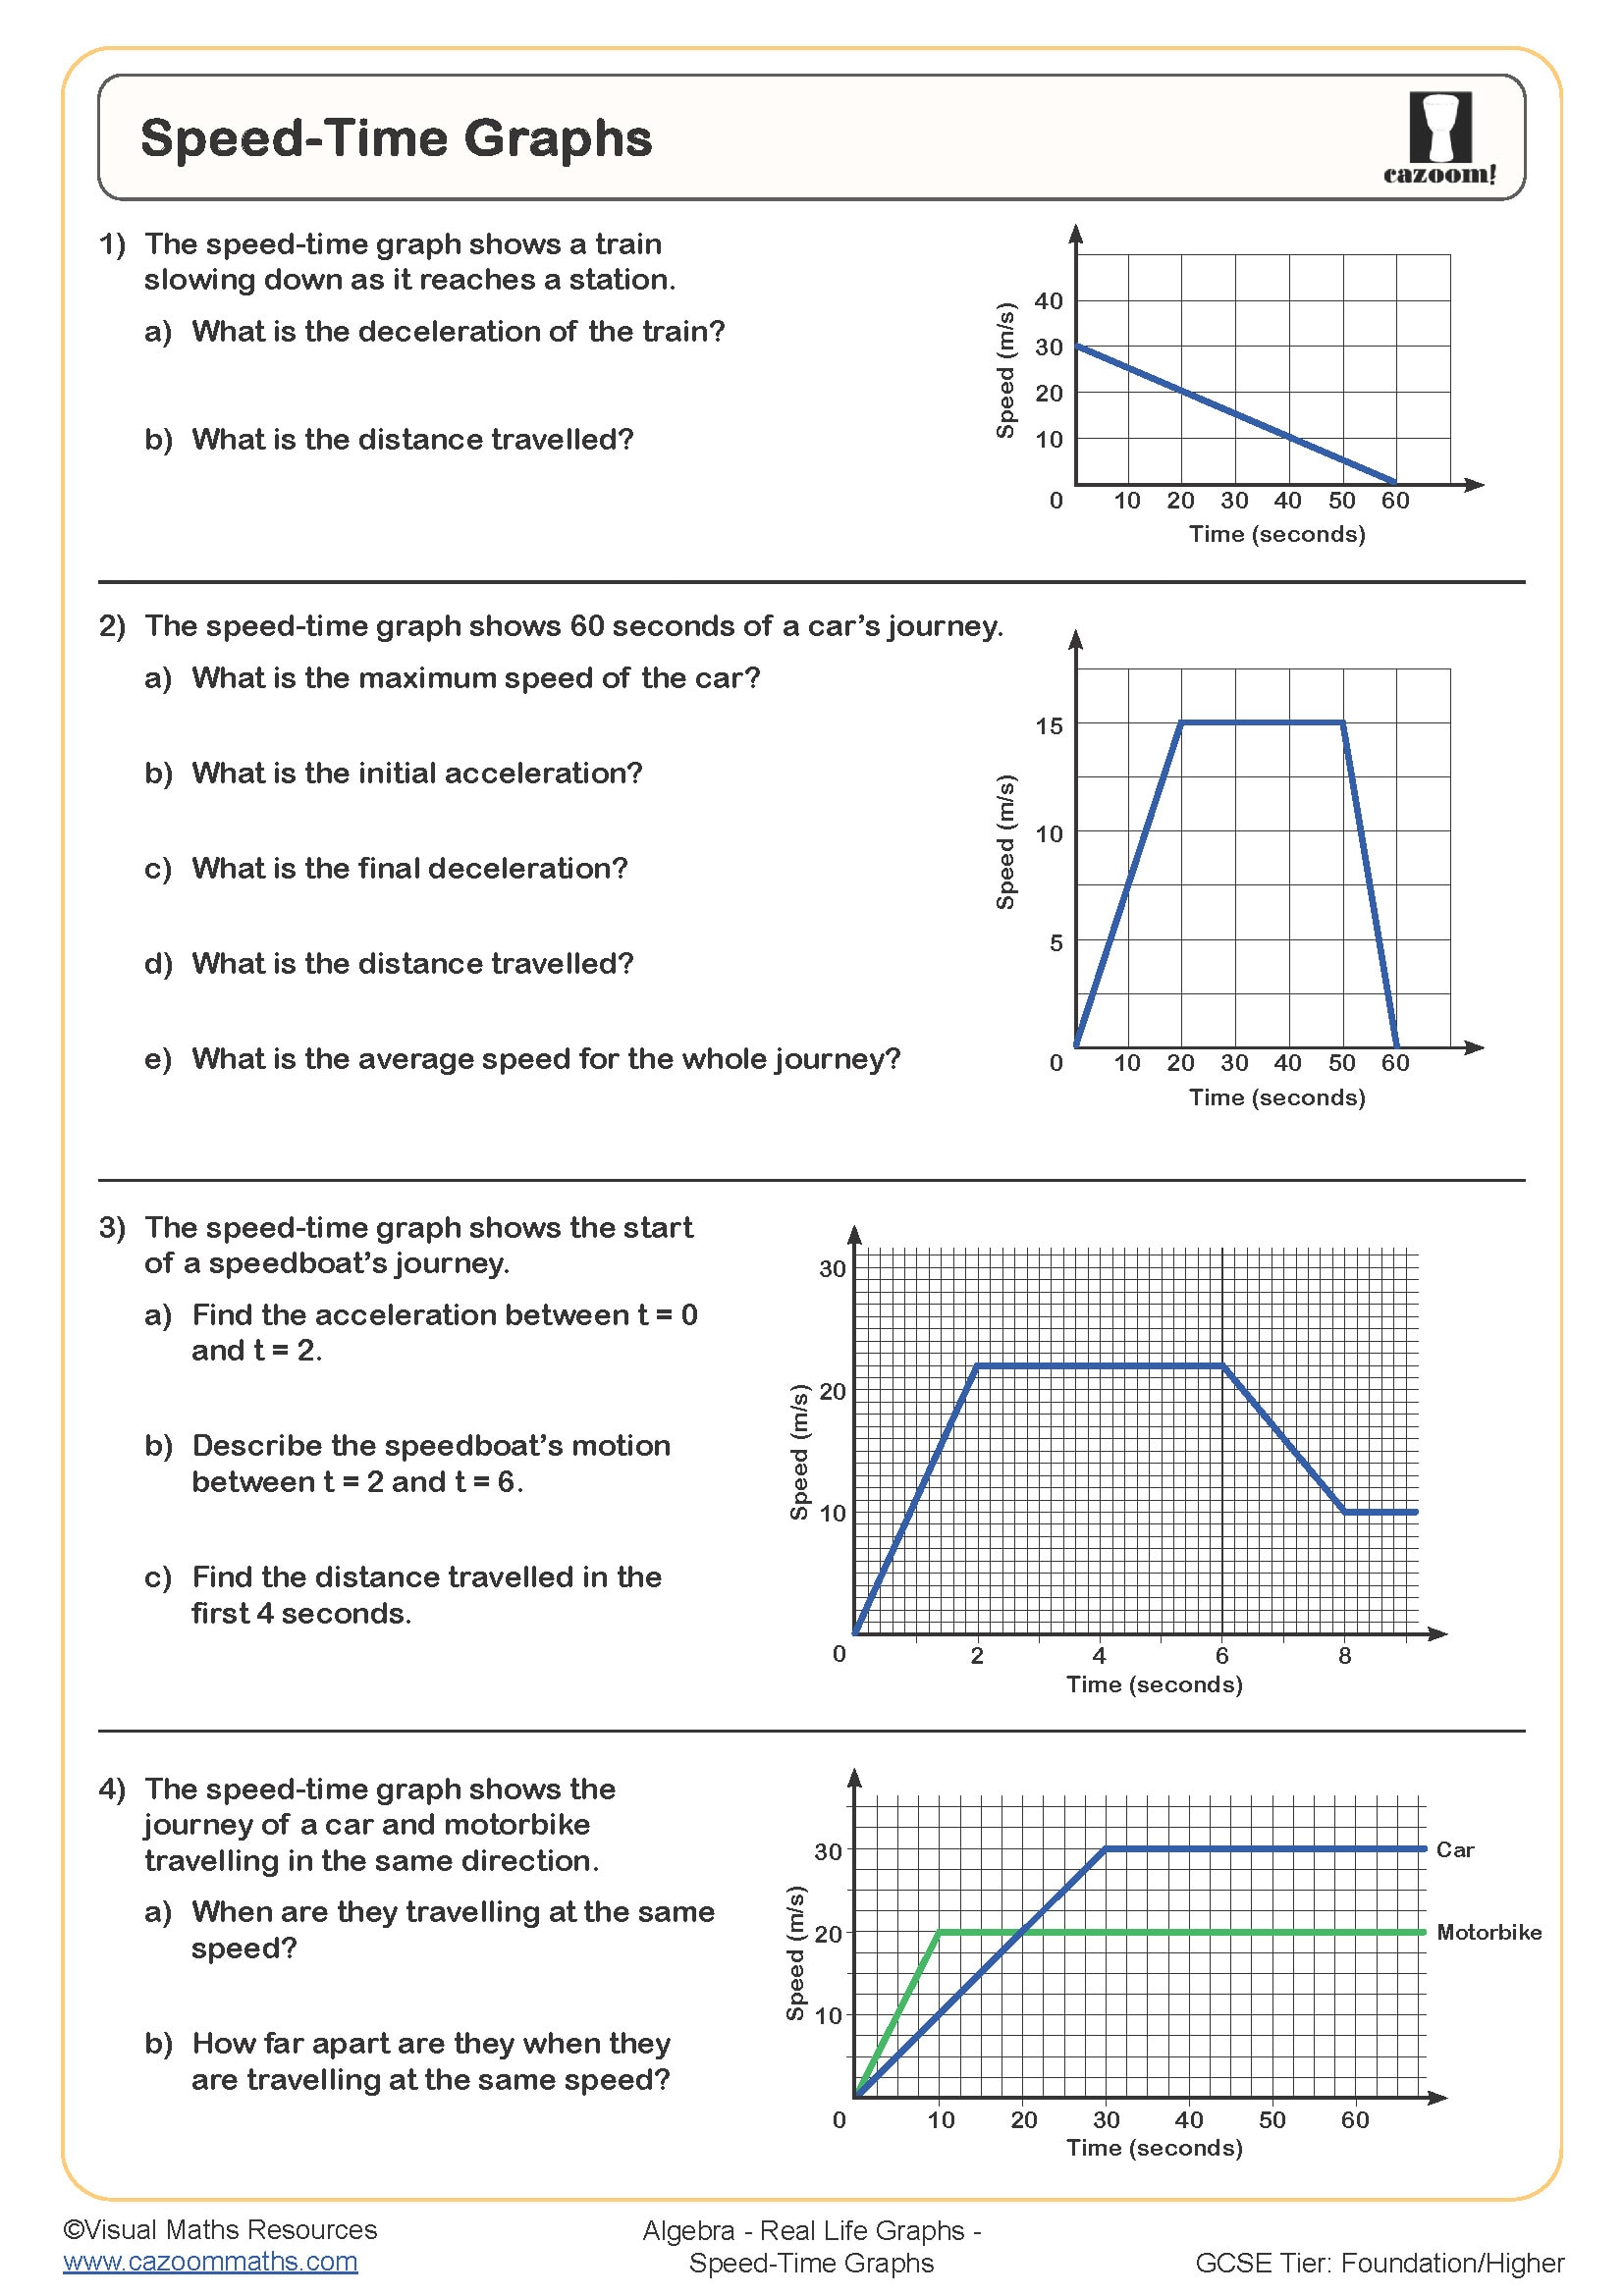
Speed Time Graphs
Year groups: 9, 10
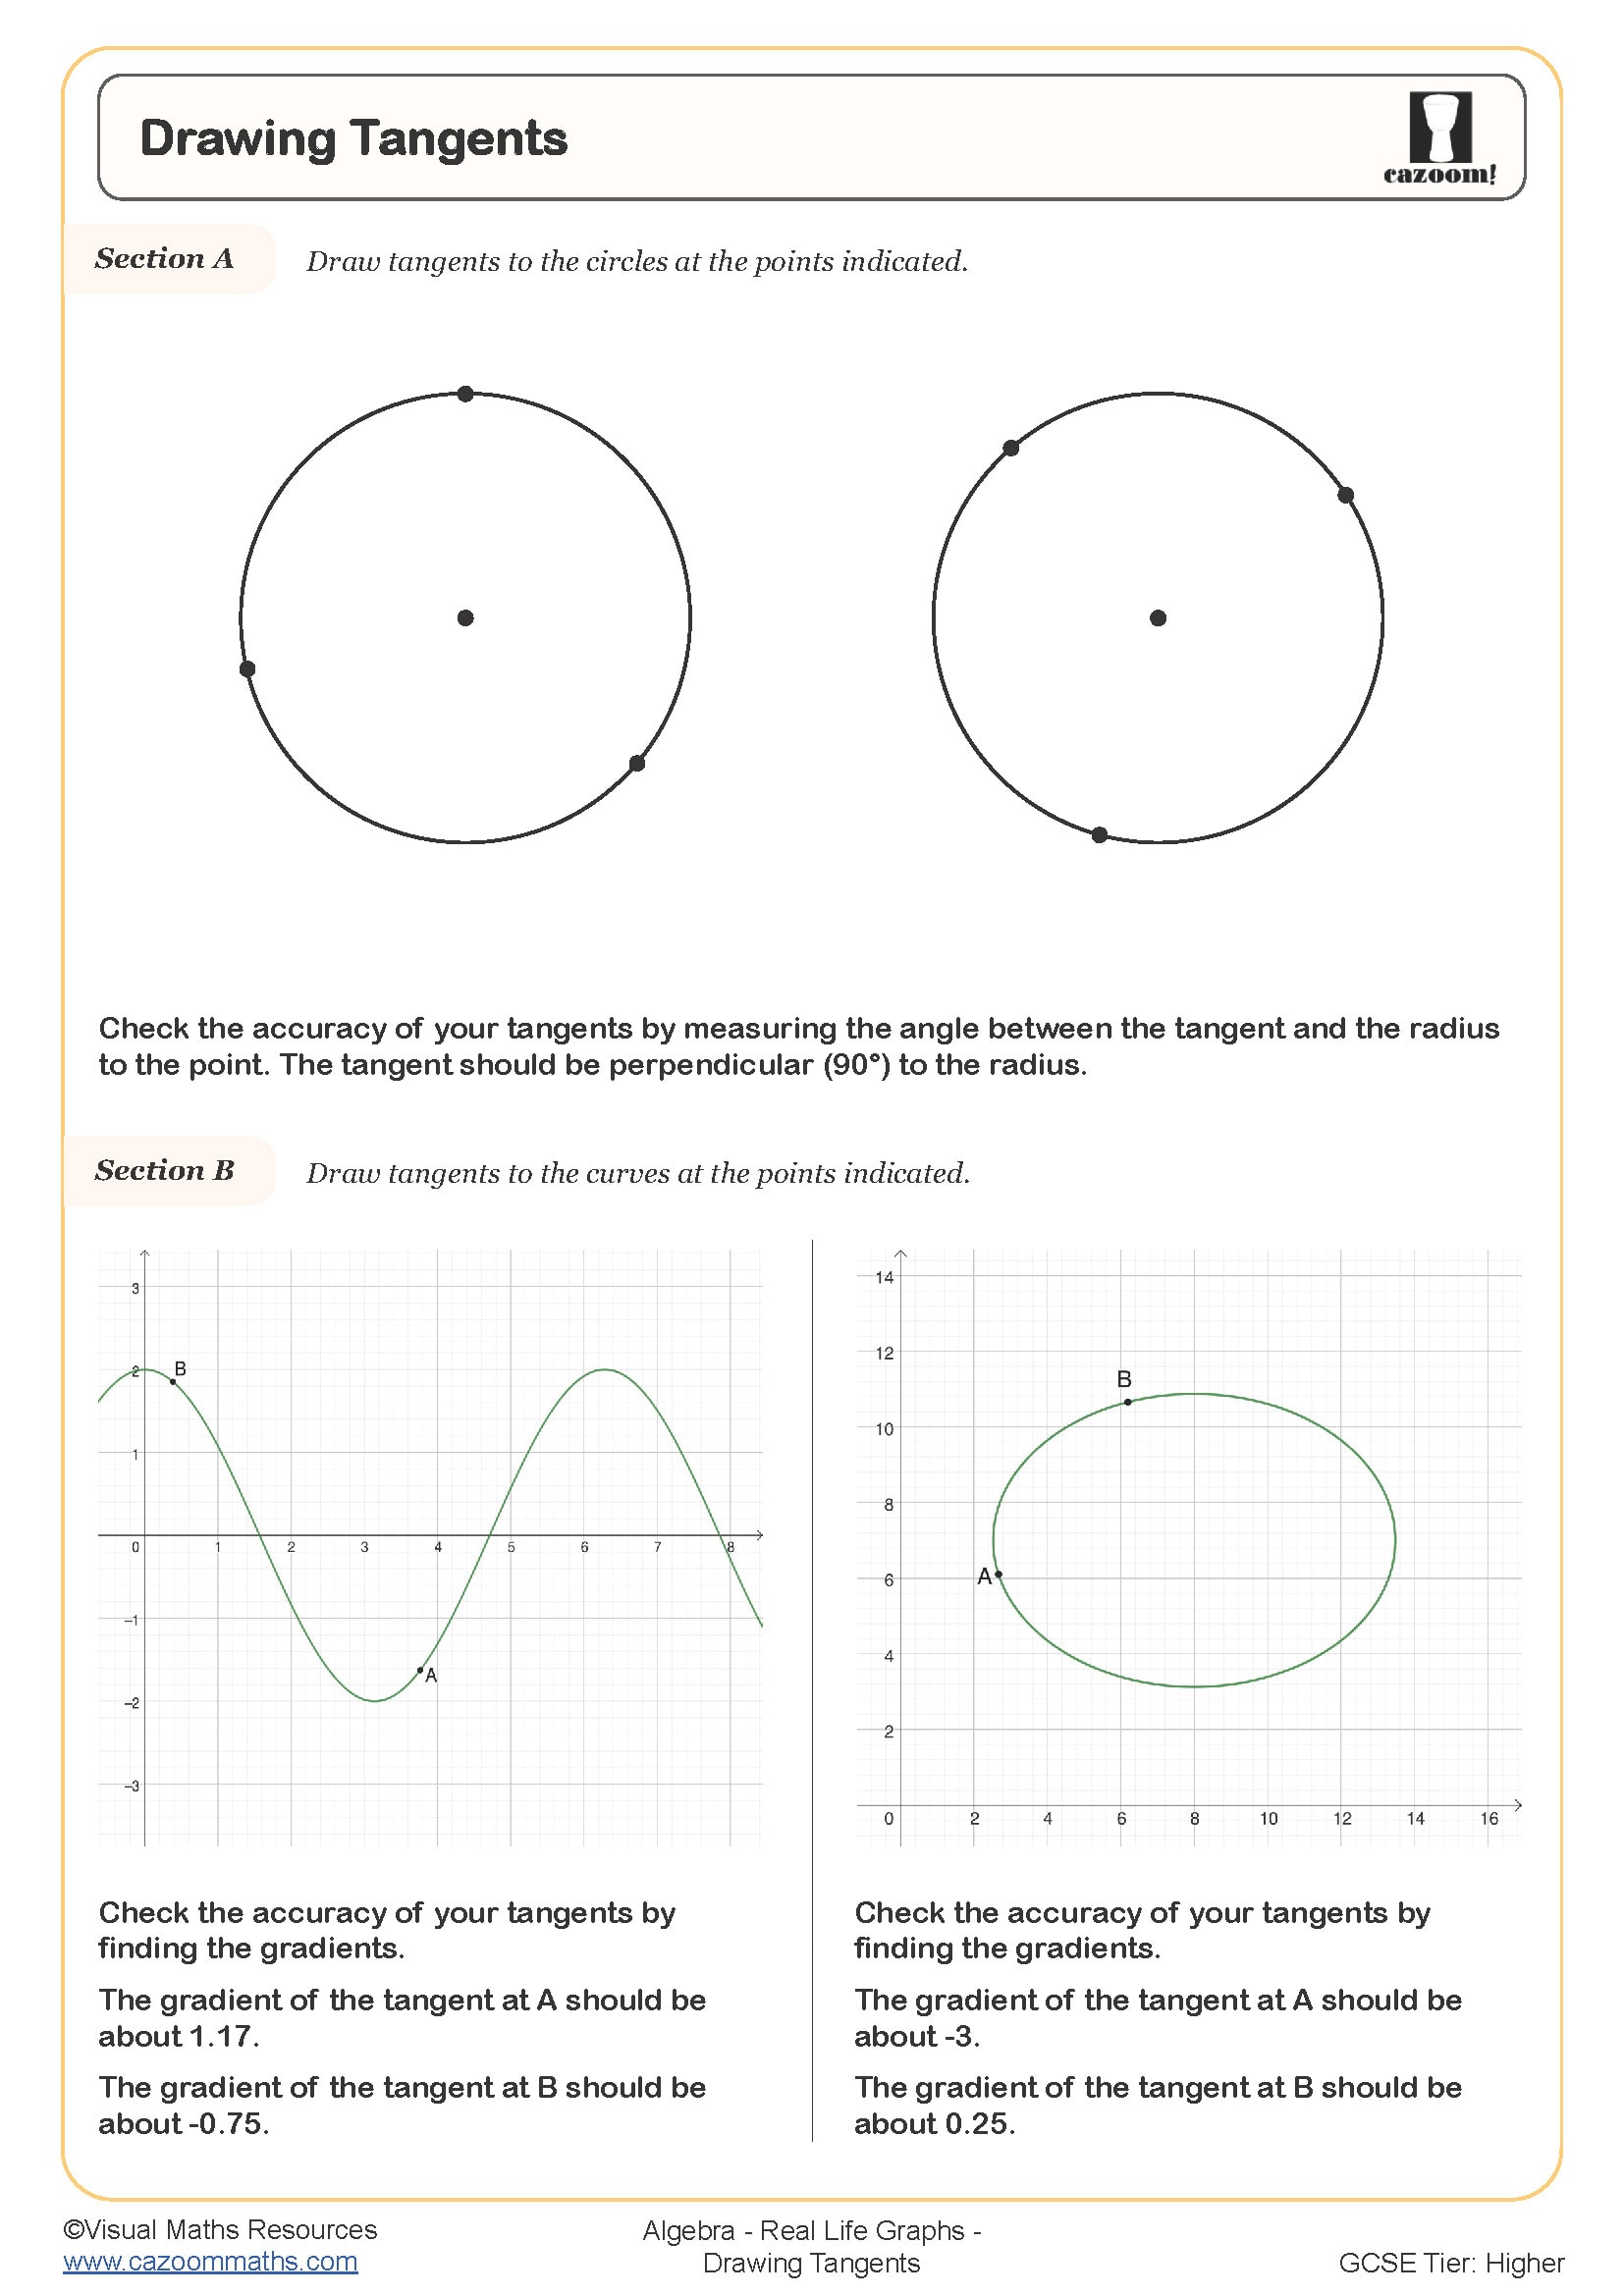
Drawing tangents
Year groups: 10, 11
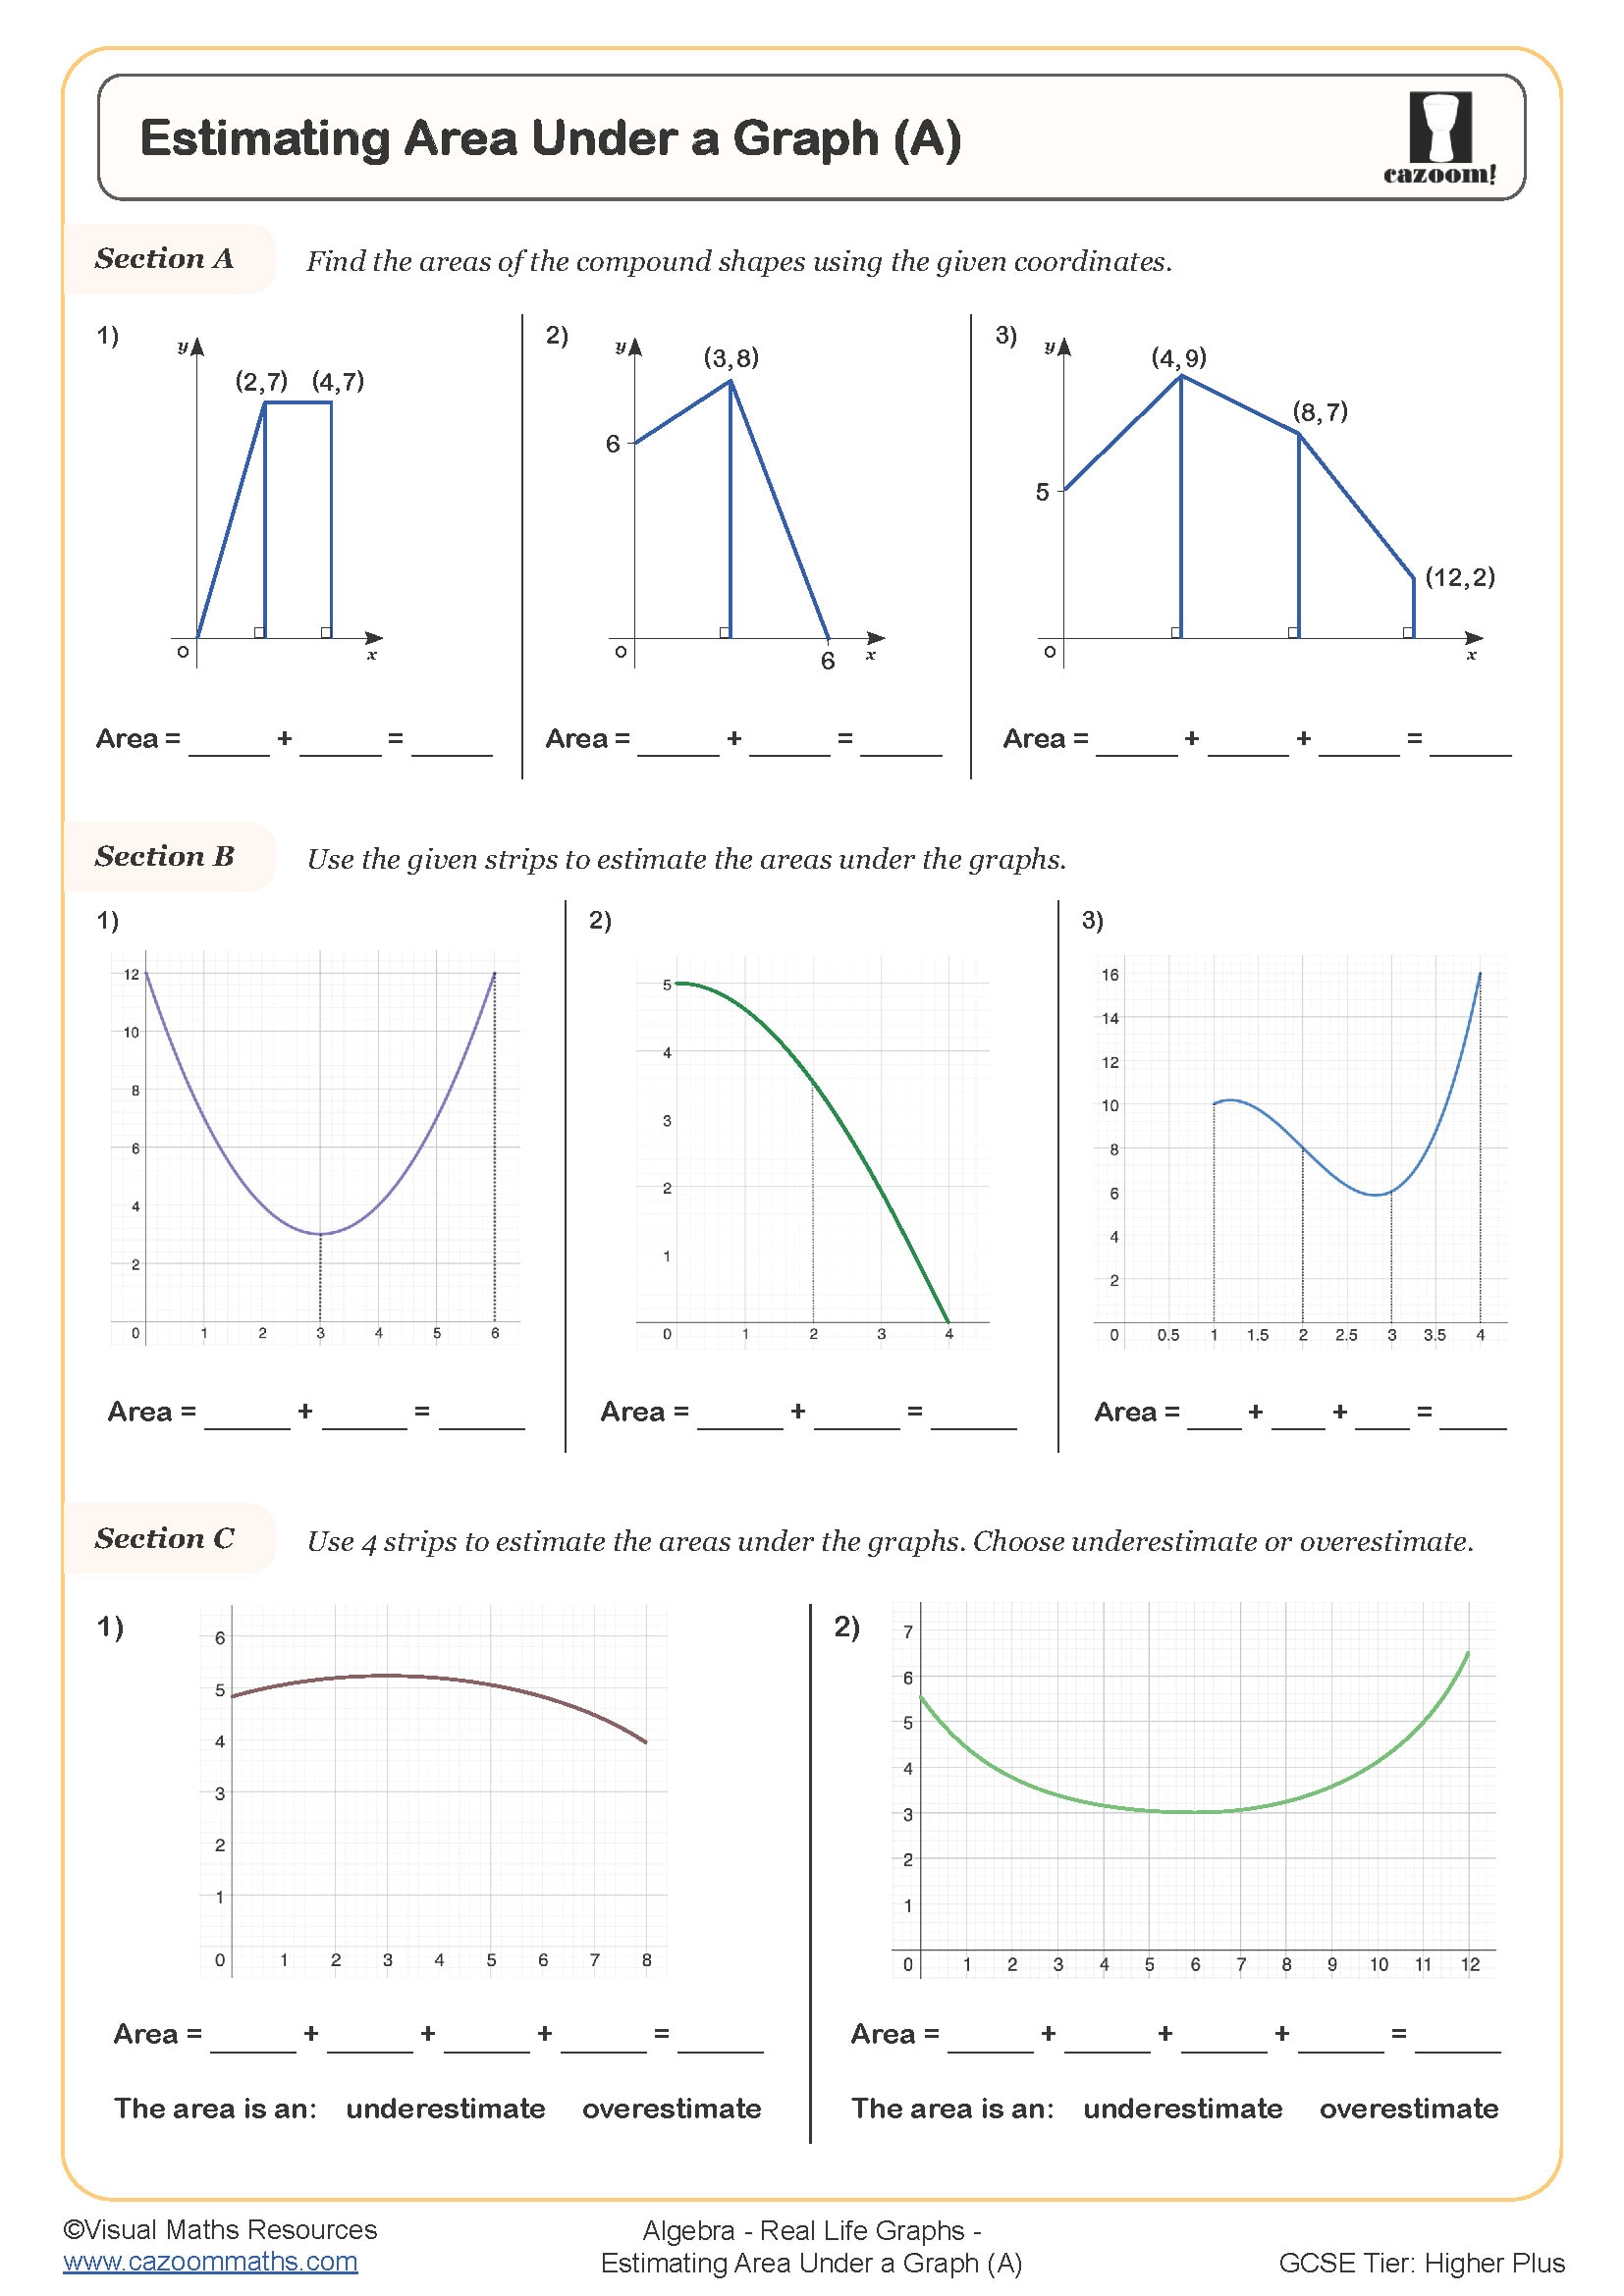
Estimating Area Under a Graph (A)
Year groups: 10, 11
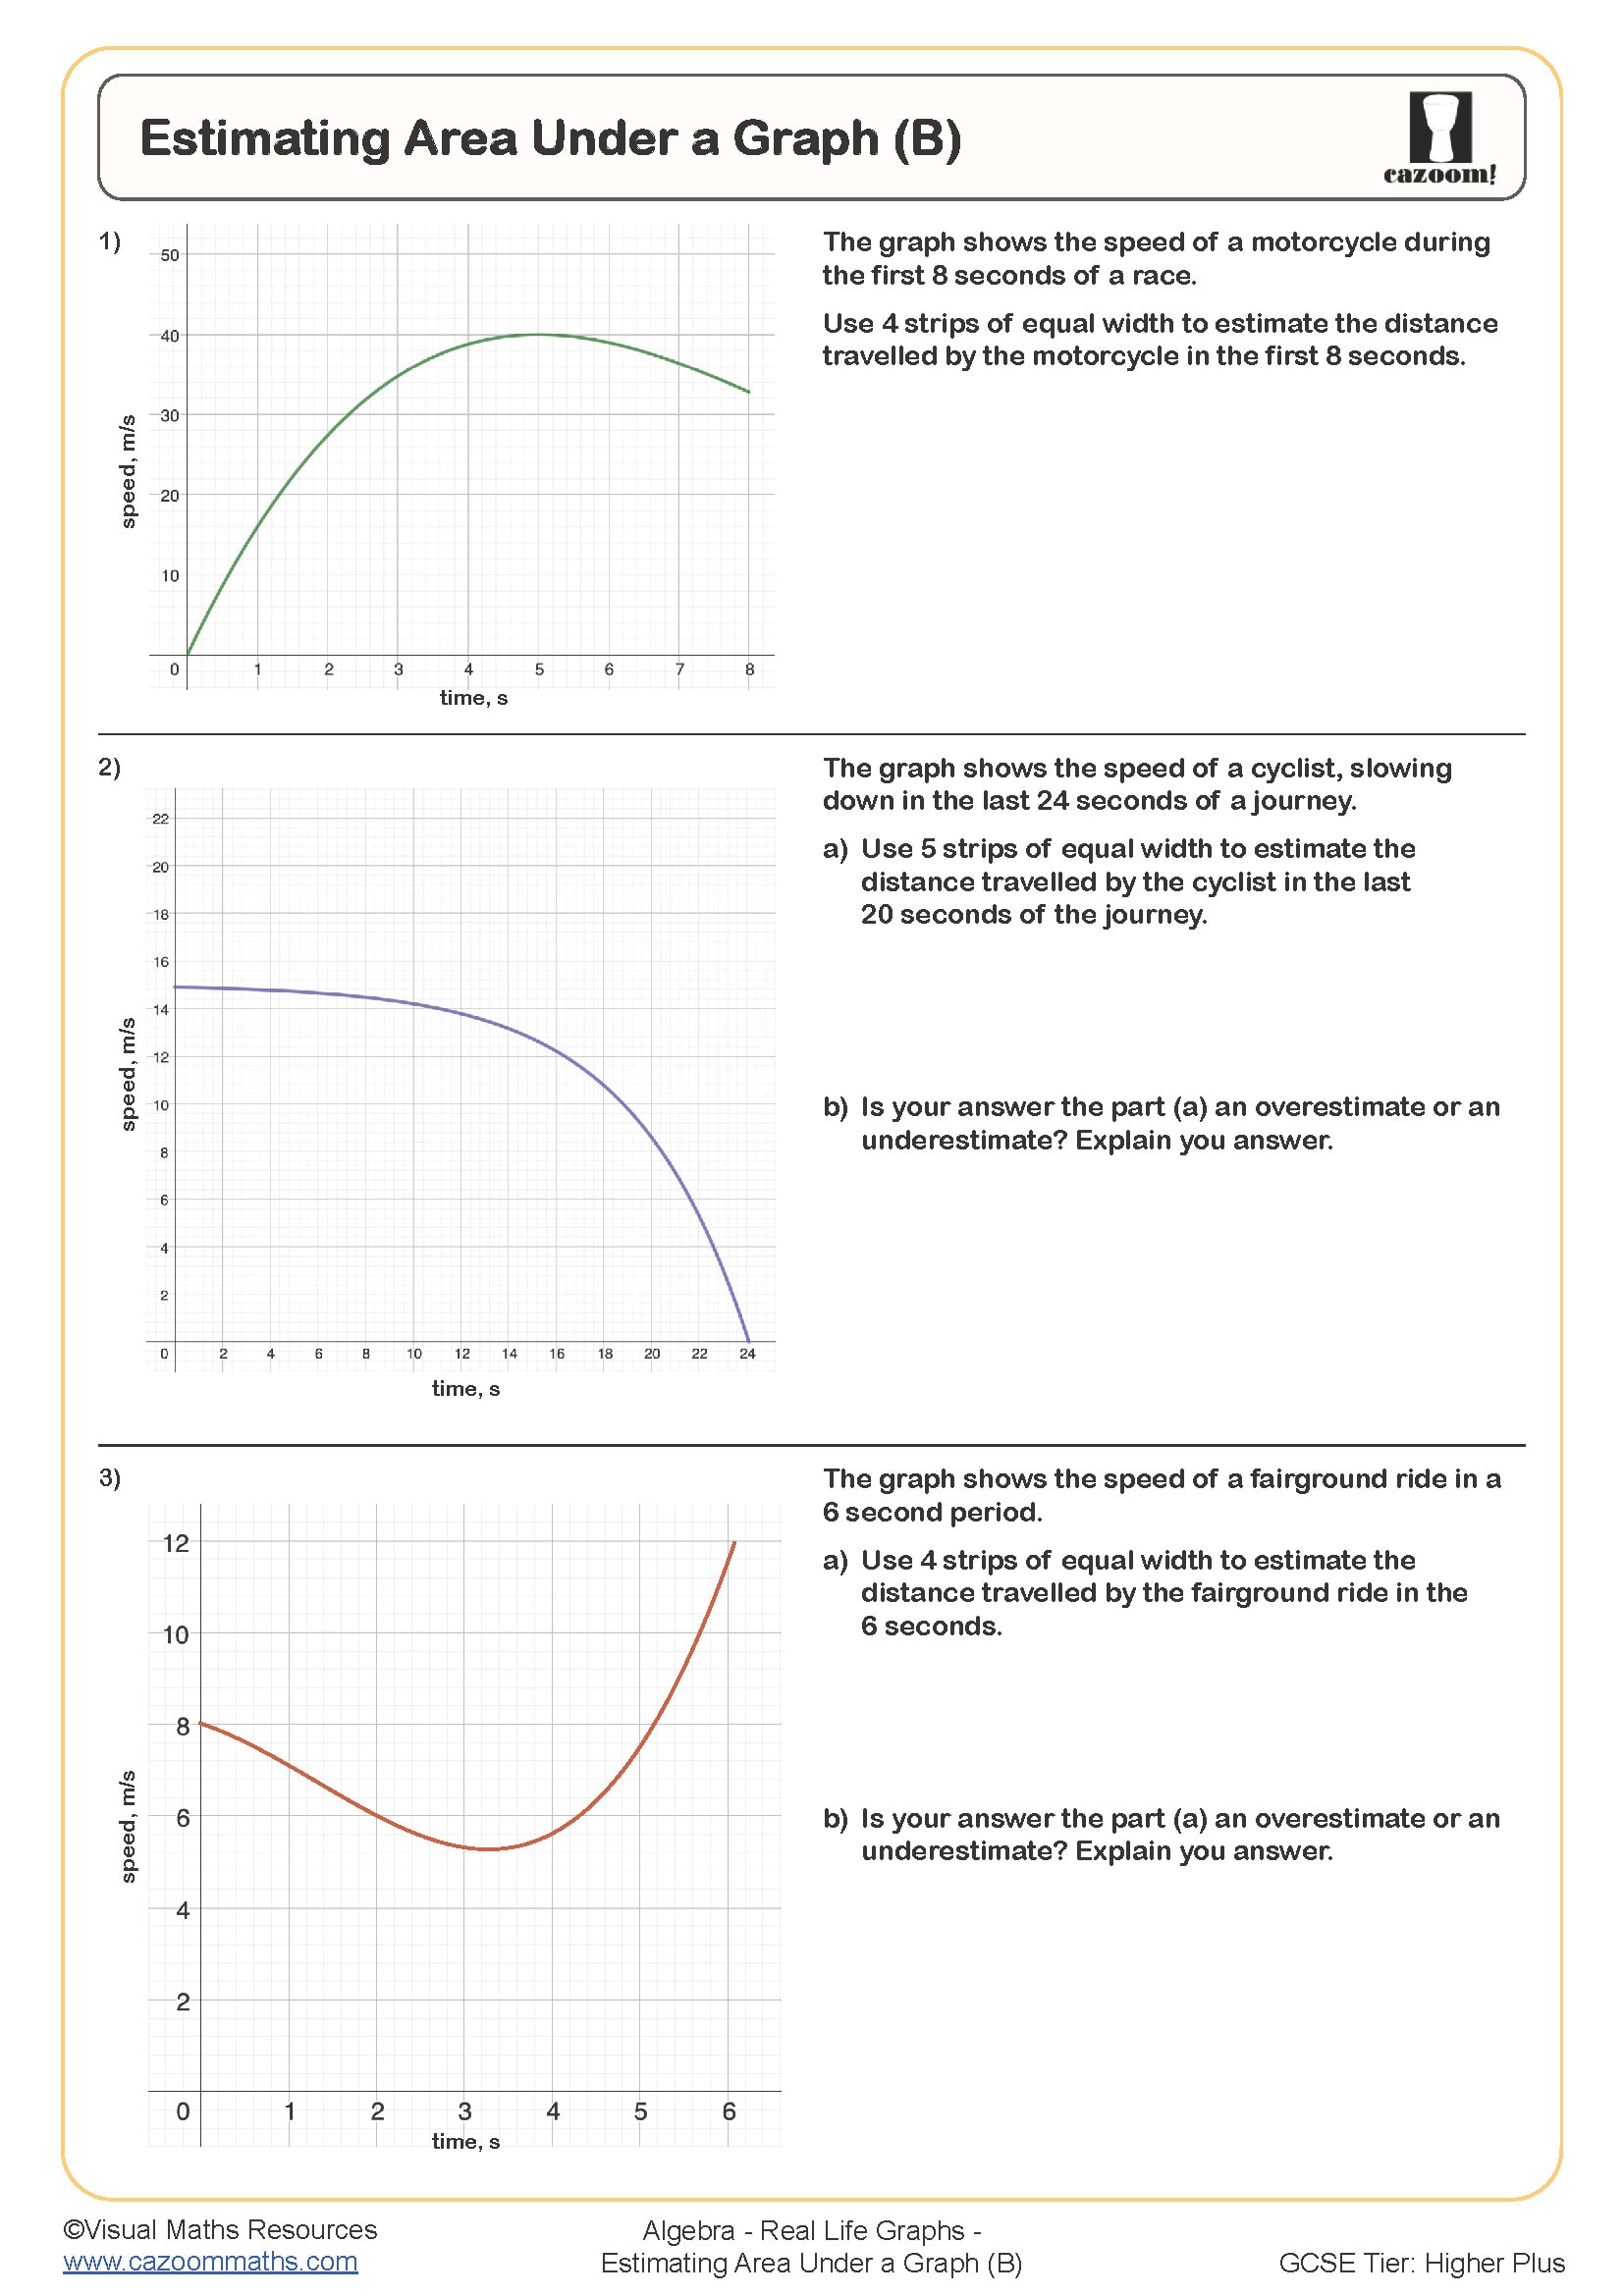
Estimating Area Under a Graph (B)
Year groups: 10, 11
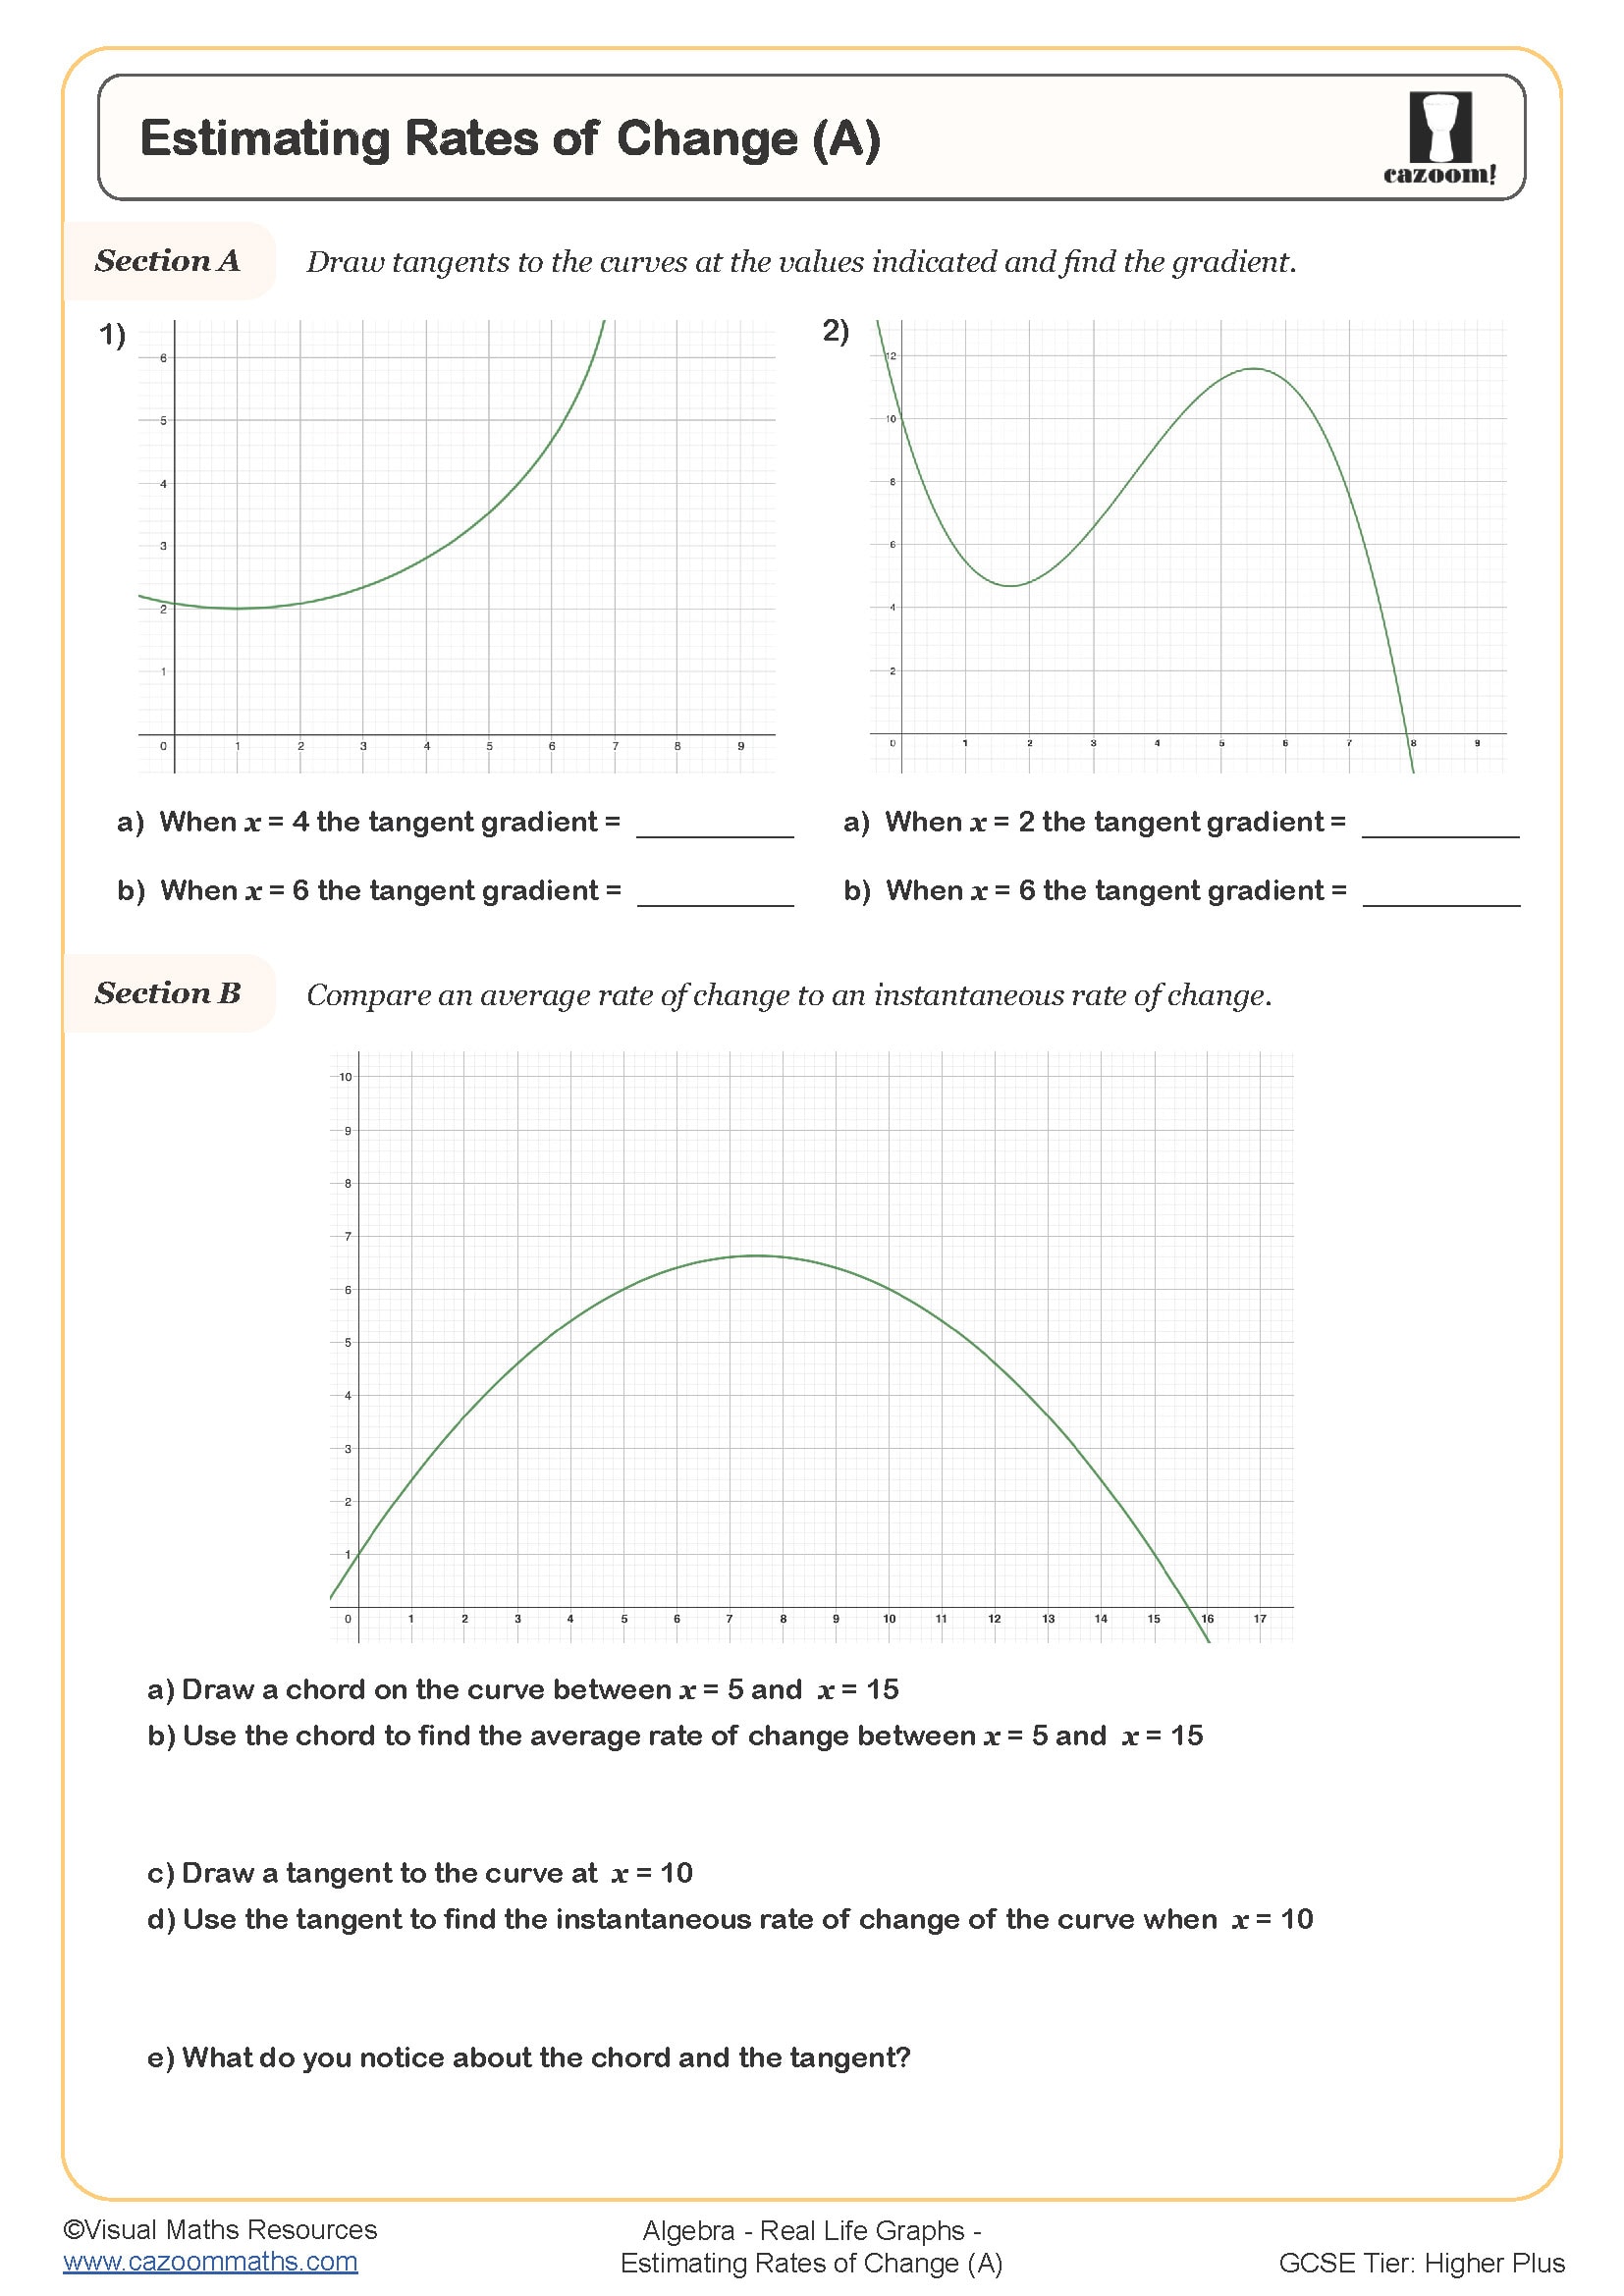
Estimating Rates of Change (A)
Year groups: 10, 11
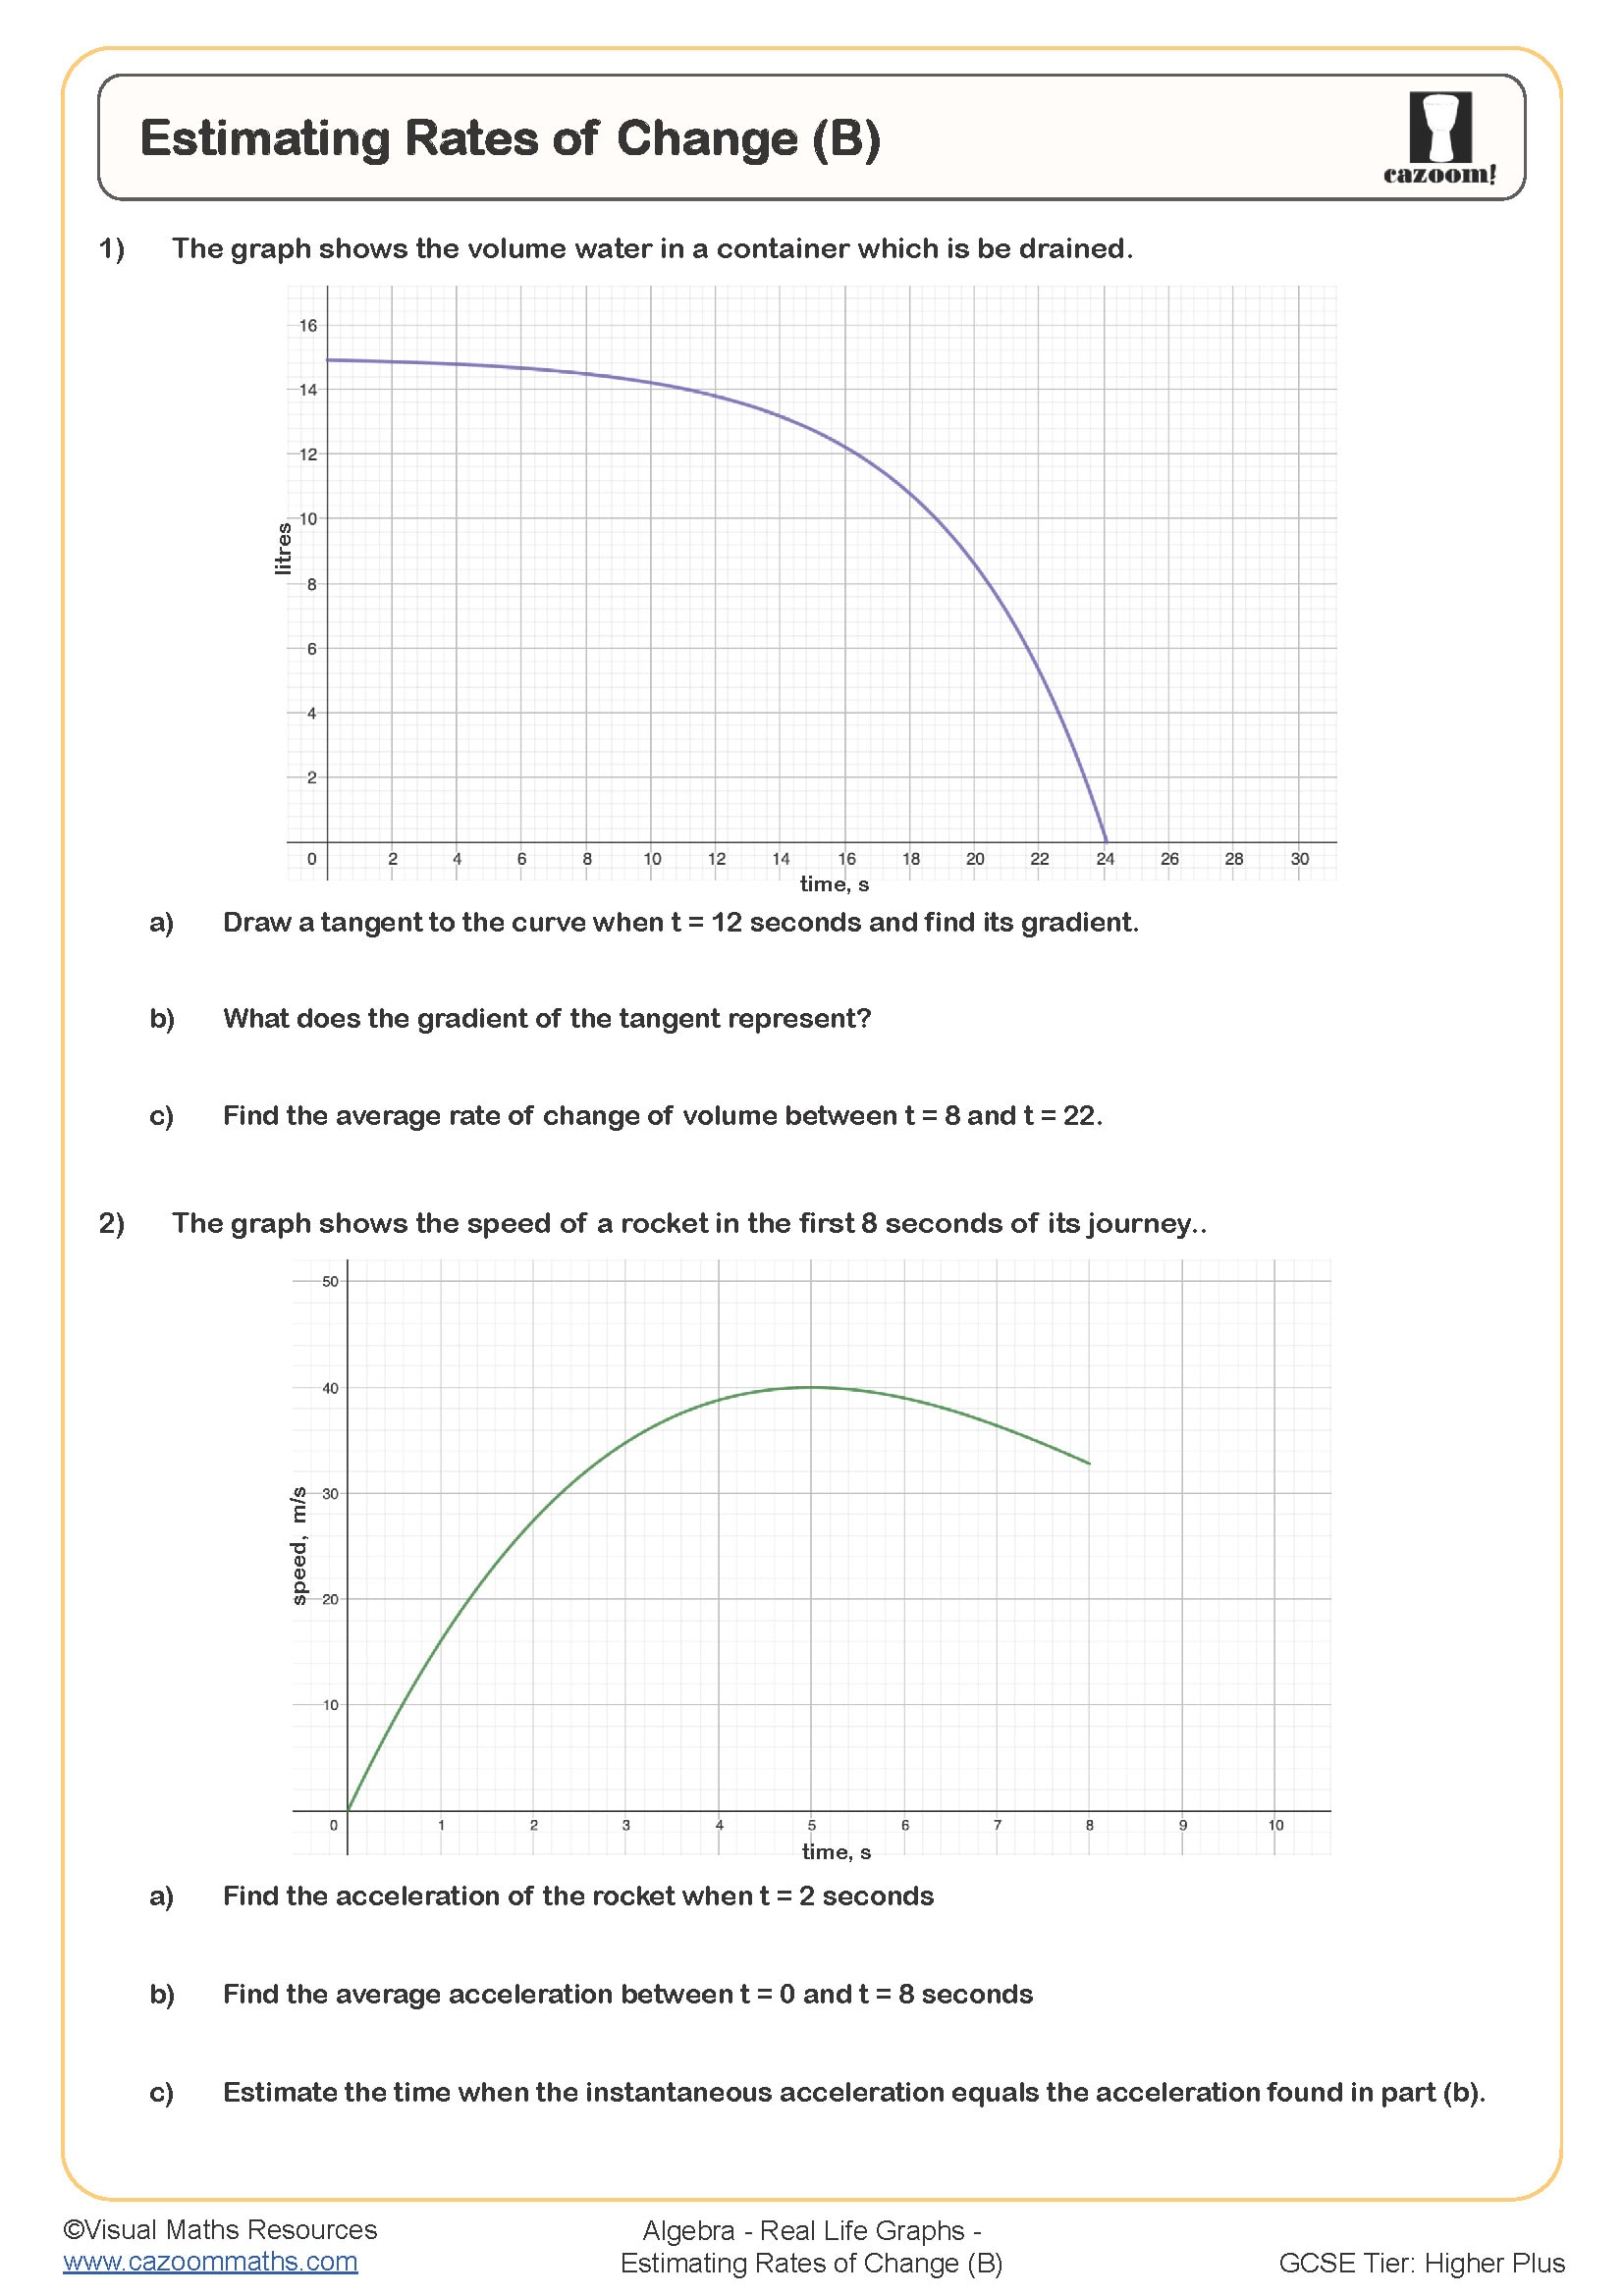
Estimating Rates of Change (B)
Year groups: 10, 11
All worksheets are created by the team of experienced teachers at Cazoom Maths.
What skills do real life graphs worksheets develop?
A real life graphs worksheet develops students' ability to interpret graphical information in context, extract specific data points, and understand the relationship between variables over time. These worksheets align with the KS3 and KS4 algebra curriculum requirements for handling data and interpreting graphs, preparing students for GCSE questions that frequently appear in Paper 2.
Teachers notice that students often misread scales or confuse correlation with causation when analysing real-world data. Structured practice helps students recognise that a steep gradient indicates rapid change, whilst plateau sections show periods of no change, building the analytical skills needed for science and geography subjects.
Which year groups benefit from real life graphs practice?
Students from Year 7 through Year 11 benefit from real life graphs practice, with complexity increasing as students progress through Key Stages 3 and 4. Year 7 and 8 students typically start with simple distance-time graphs and temperature charts, whilst Year 9 students tackle more complex scenarios involving rates of change and multiple variables.
At GCSE level, students must confidently interpret graphs showing compound interest, population growth, and scientific experiments. Teachers find that regular practice across all year groups builds familiarity with different graph types, ensuring students can quickly identify what type of real-world situation each graph represents during examinations.
How do distance-time graphs appear in real life contexts?
Distance-time graphs in real life contexts include journey planning, sports analysis, and delivery tracking scenarios that students can relate to their daily experiences. These graphs help students understand concepts like average speed, stopping periods, and return journeys through familiar situations such as walking to school or family car trips.
Many students initially struggle with interpreting horizontal line segments as stationary periods rather than zero distance. Teachers often use examples like bus stops or traffic lights to help students visualise why the line stays flat when time continues but distance remains constant, making abstract concepts more concrete.
How can teachers use these worksheets most effectively in lessons?
Teachers achieve best results when they introduce real life graphs worksheets after students have mastered basic coordinate plotting and understand how to read simple line graphs. Starting with guided practice using one graph as a whole-class activity helps students understand the thought process before attempting independent work.
Effective teachers often pair students for peer discussion, encouraging them to explain their reasoning when interpreting trends or extracting data points. The answer sheets allow for immediate feedback, whilst teachers can identify common errors quickly and address misconceptions before they become embedded, particularly around understanding what different gradient steepnesses represent in real-world contexts.