Speed Time Graphs Worksheets
All worksheets are created by the team of experienced teachers at Cazoom Maths.
What is a speed time graph in maths?
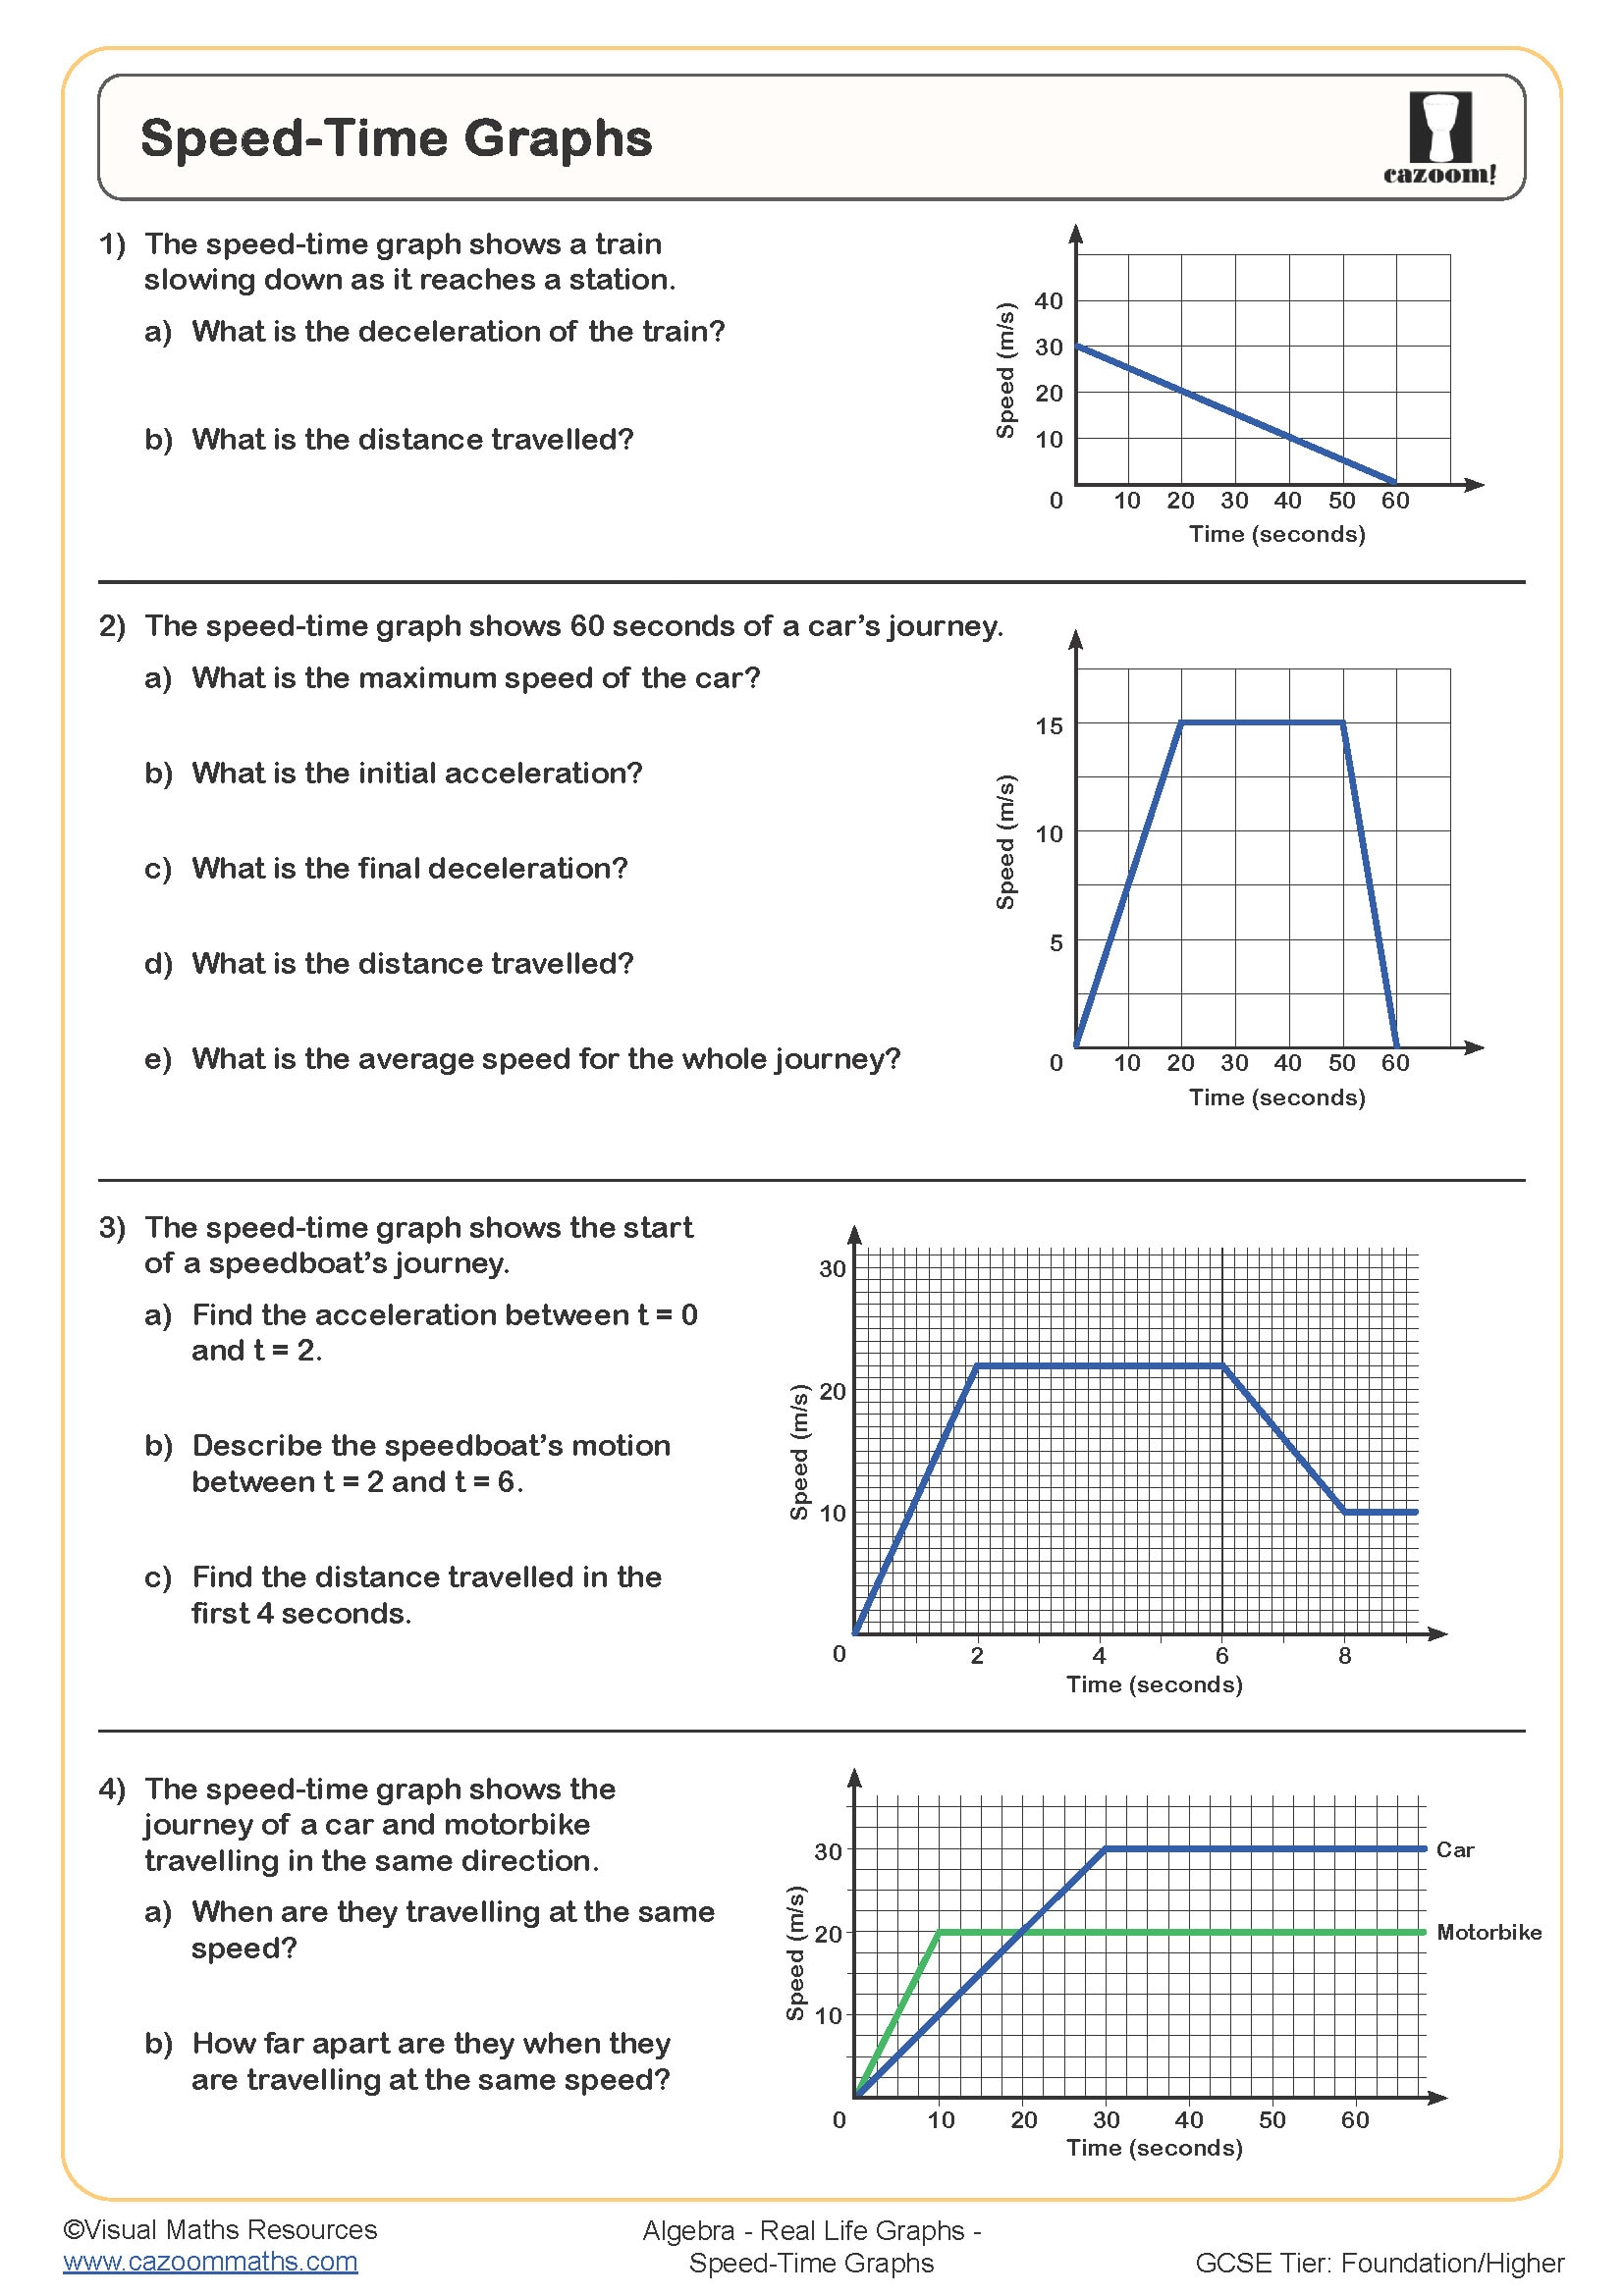
A speed time graph plots speed on the vertical axis against time on the horizontal axis, showing how an object's speed changes during motion. The gradient of the line represents acceleration (or deceleration if negative), whilst the area underneath the graph gives the total distance travelled. This appears in the KS3 and KS4 curriculum as part of interpreting real-life graphs and connects directly to ratio and proportion work.
Students often misread these graphs by treating them like distance time graphs, expecting the y-coordinate to show distance covered. Exam mark schemes regularly penalise candidates who read the speed value instead of calculating area when asked for distance. Teaching students to annotate which quantity each axis represents and explicitly label what gradient and area mean helps prevent this confusion, particularly in multi-step GCSE questions.
Which year groups study speed time graphs?
Speed time graphs appear in the curriculum for Year 9, Year 10, and Year 11 students, spanning upper KS3 into KS4. At Year 9, students typically begin with straightforward constant speed sections and simple acceleration, focusing on reading values from the graph. The topic builds towards GCSE level, where students must handle graphs with multiple sections, calculate acceleration, and find total distance travelled.
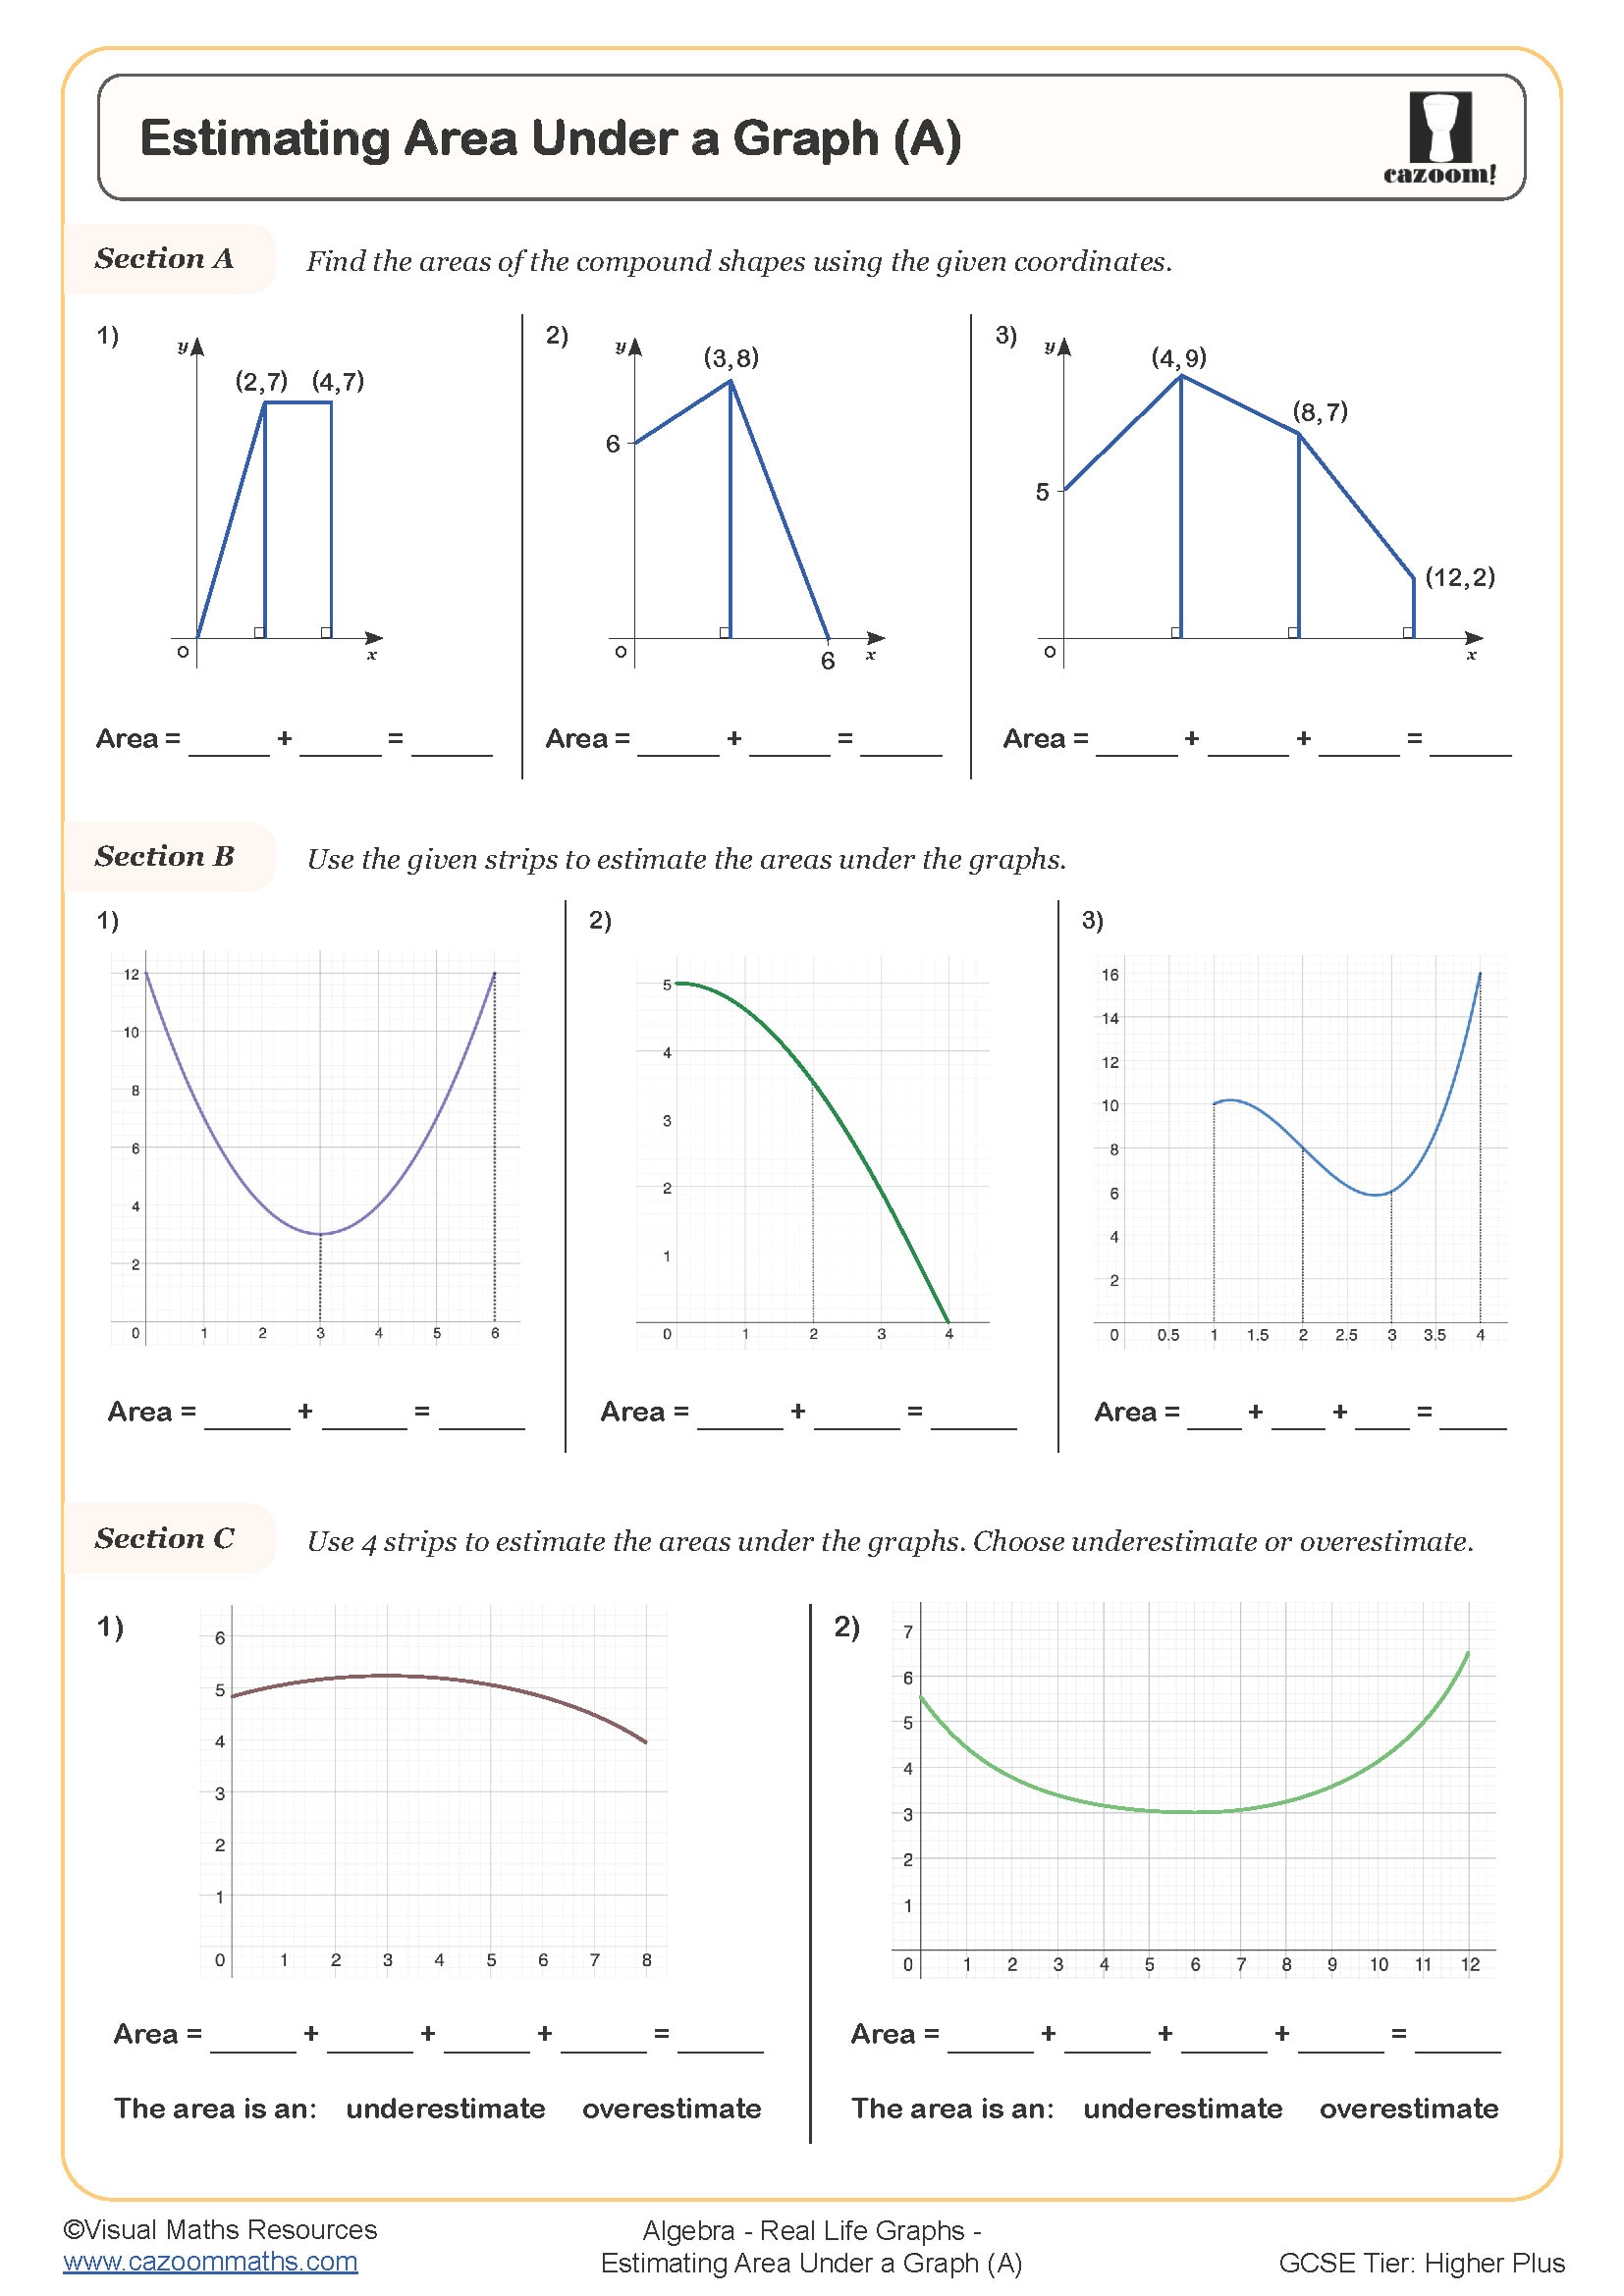
Progression across these year groups involves increasing complexity in the graph structures. Year 9 worksheets might feature single trapezium shapes or simple triangular sections, whilst Year 10 and Year 11 materials include composite shapes requiring students to split the area into triangles and rectangles. Higher tier GCSE papers also expect algebraic working when exact values aren't marked, such as expressing distance in terms of an unknown speed or time period.
How do you calculate distance from a speed time graph?
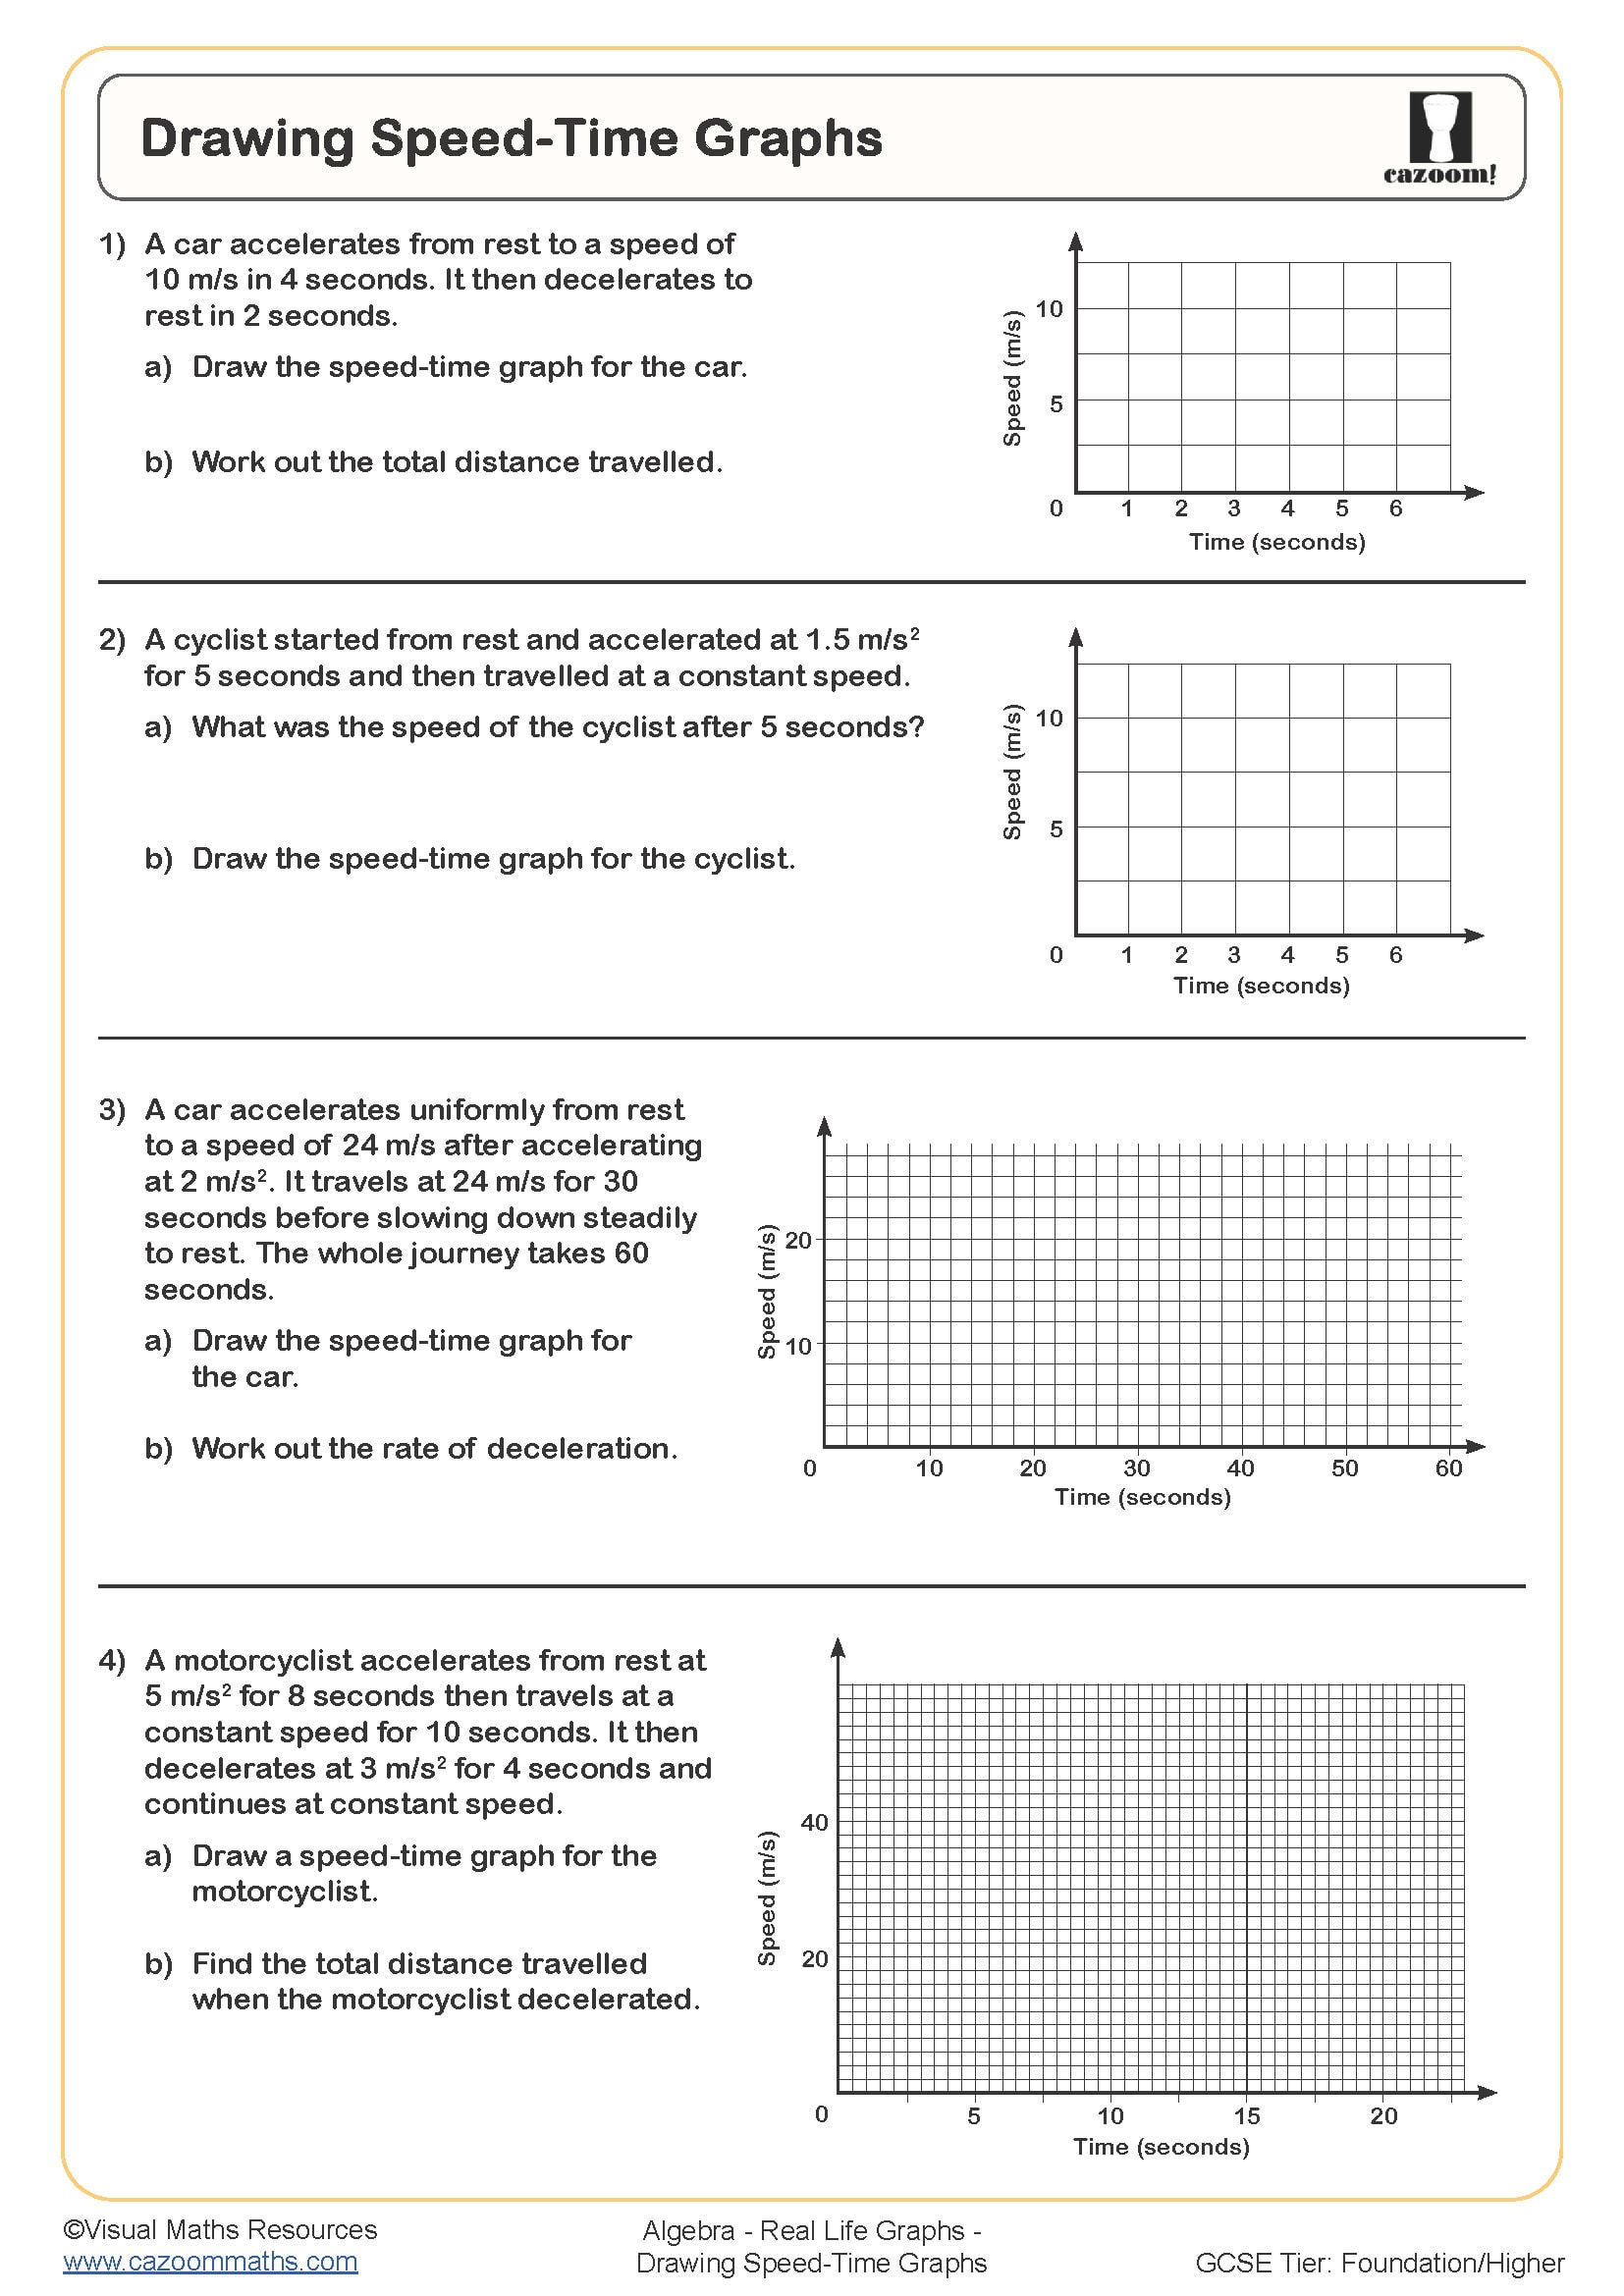
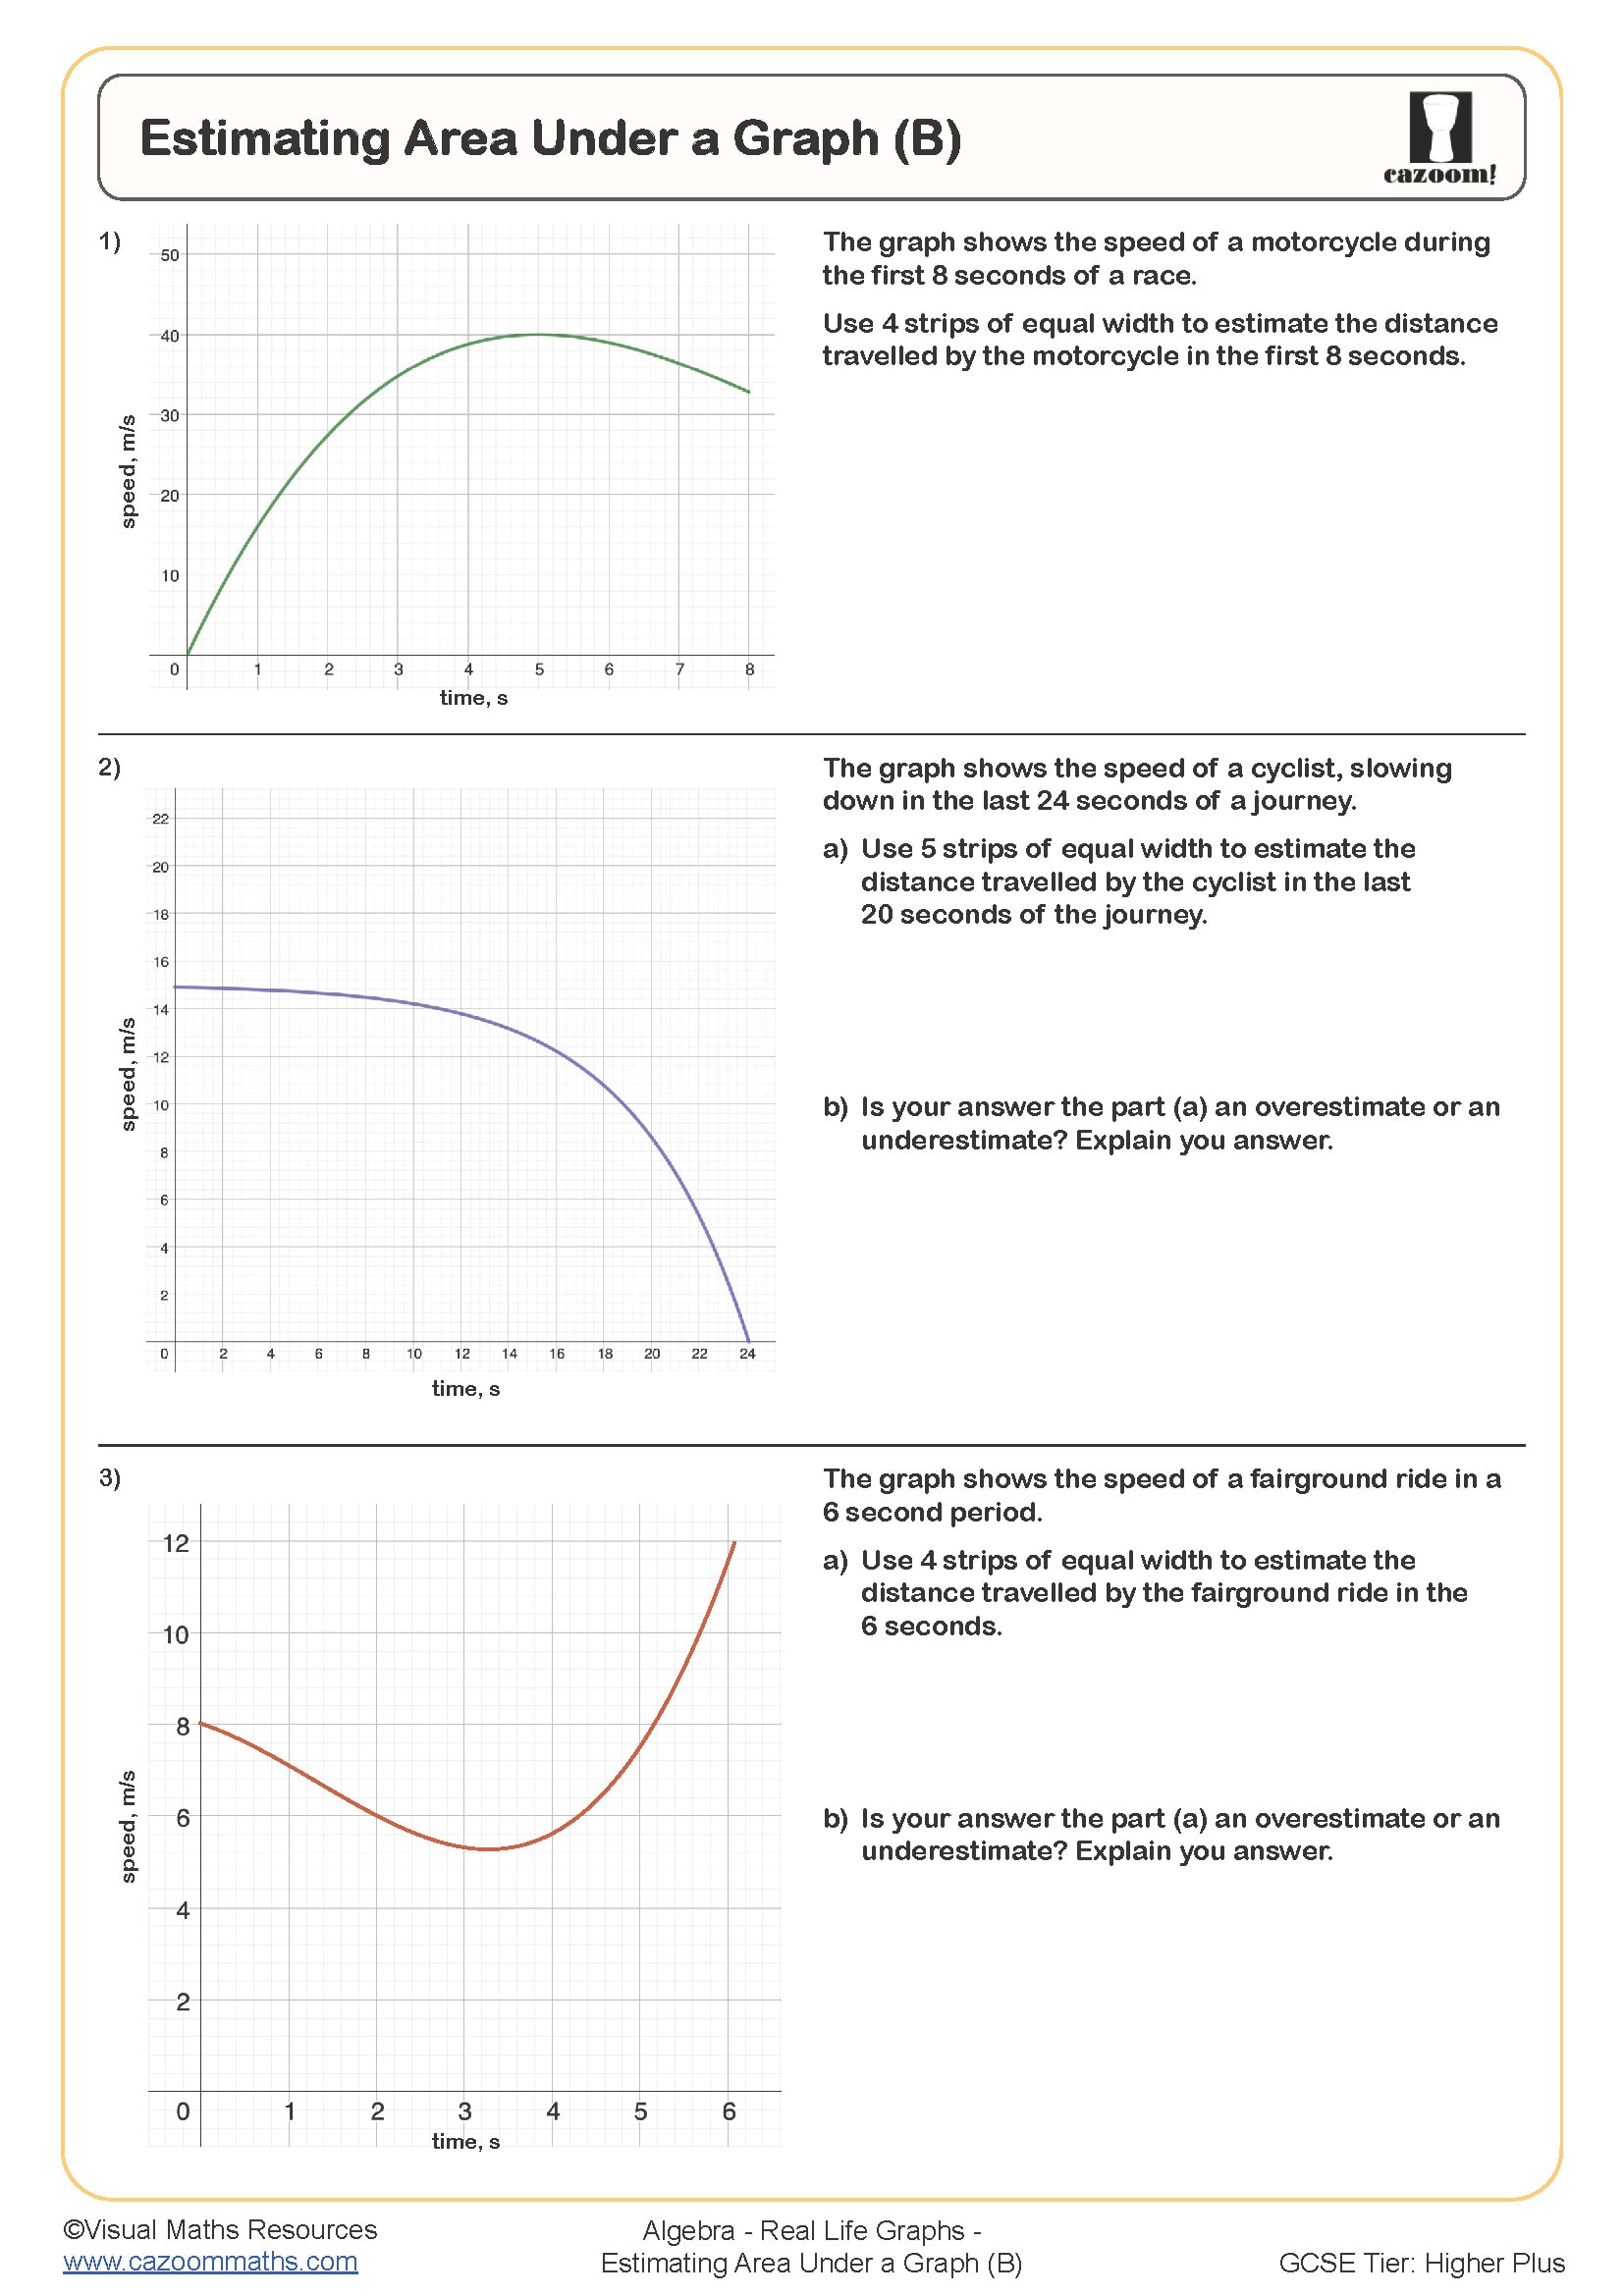
Distance travelled is found by calculating the area between the graph line and the horizontal time axis. For rectangular sections (constant speed), this means multiplying speed by time. For triangular sections (uniform acceleration from rest or to rest), students use ½ × base × height. Composite graphs require splitting the shape into manageable sections, calculating each area separately, then totalling them for overall distance.
This skill has direct applications in transport planning and sports science. Traffic engineers use speed time data to design safer road layouts by analysing braking distances and acceleration zones. Athletes and coaches examine speed time graphs from sprint analysis to identify where acceleration phases begin and end, optimising training programmes. Understanding that area represents accumulated distance helps students grasp why motorway slip roads need specific lengths and why sprint coaches focus on the first few seconds of a race, where the steepest gradient on the graph indicates maximum acceleration.
How can these speed time graphs worksheets help students?
The worksheets build skills progressively, starting with reading coordinates and identifying what different sections of the graph represent before moving to calculations. Many include worked examples showing how to split complex shapes systematically and how to set out area calculations clearly, which helps students who struggle with deciding where to start. Answer sheets allow students to identify exactly which step of a multi-part calculation went wrong, rather than just knowing the final answer is incorrect.
Teachers use these resources for targeted intervention with students who find motion graphs challenging, particularly those who need repeated exposure to the area-equals-distance concept. The worksheets work well for homework after initial teaching, as revision materials before assessments, or for paired work where students can discuss their approaches to splitting irregular shapes. Some teachers set these during Physics lessons when motion calculations arise, reinforcing that the mathematics applies across STEM subjects and isn't confined to abstract exam questions.