Statistics and Probability GCSE Revision Worksheets
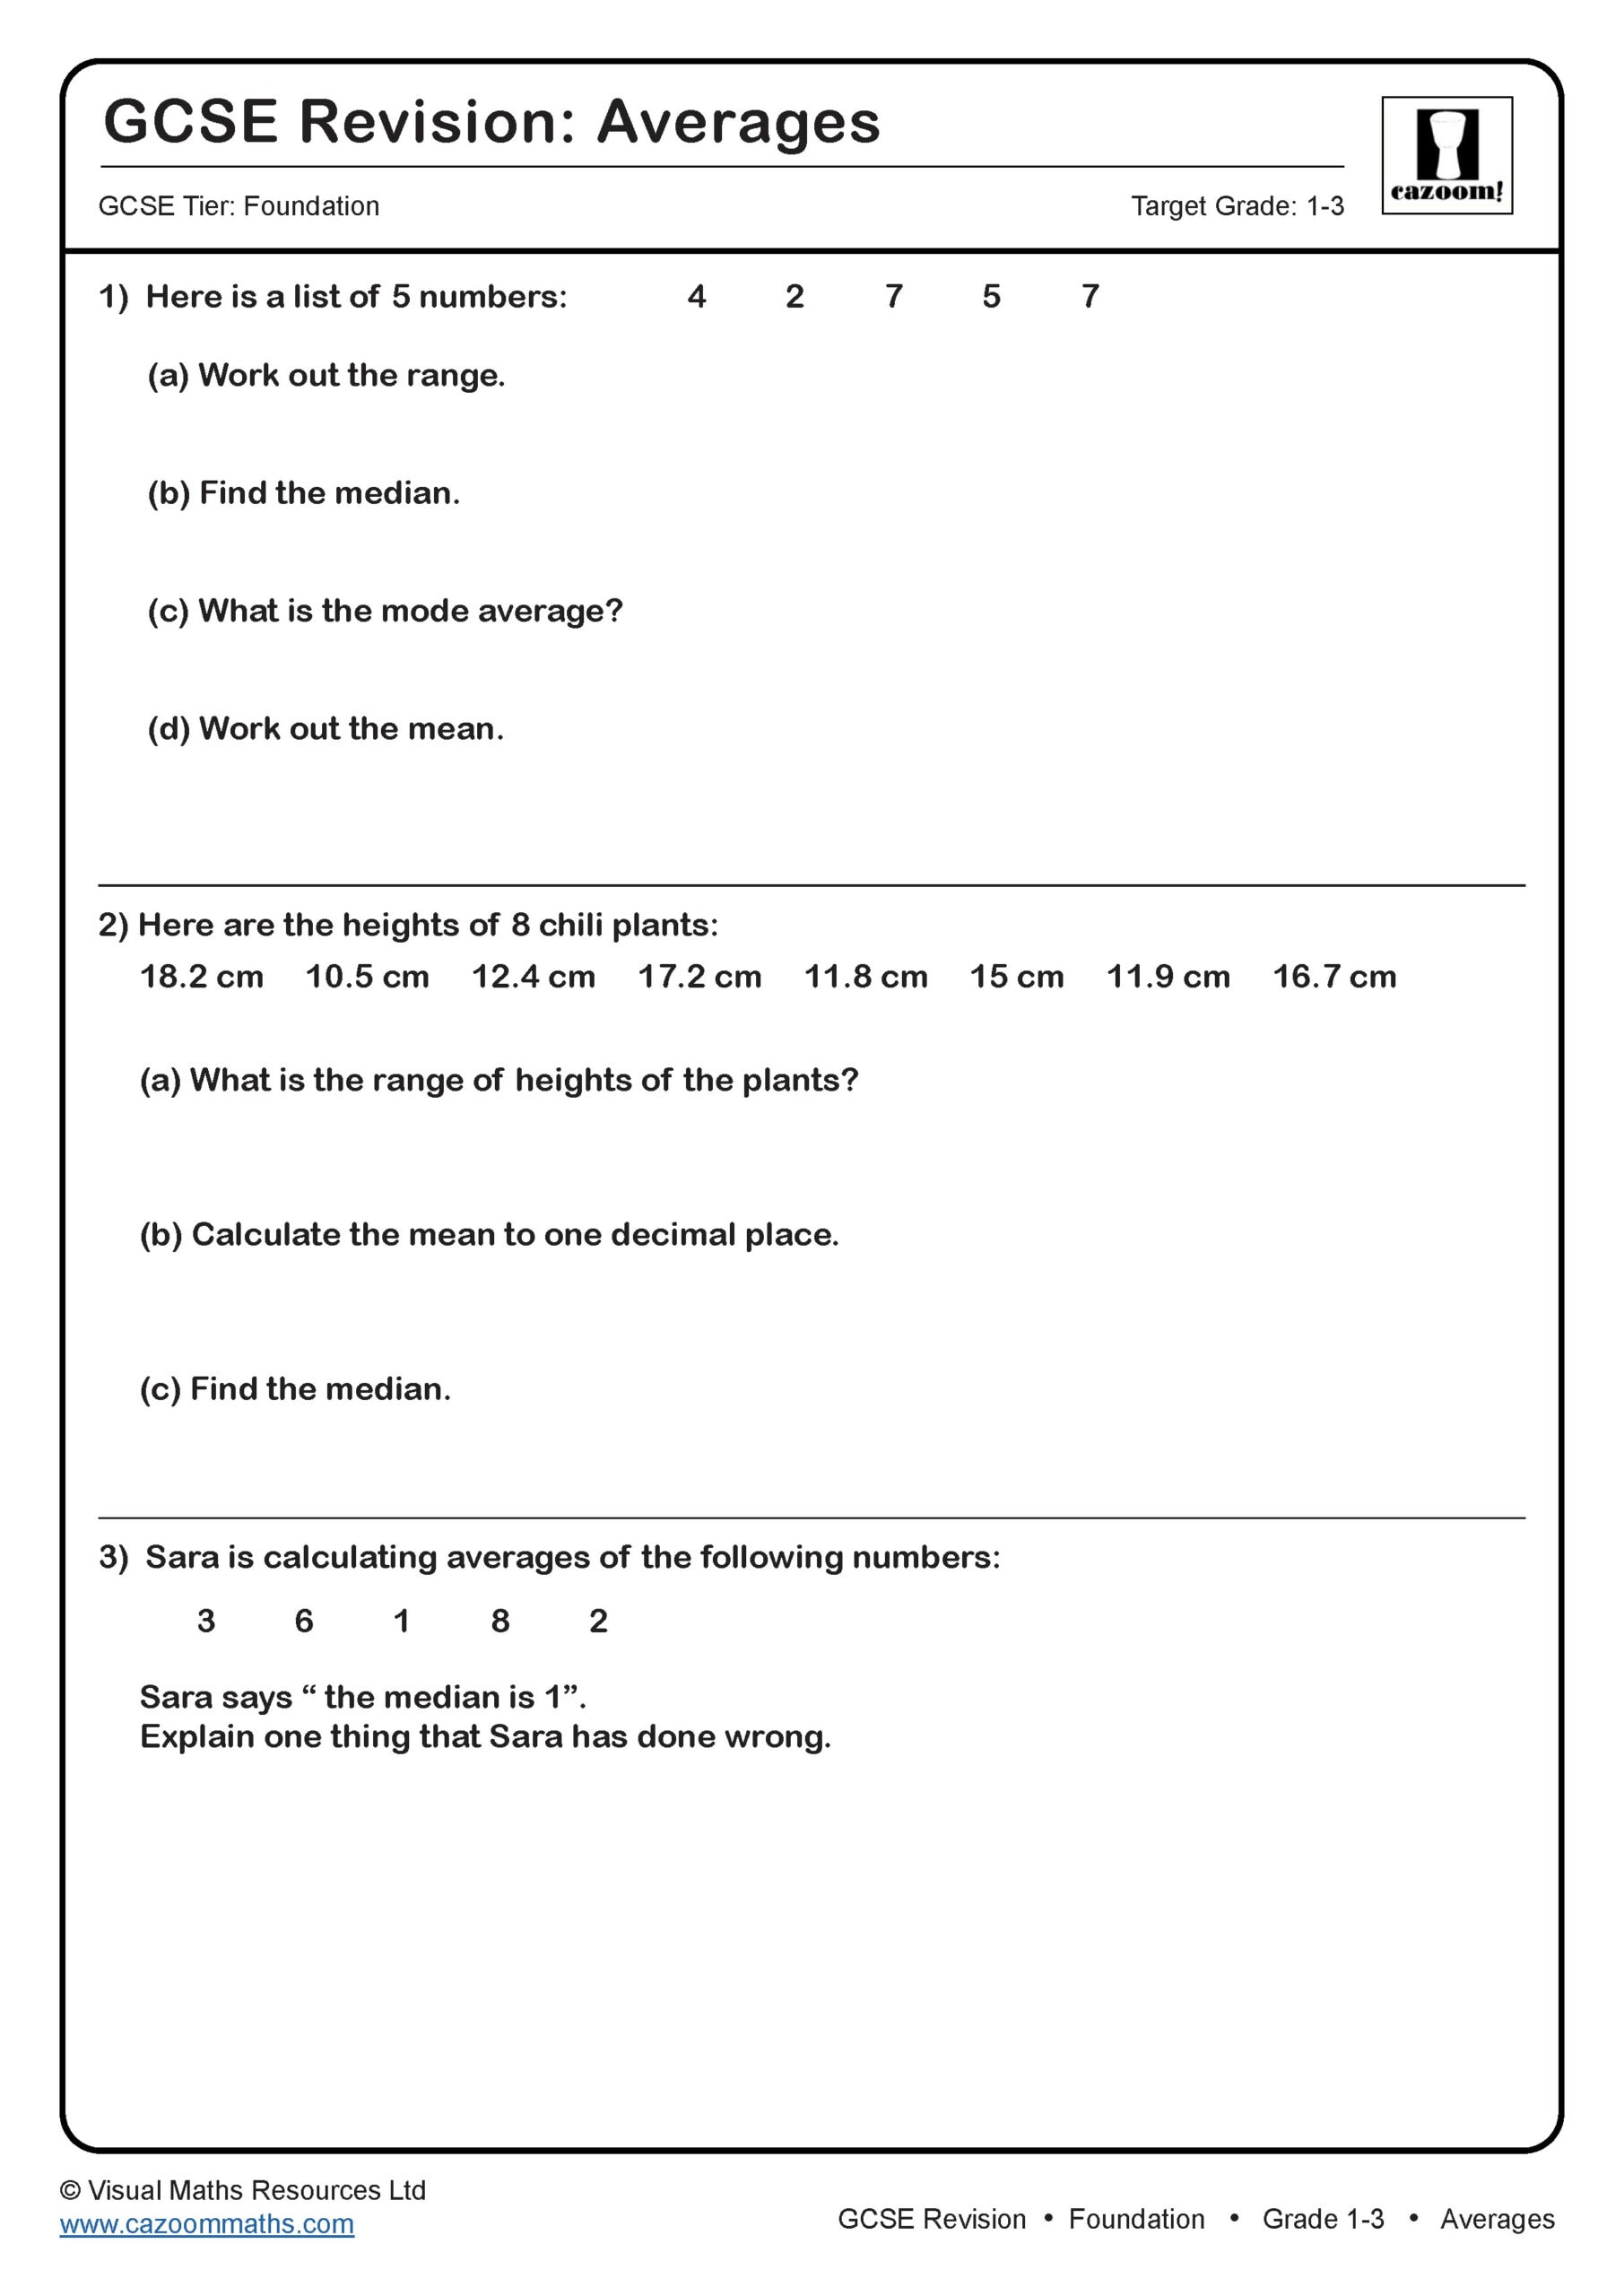
Averages
Target Grade: 1-3
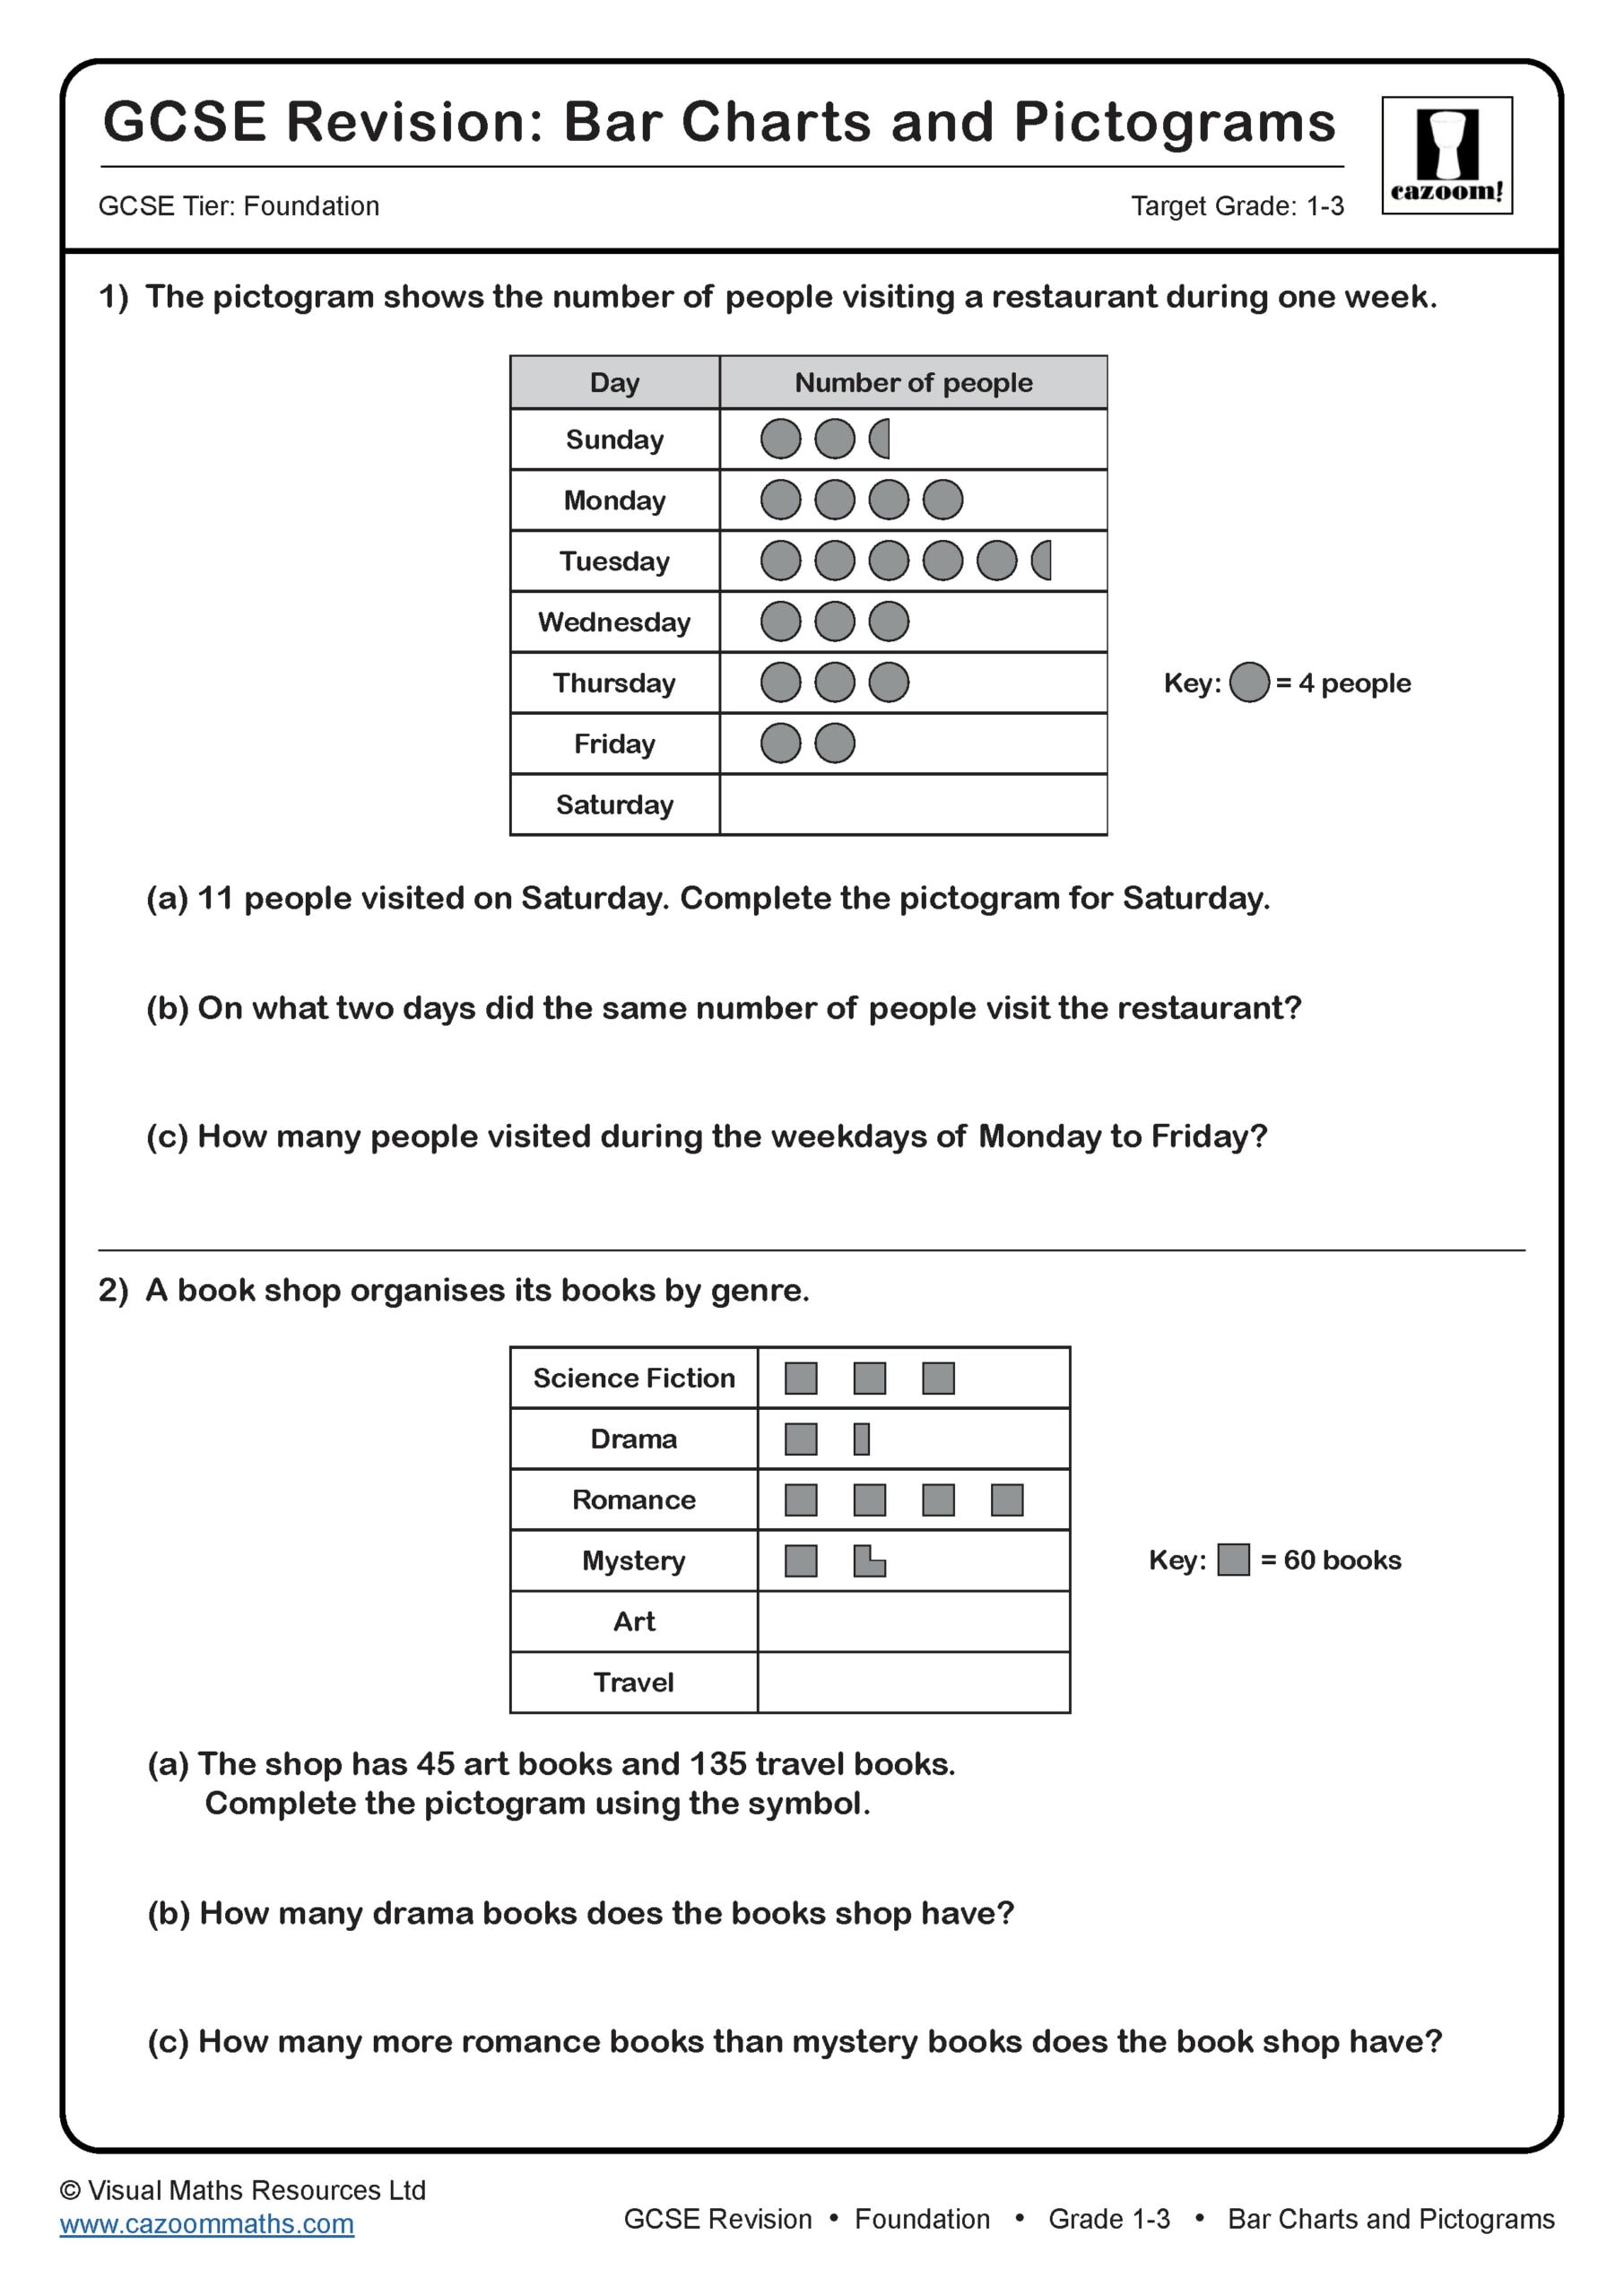
Bar Charts and Pictograms
Target Grade: 1-3
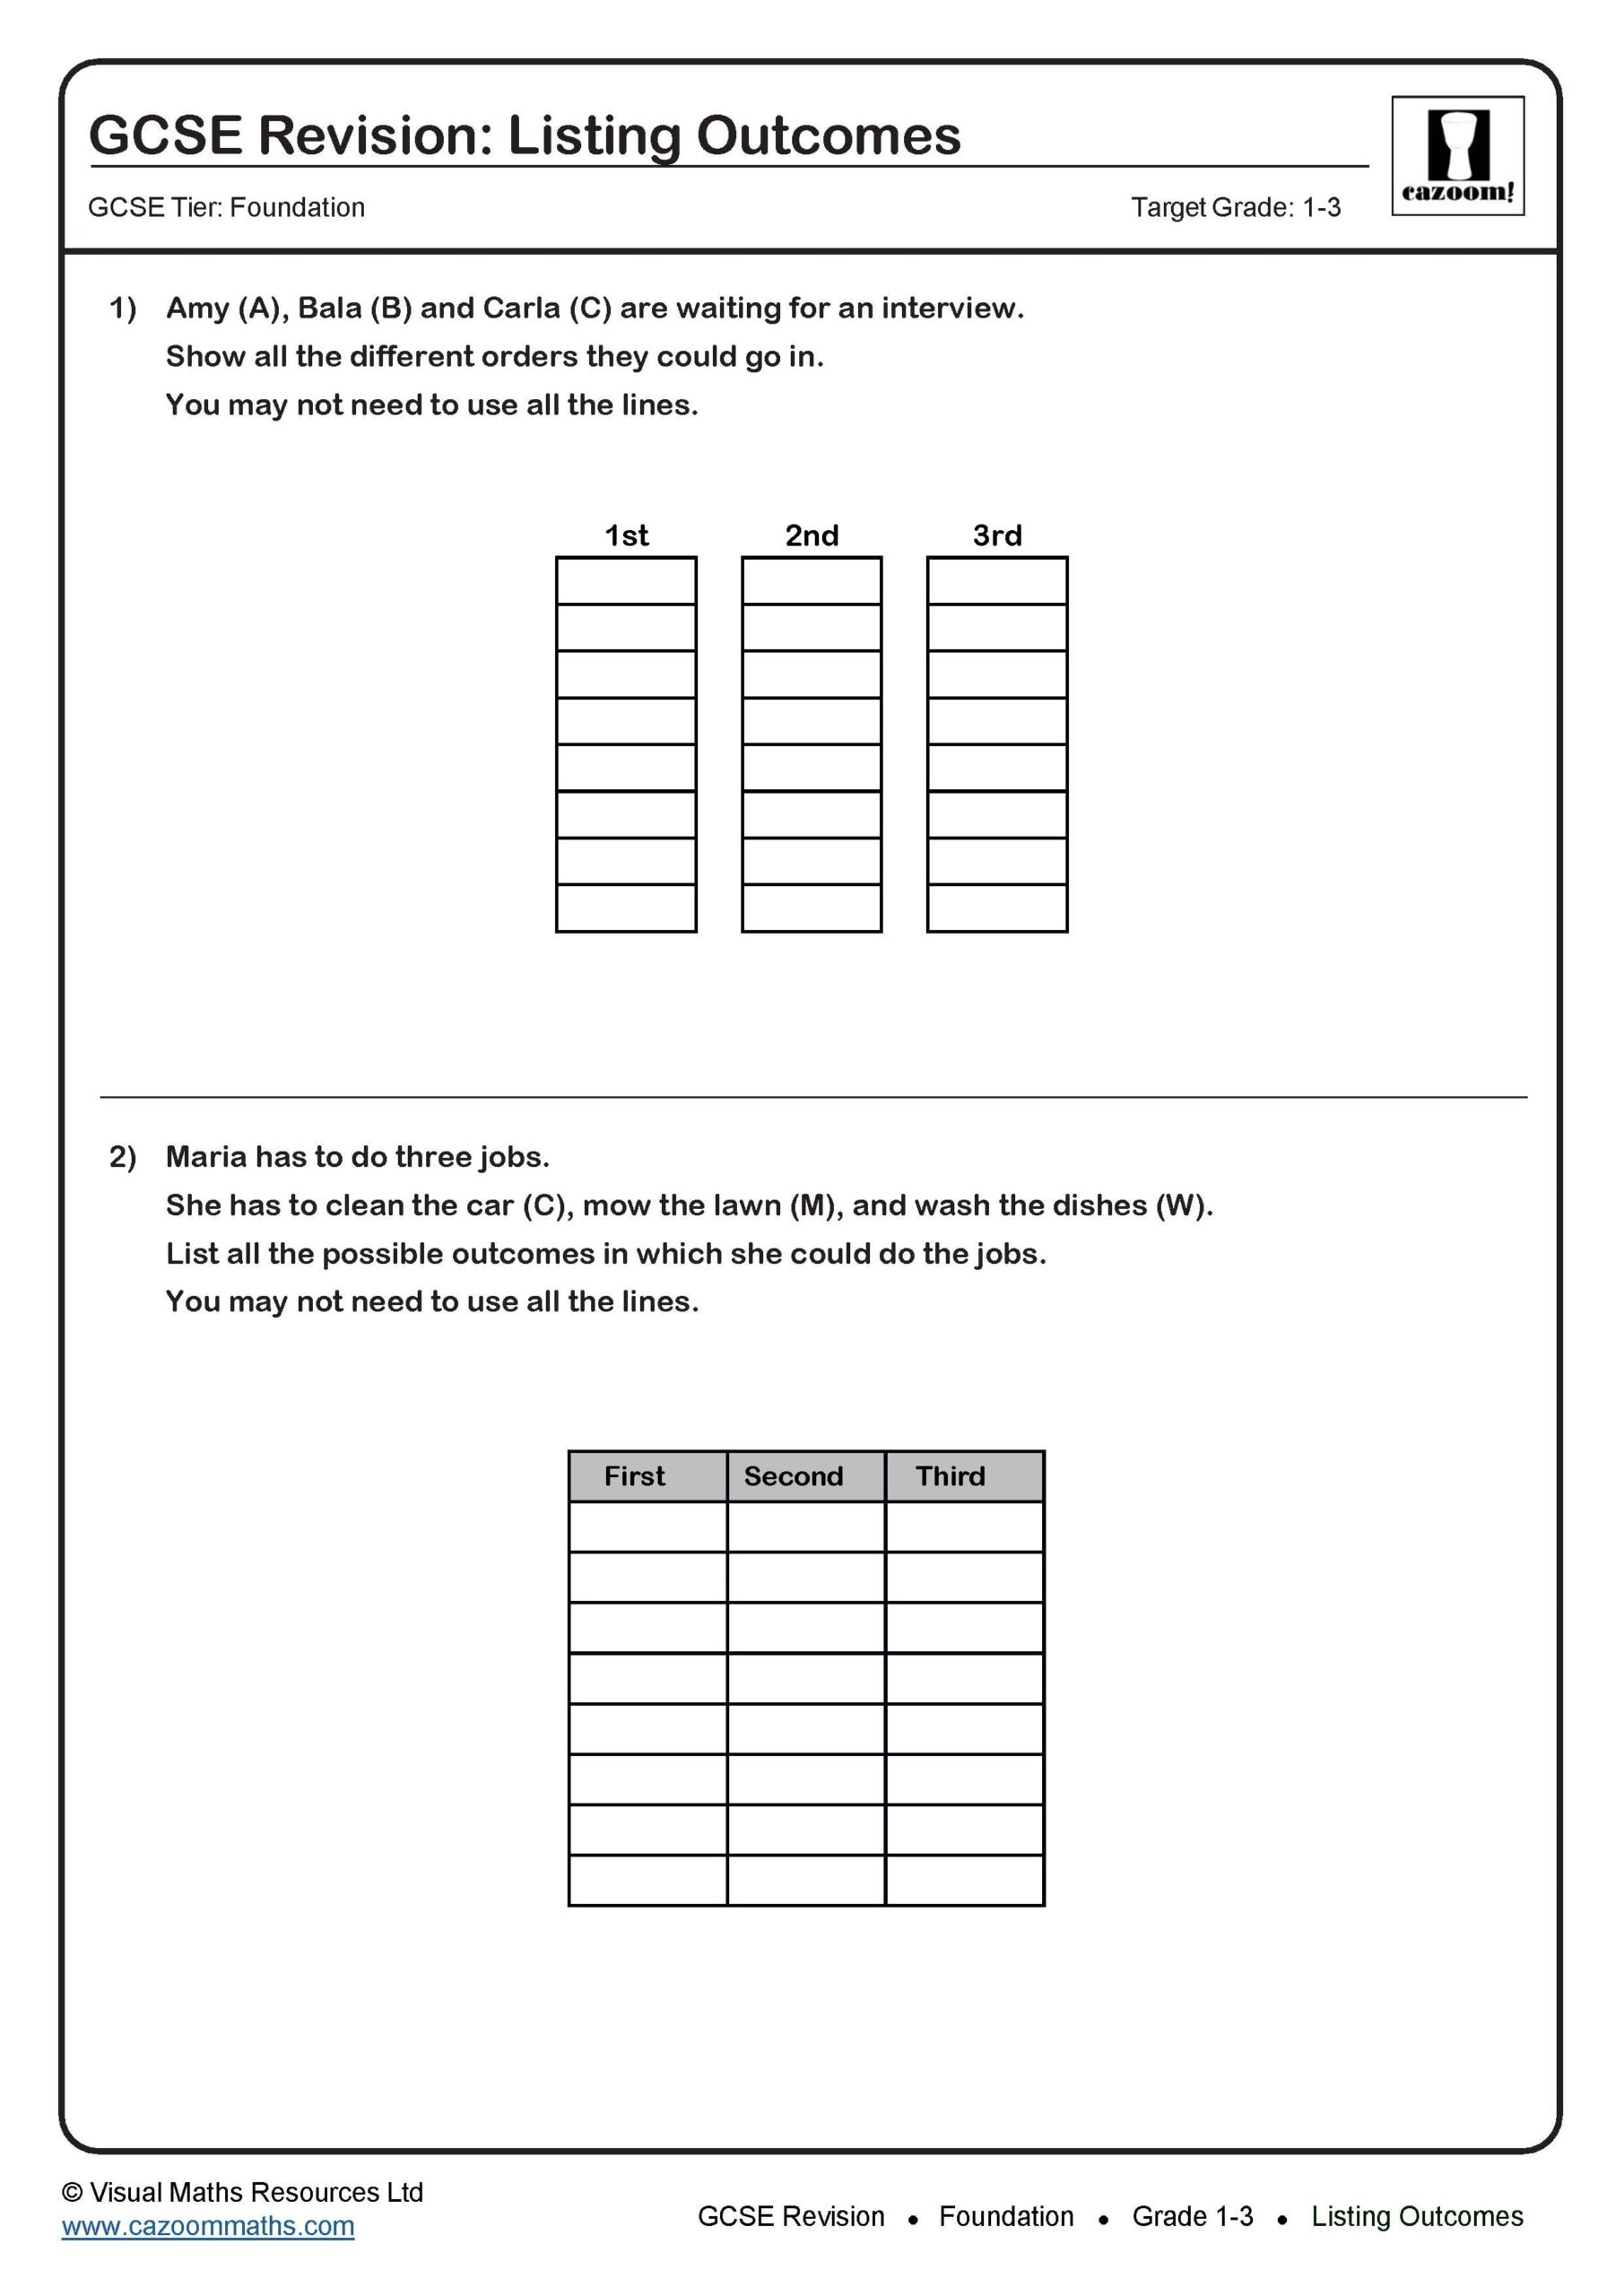
Listing Outcomes
Target Grade: 1-3
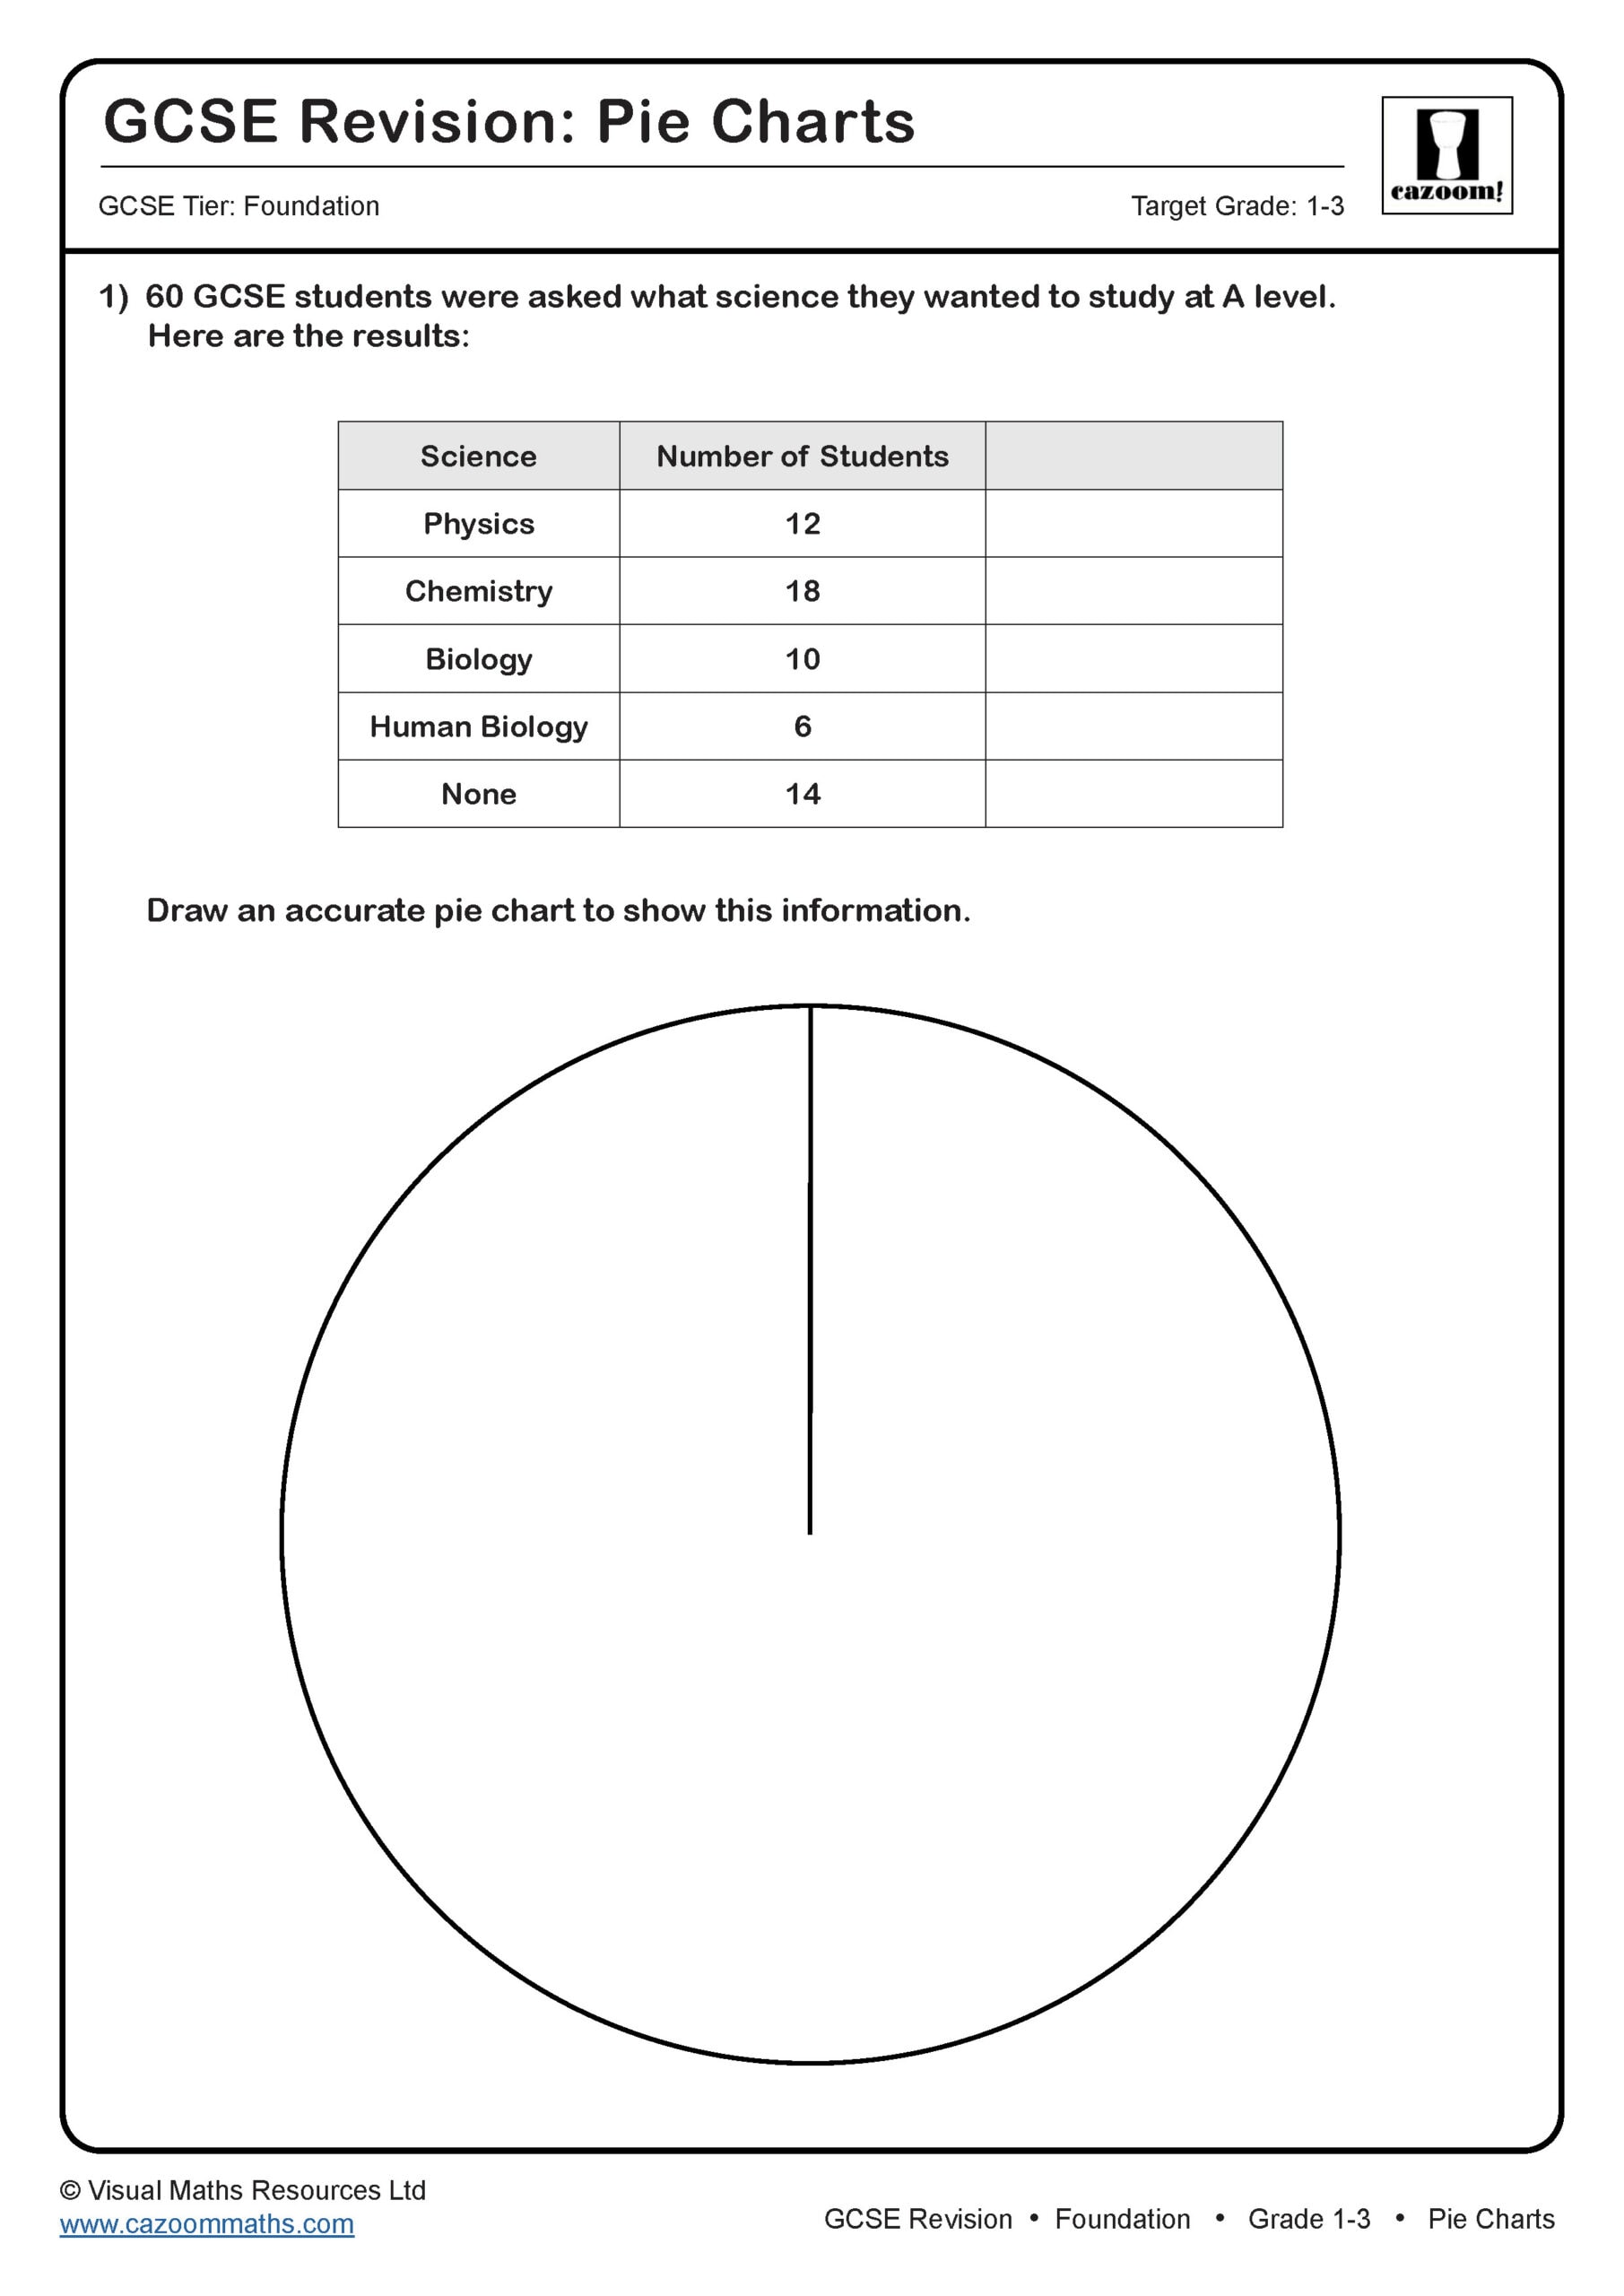
Pie Charts
Target Grade: 1-3
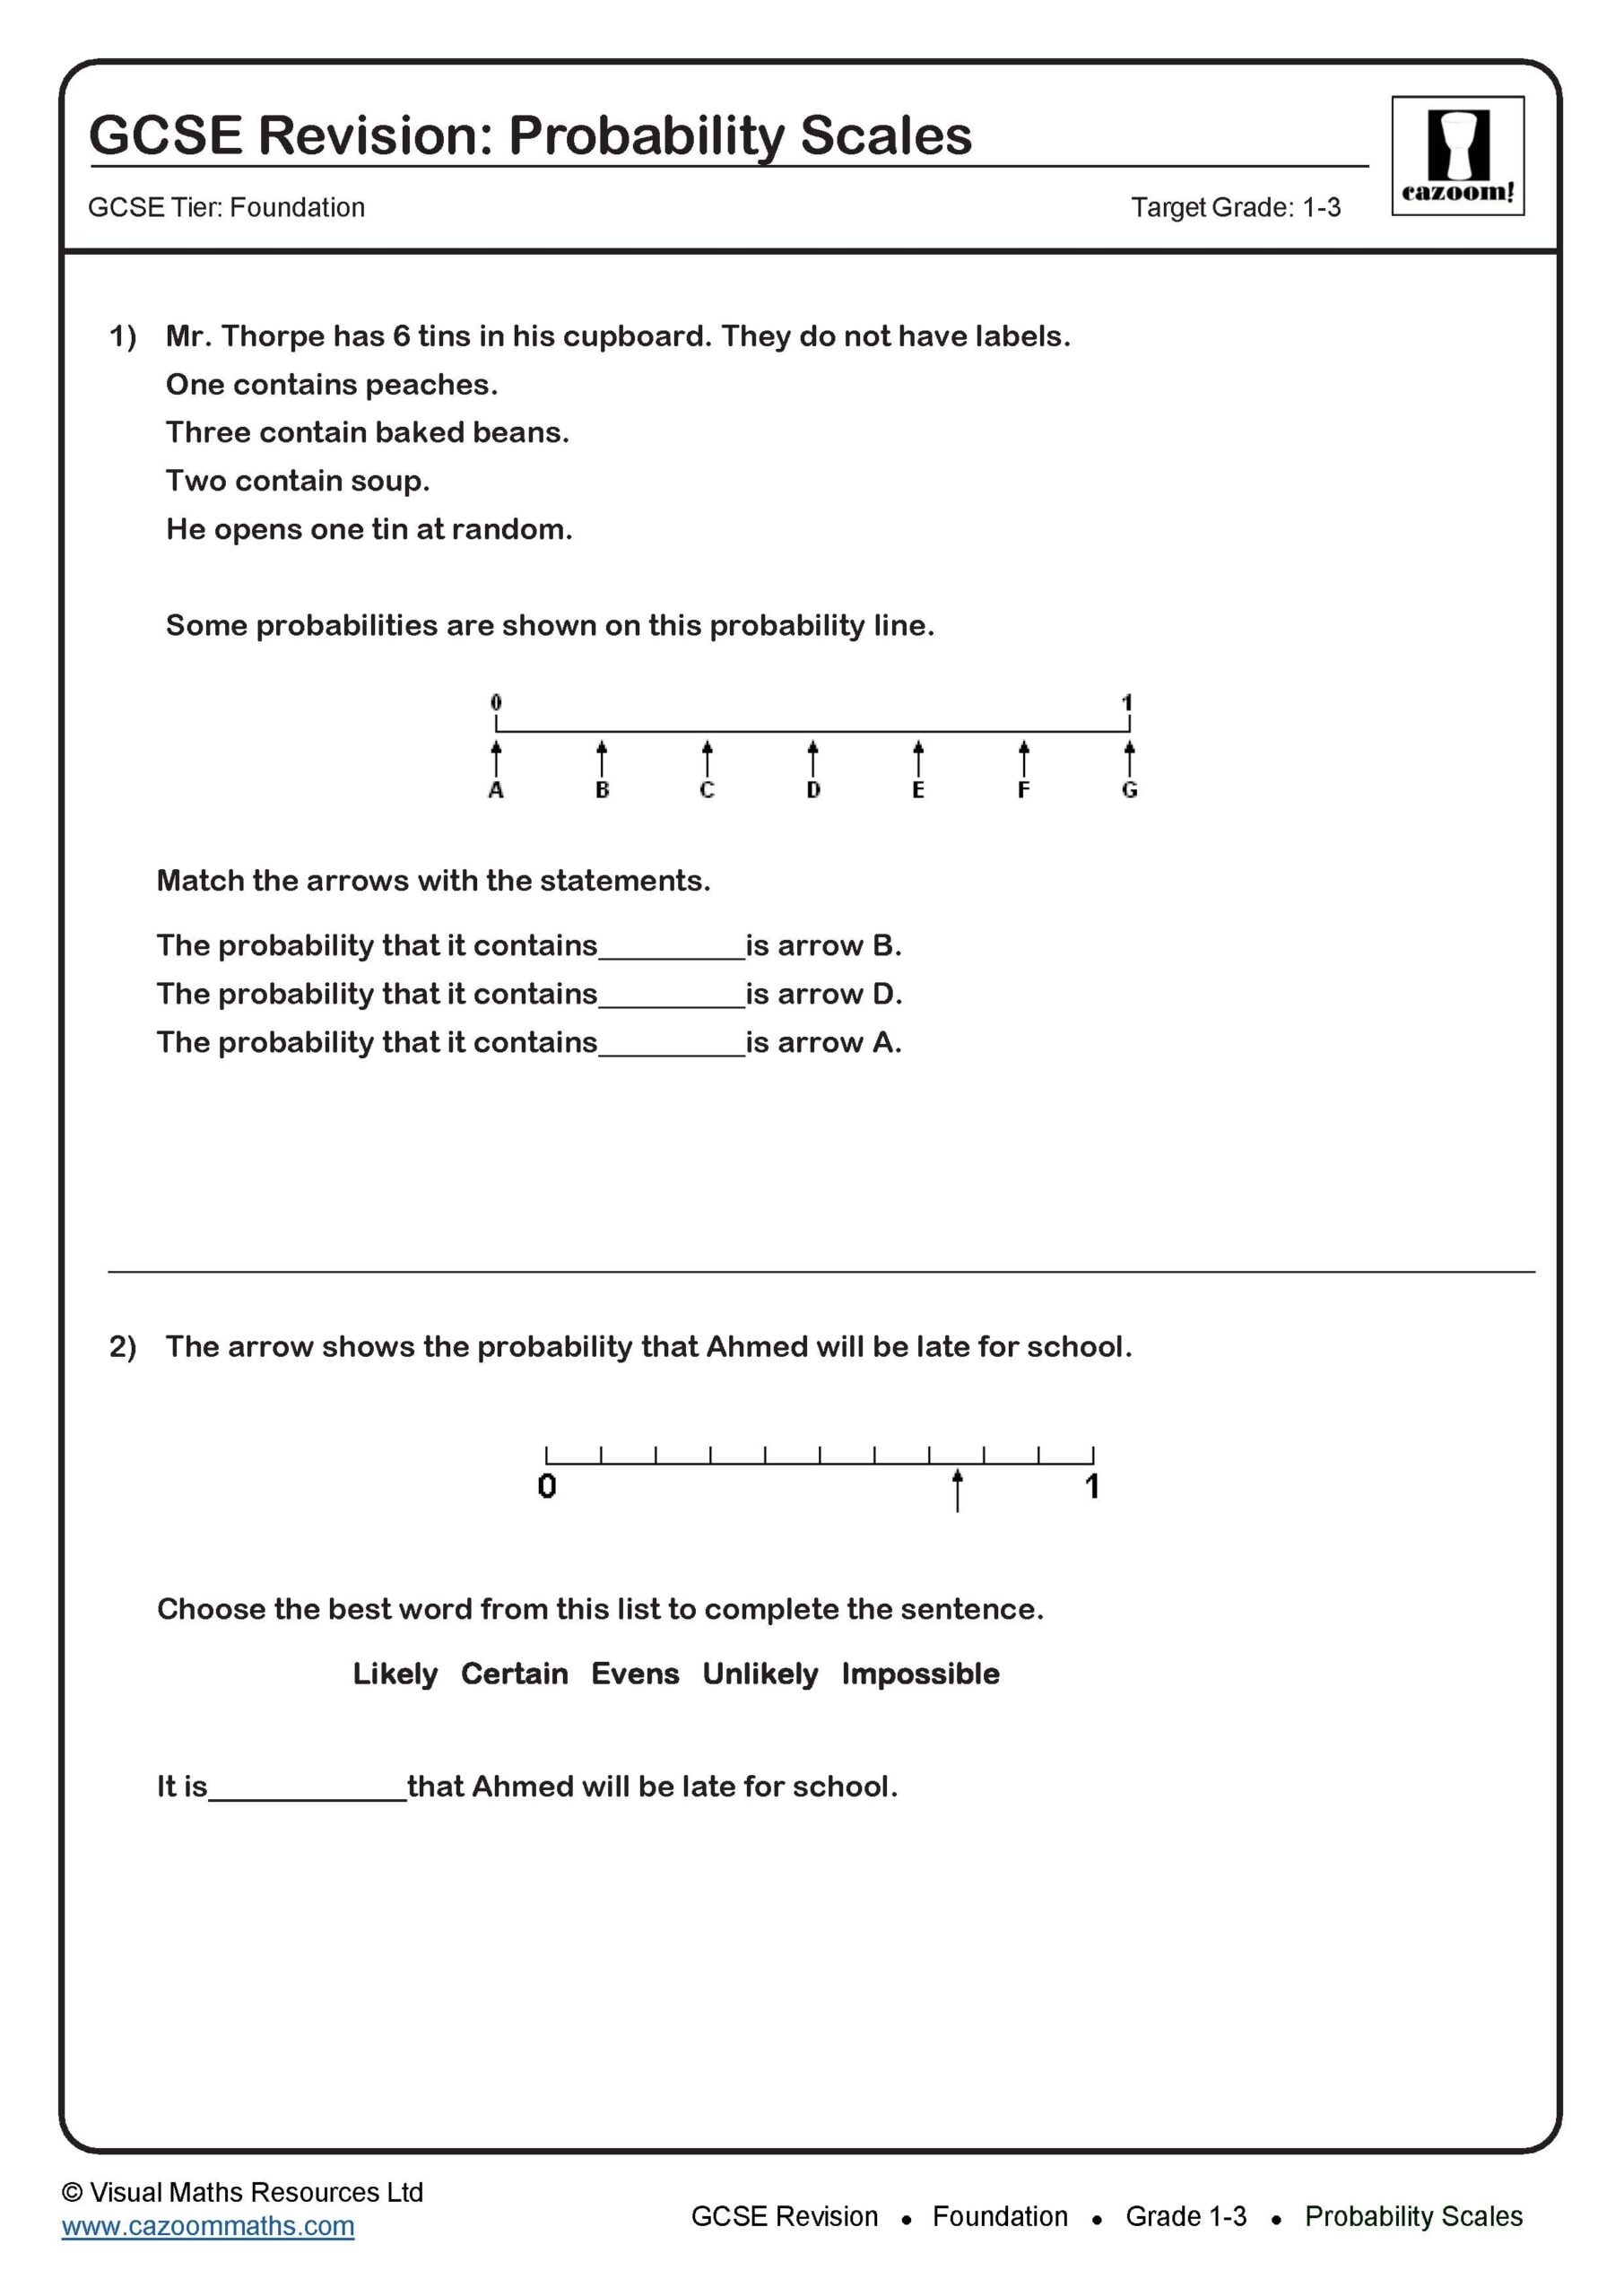
Probability Scales
Target Grade: 1-3
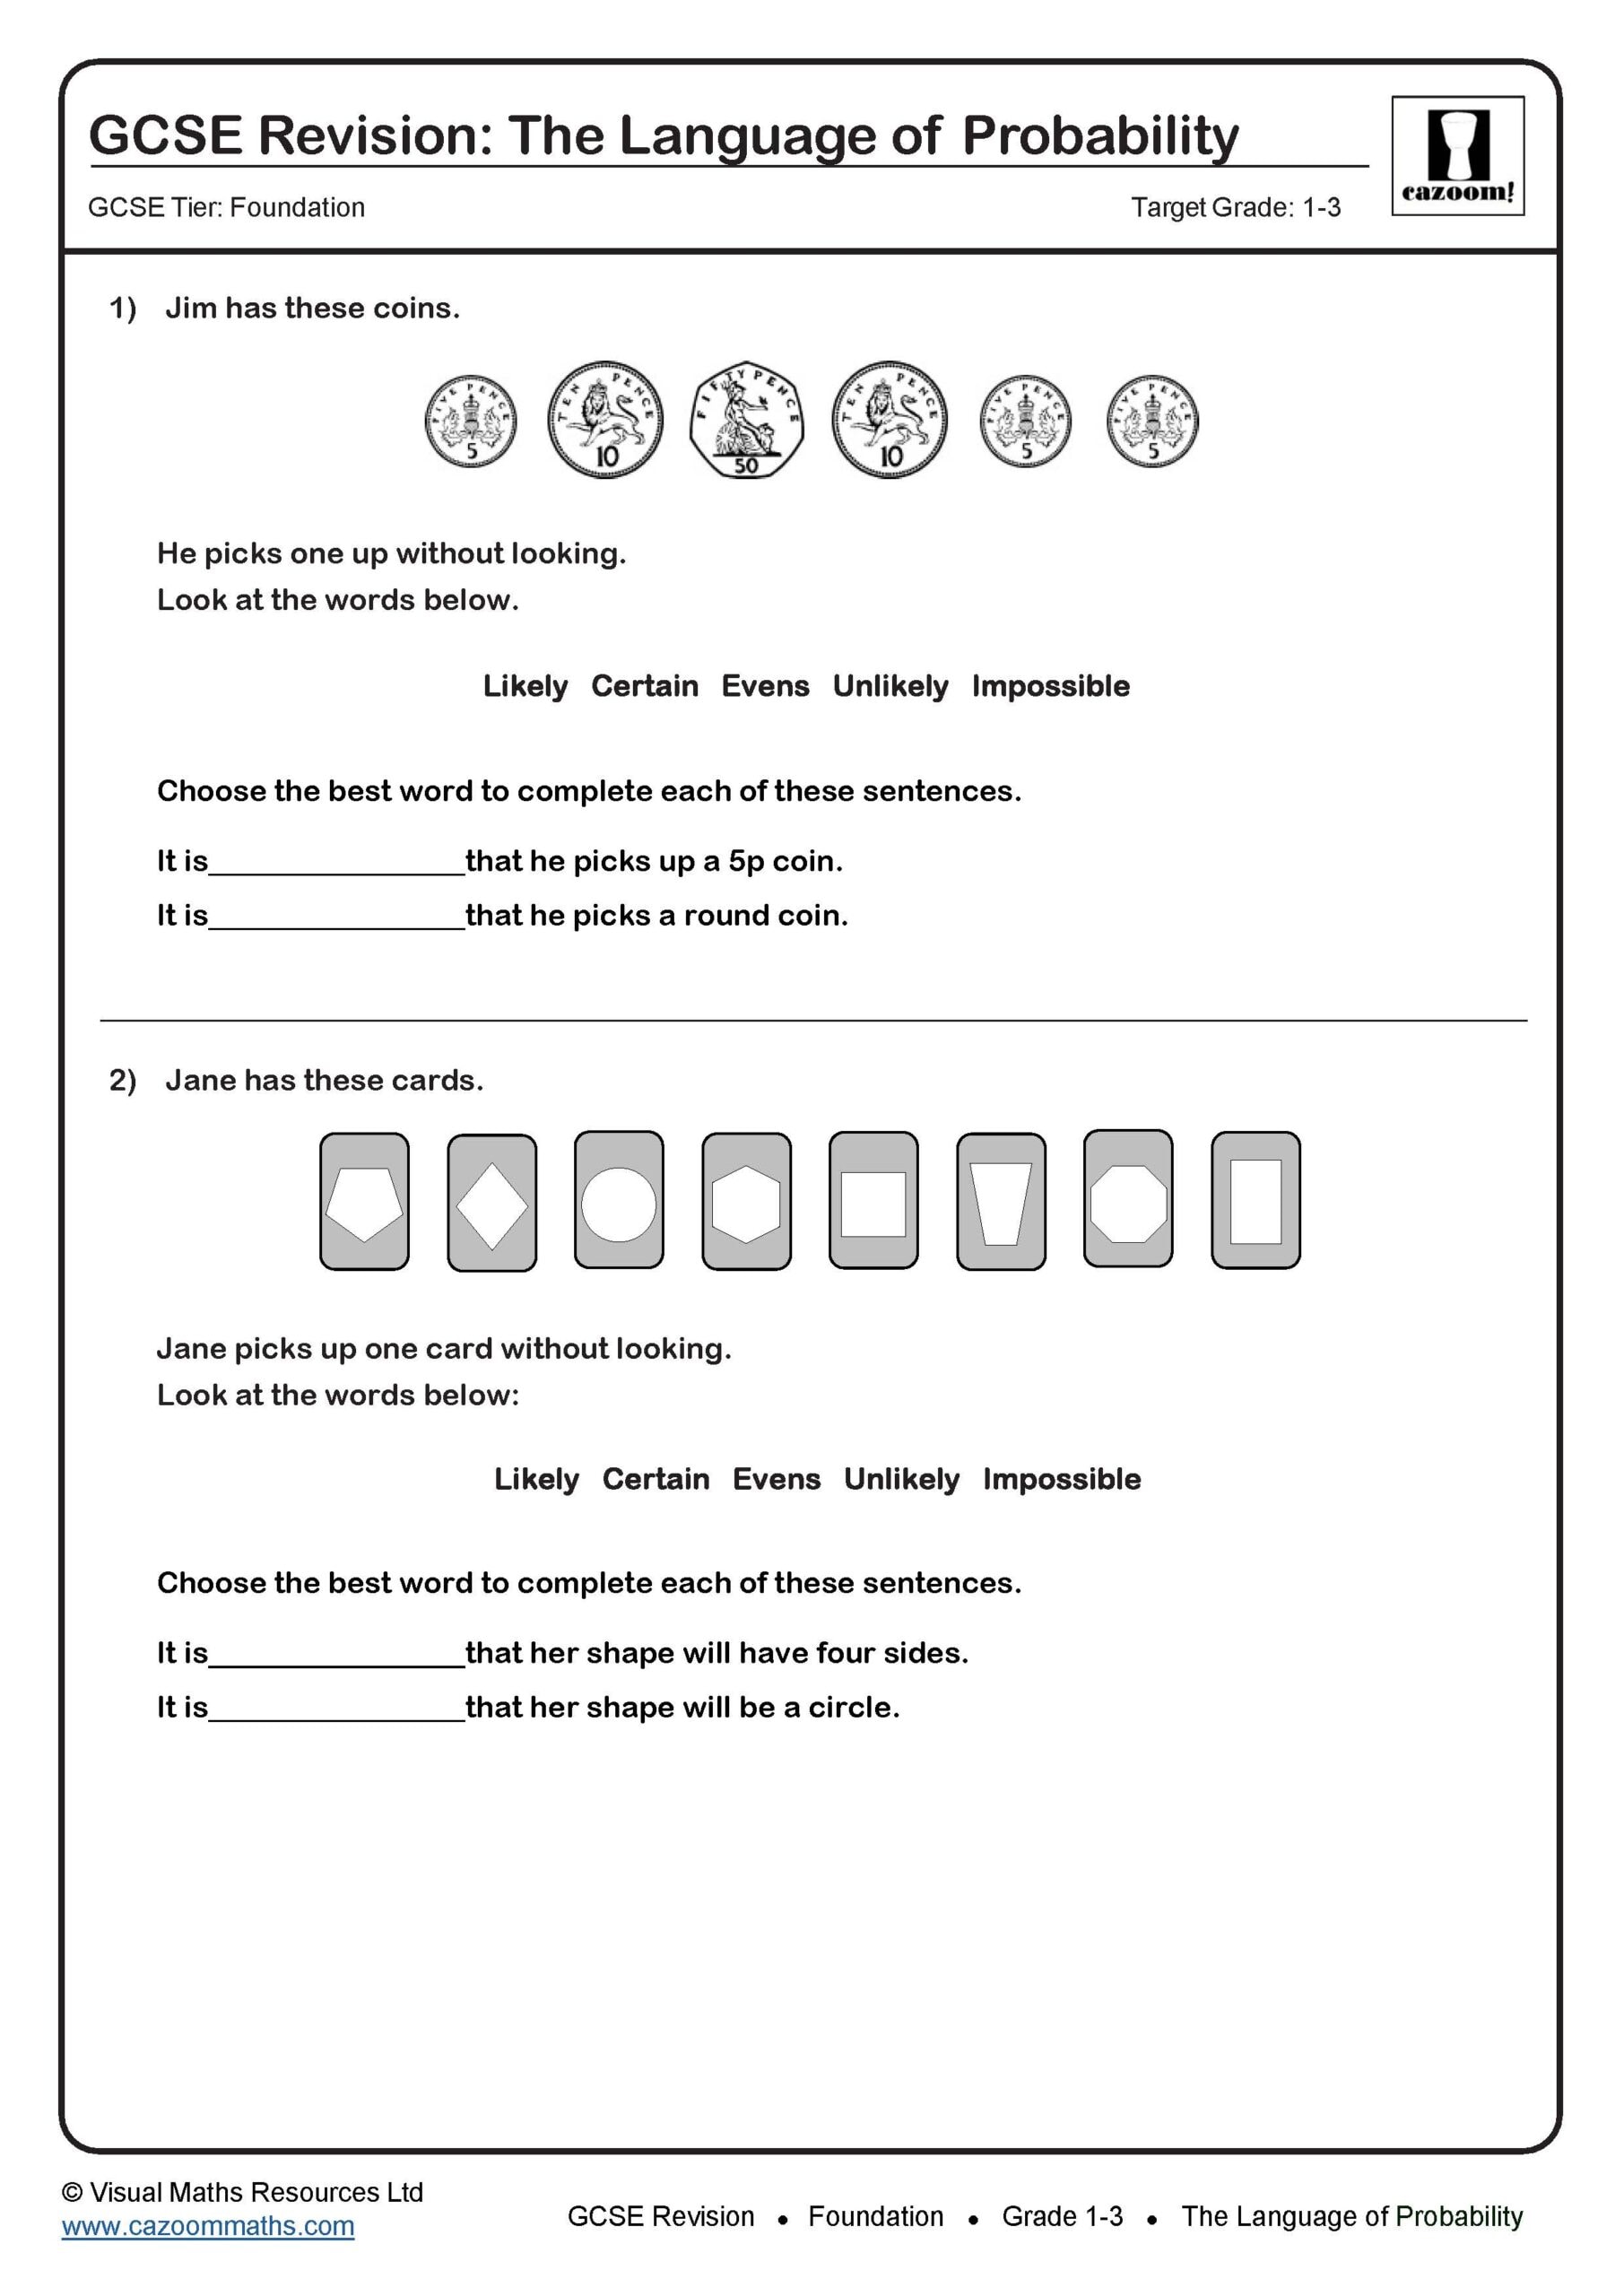
The Language of Probability
Target Grade: 1-3
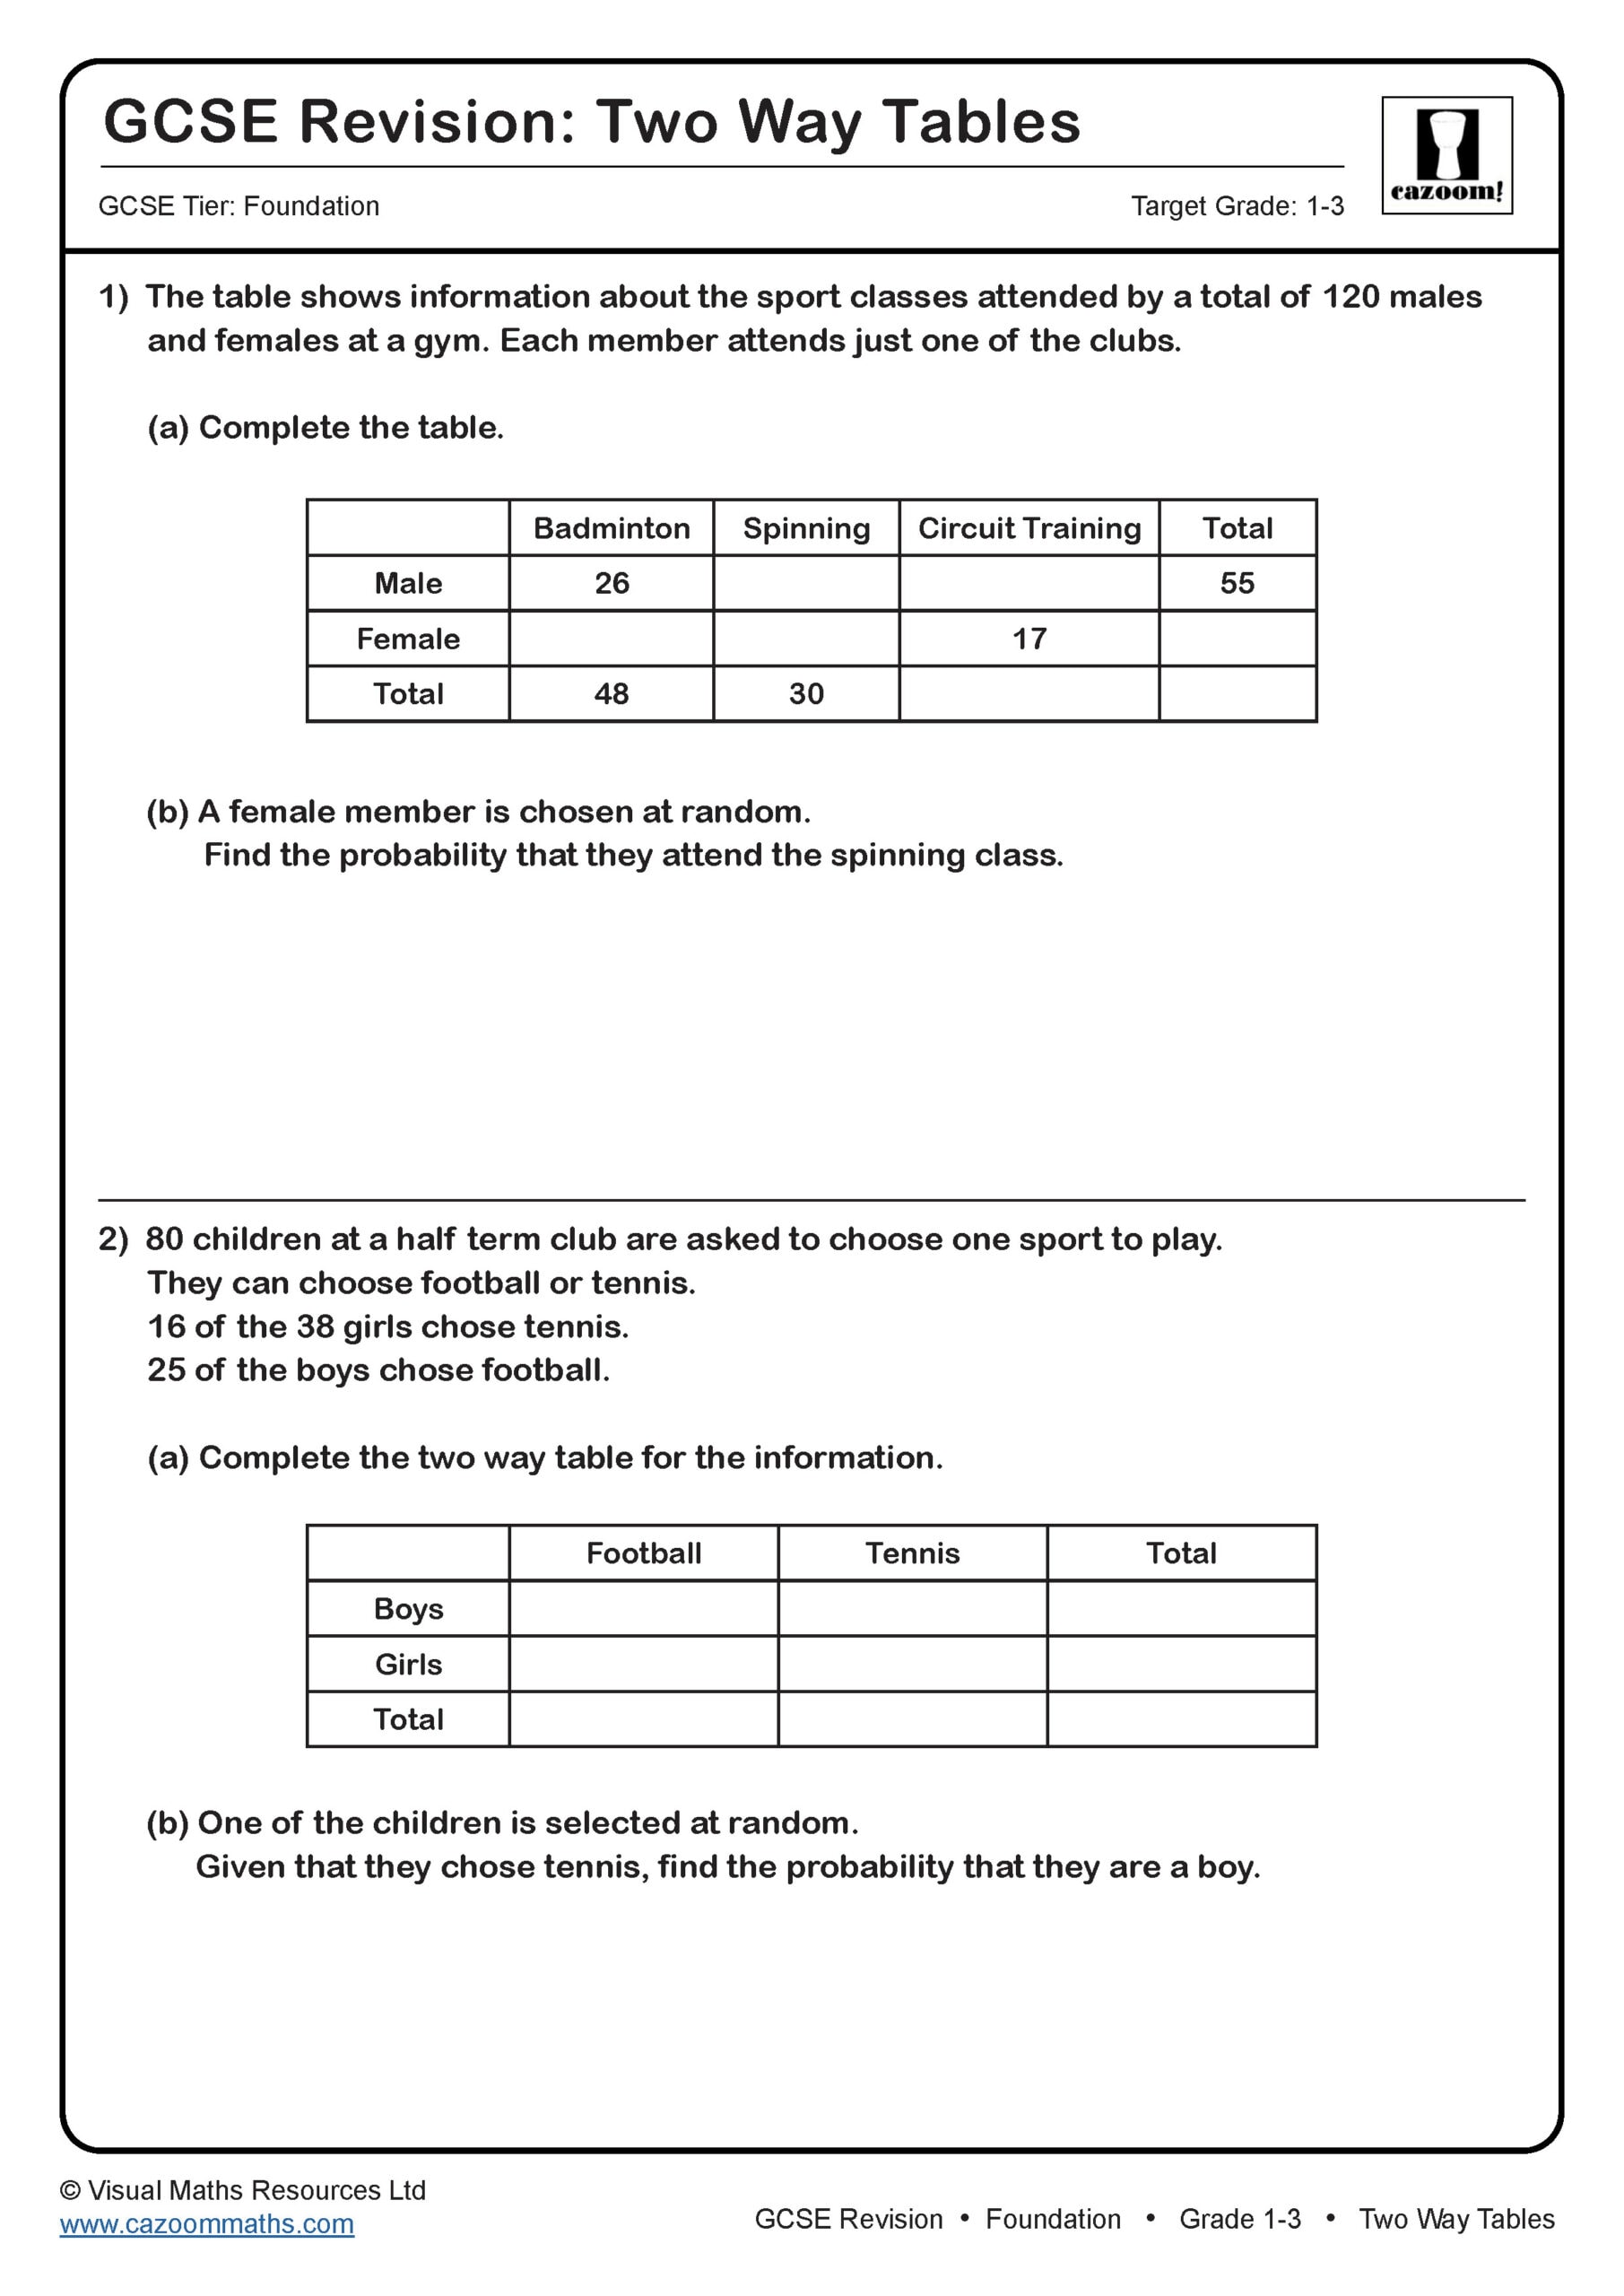
Two Way Tables
Target Grade: 1-3
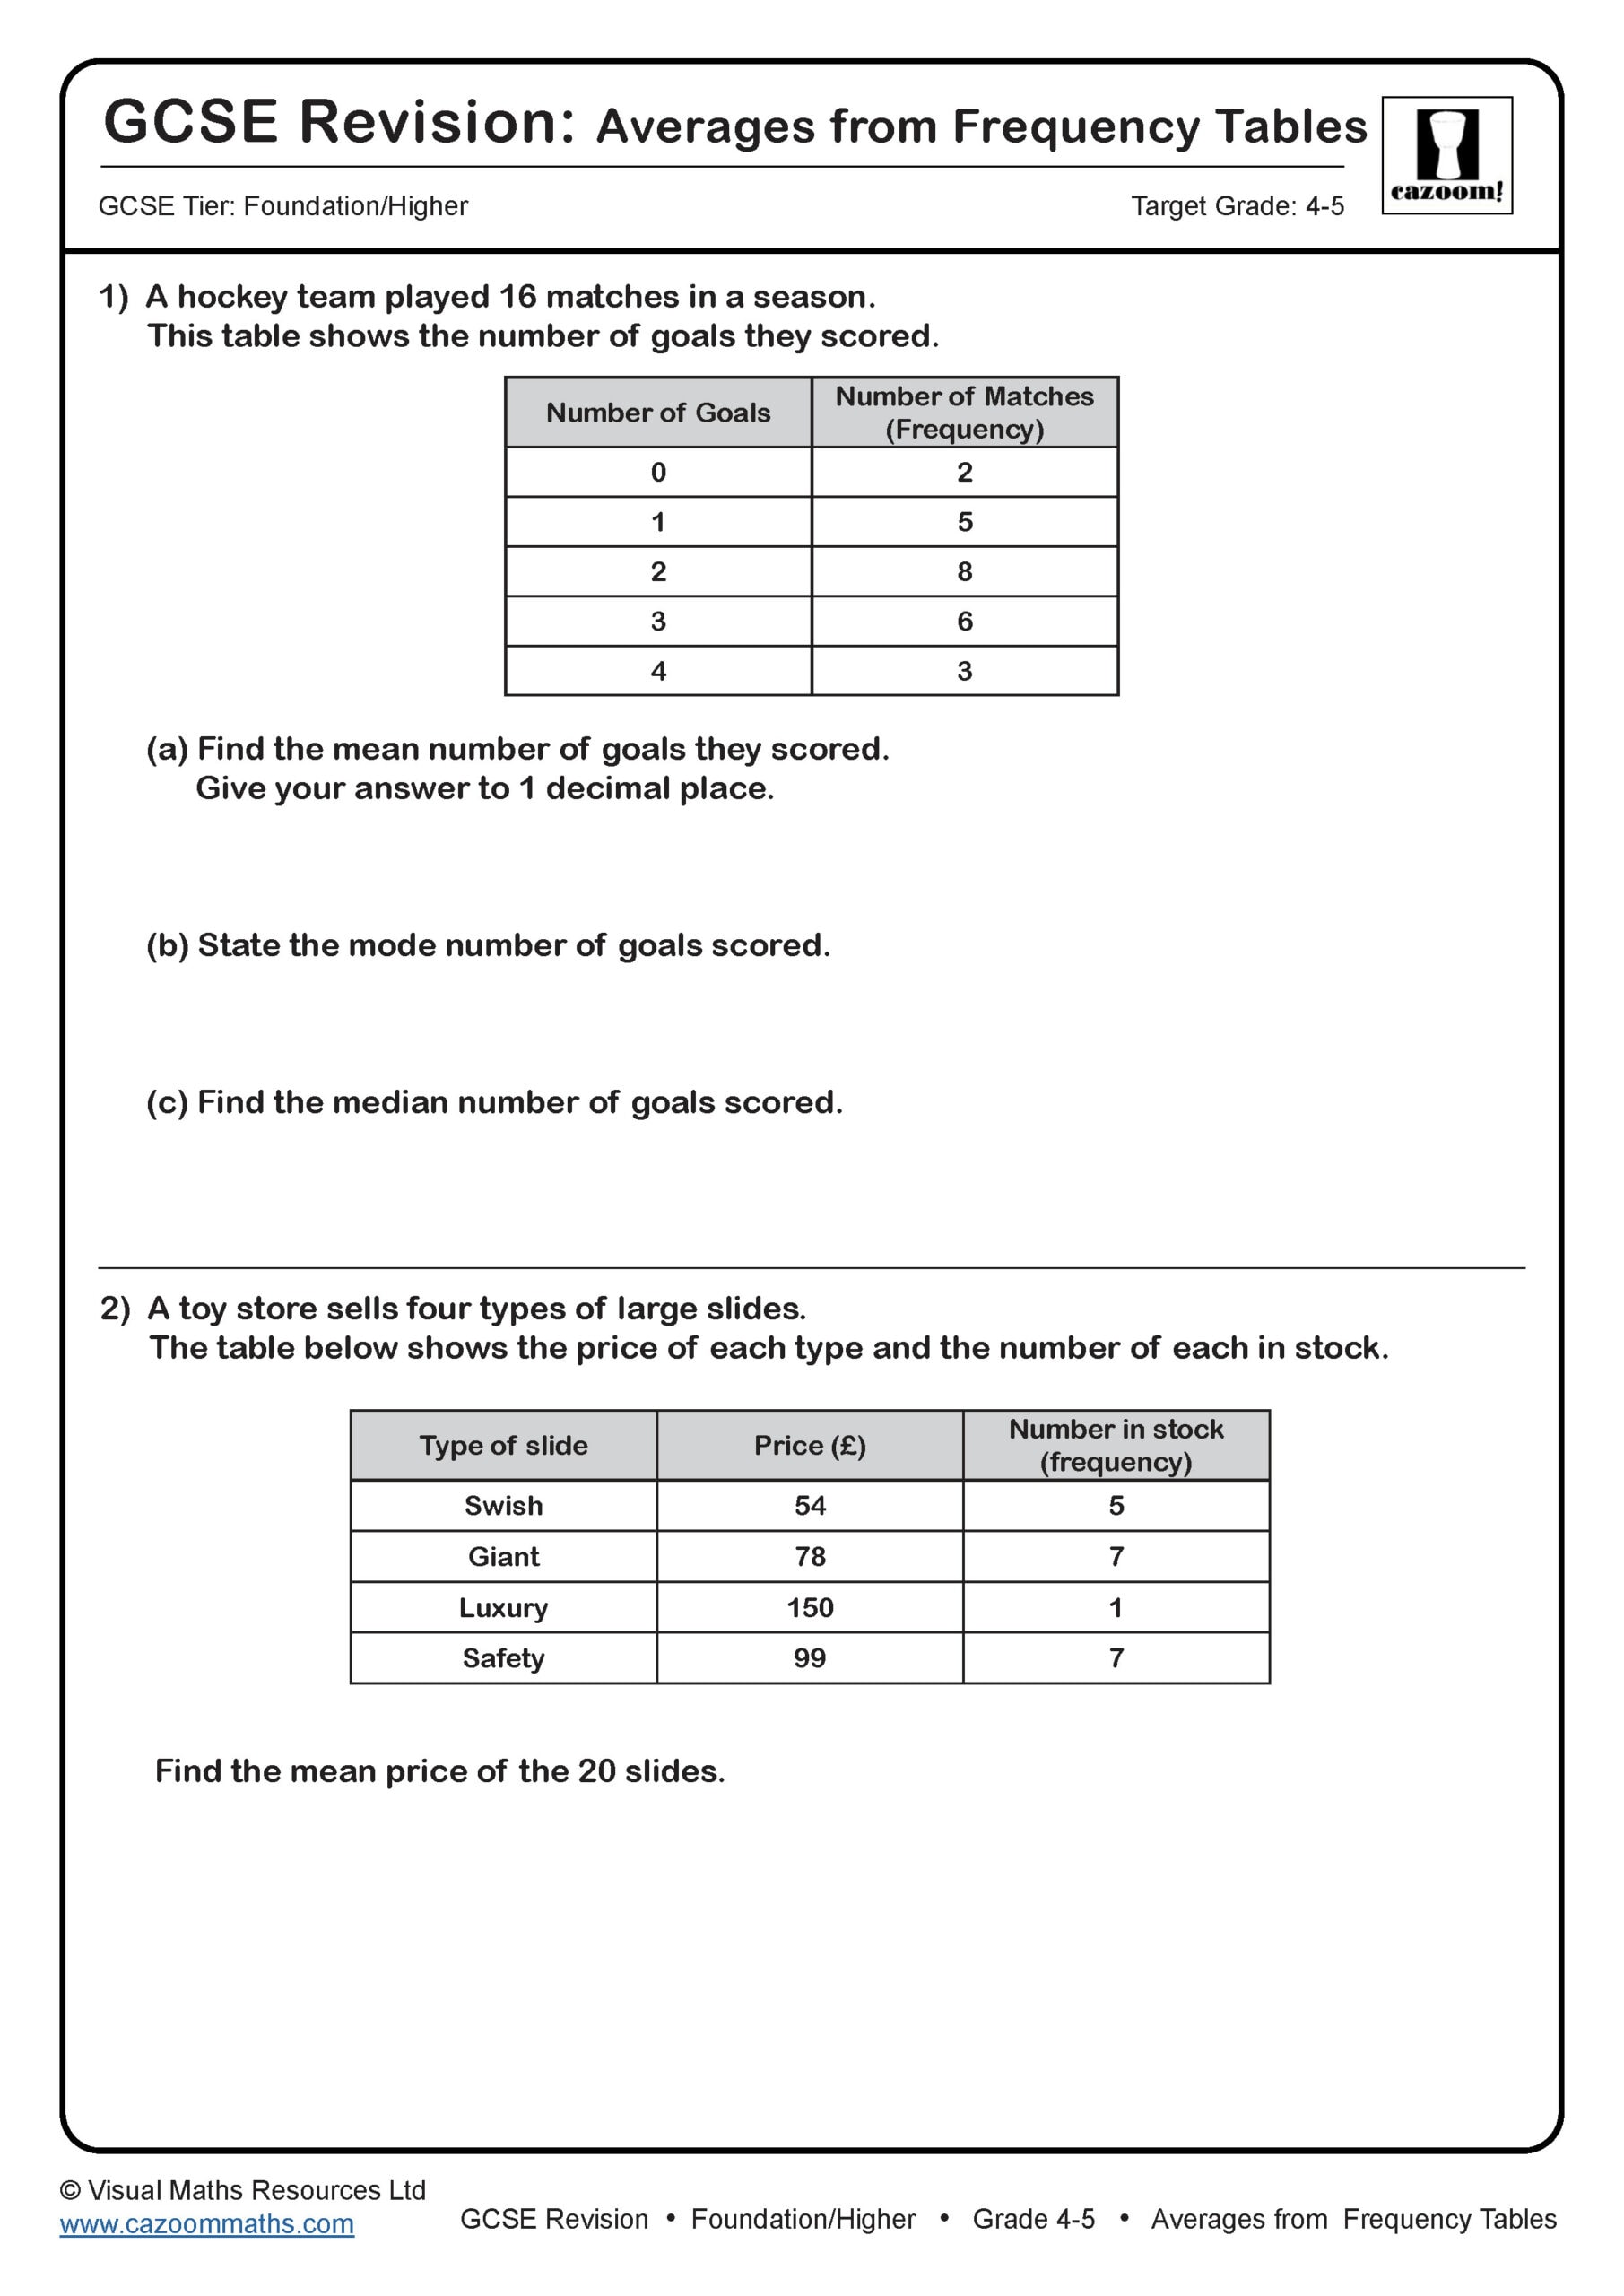
Averages From Frequency Tables
Target Grade: 4-5
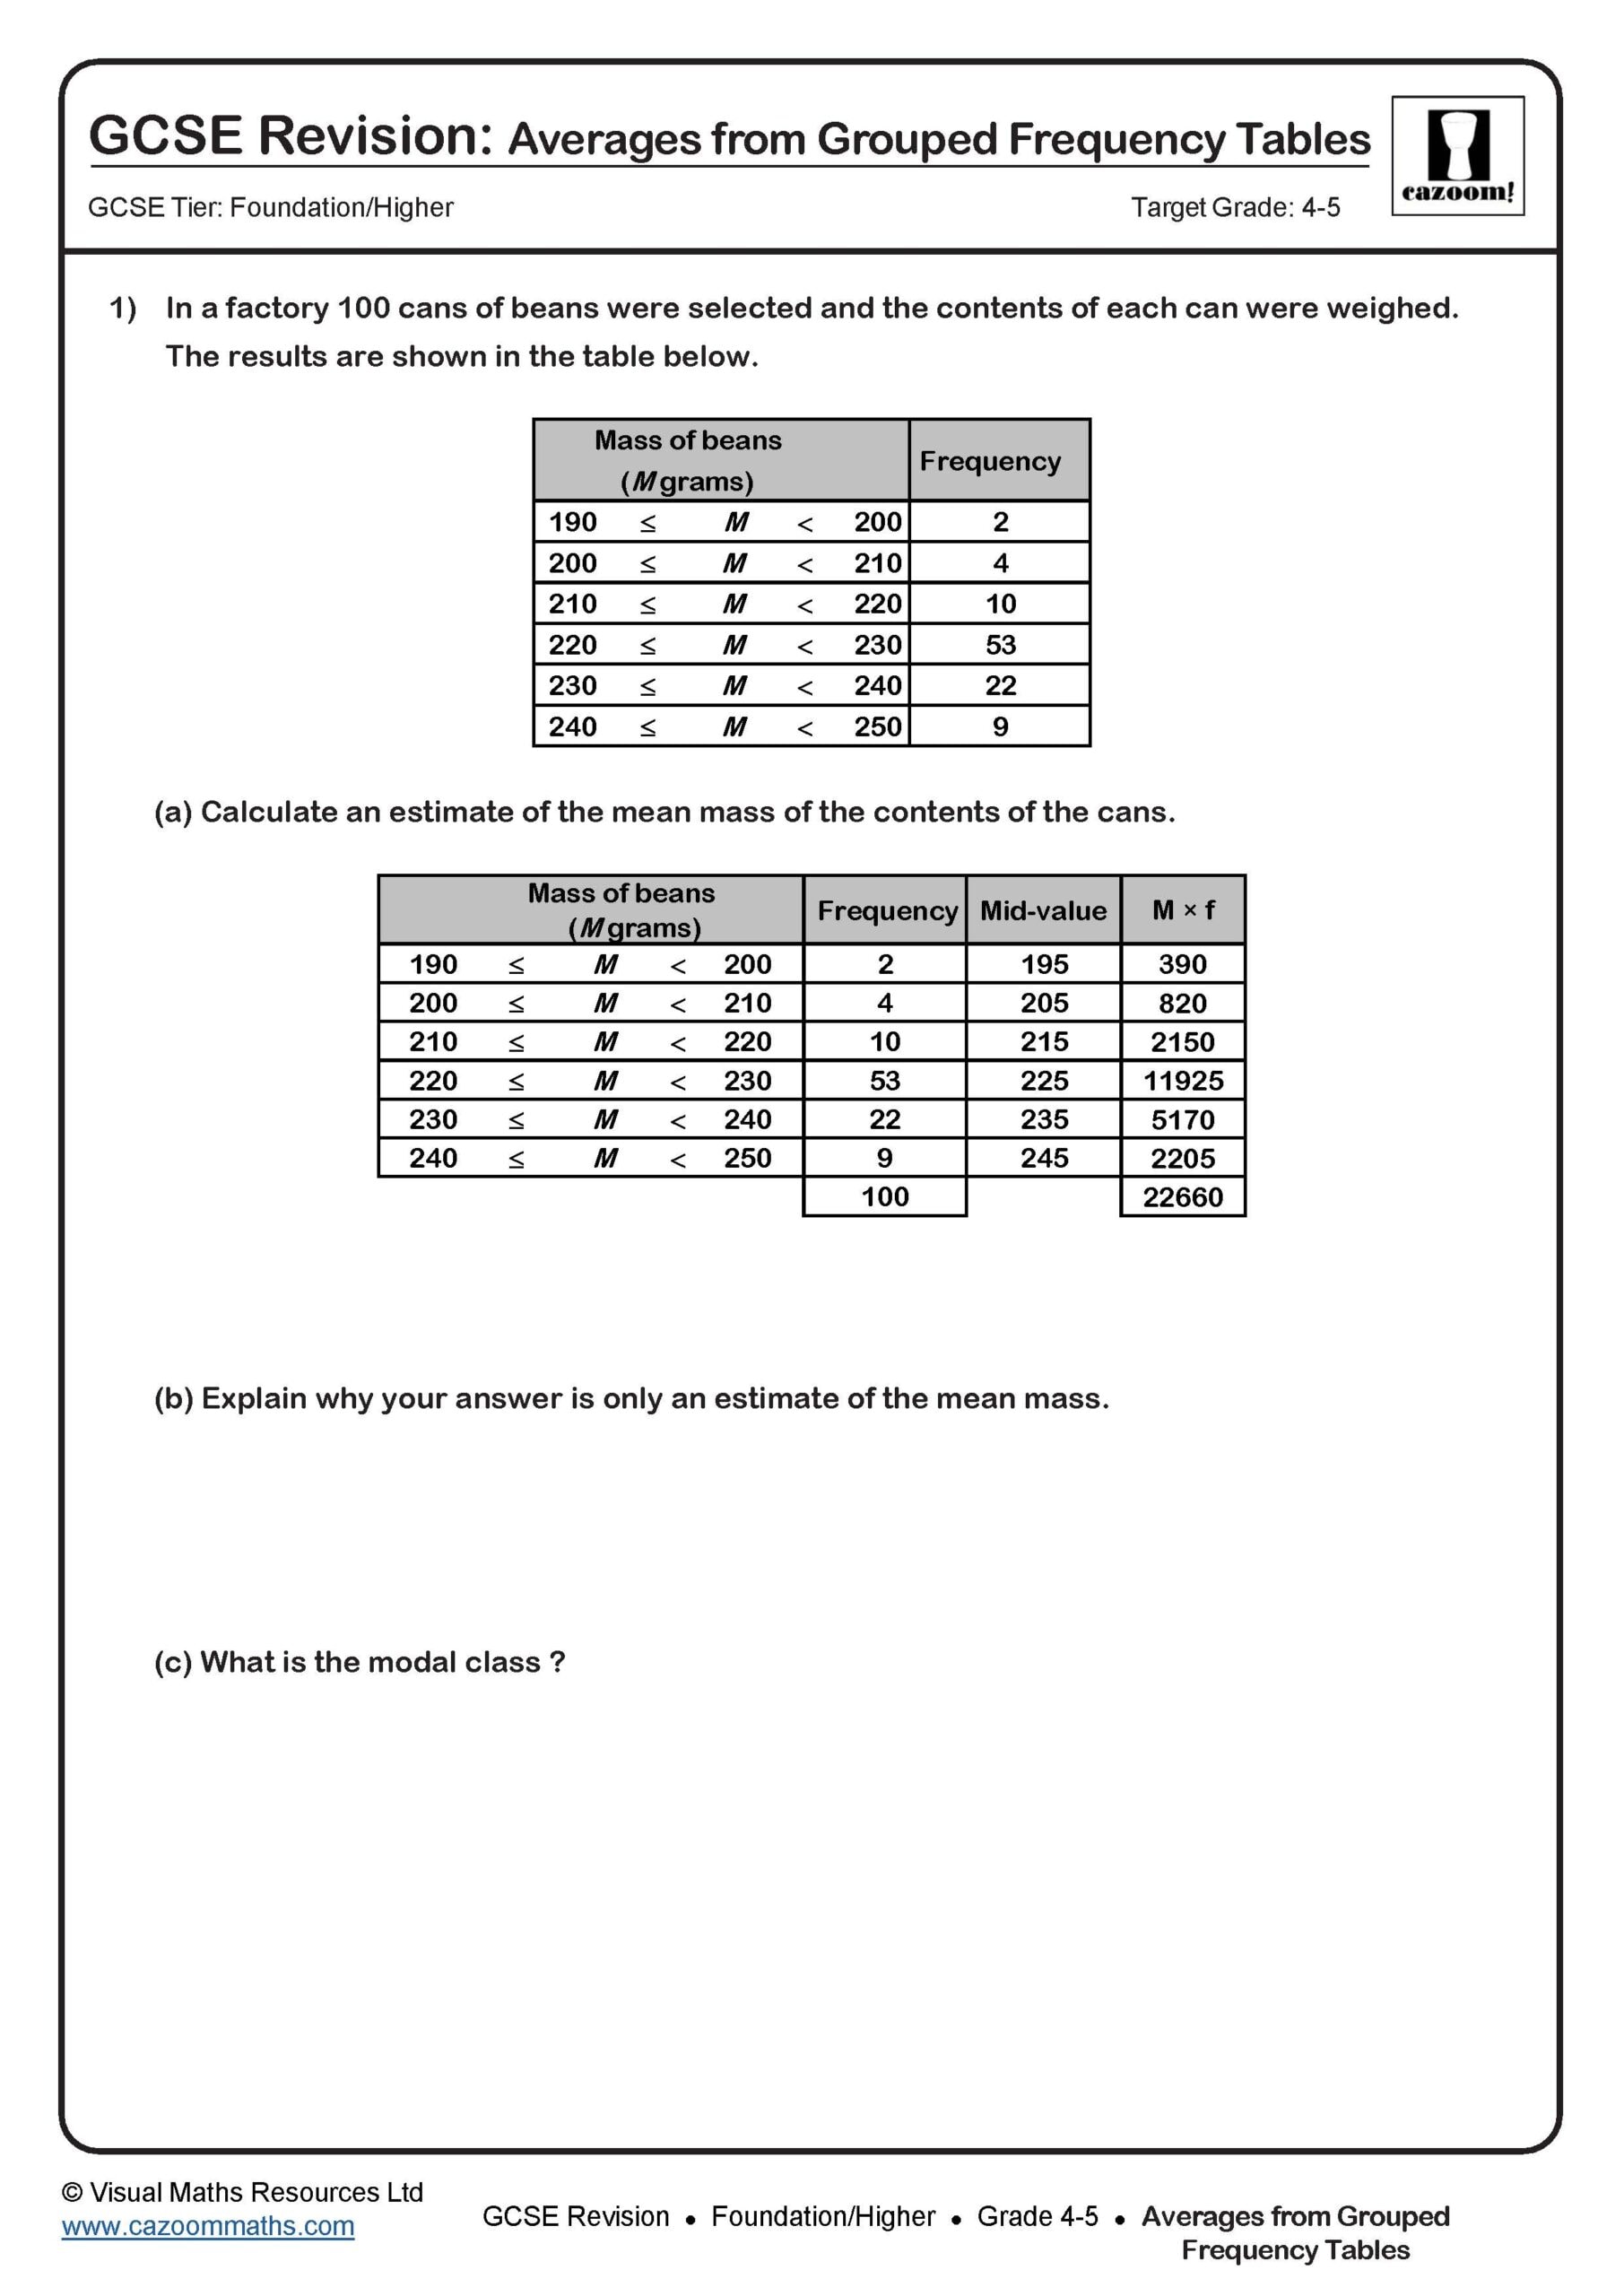
Averages from Grouped Frequency Tables
Target Grade: 4-5
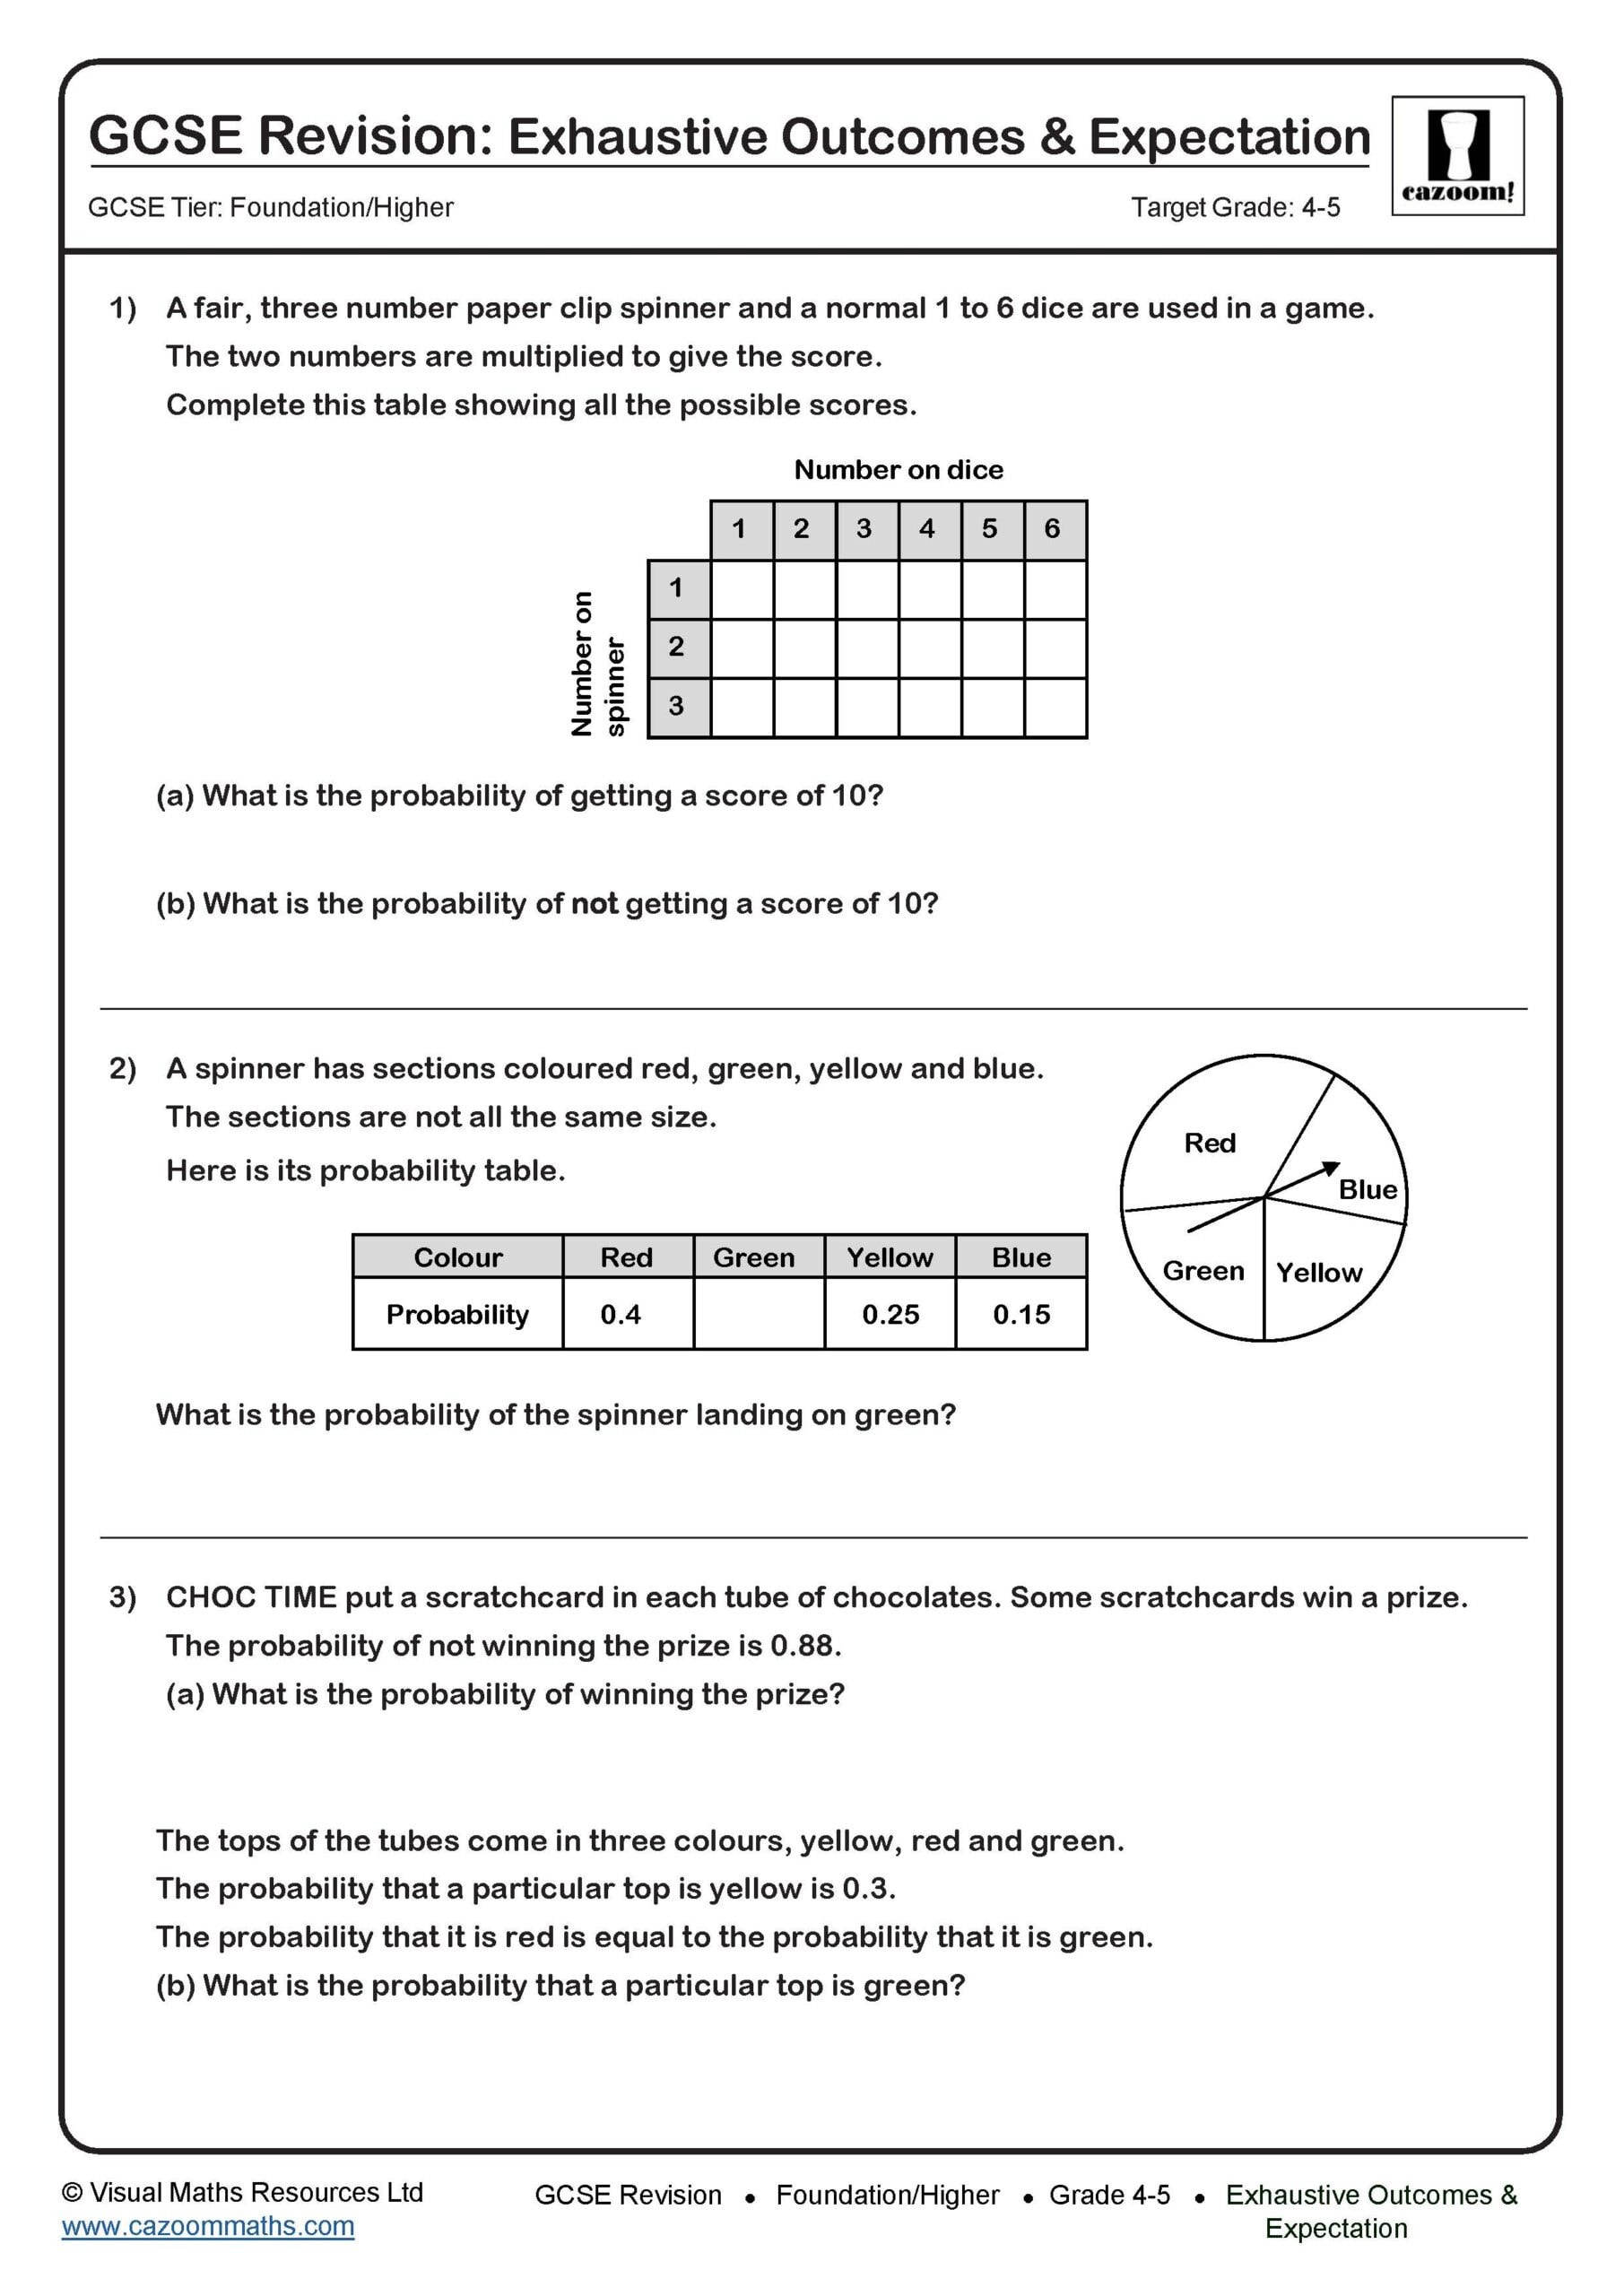
Exhaustive Outcomes & Expectation
Target Grade: 4-5
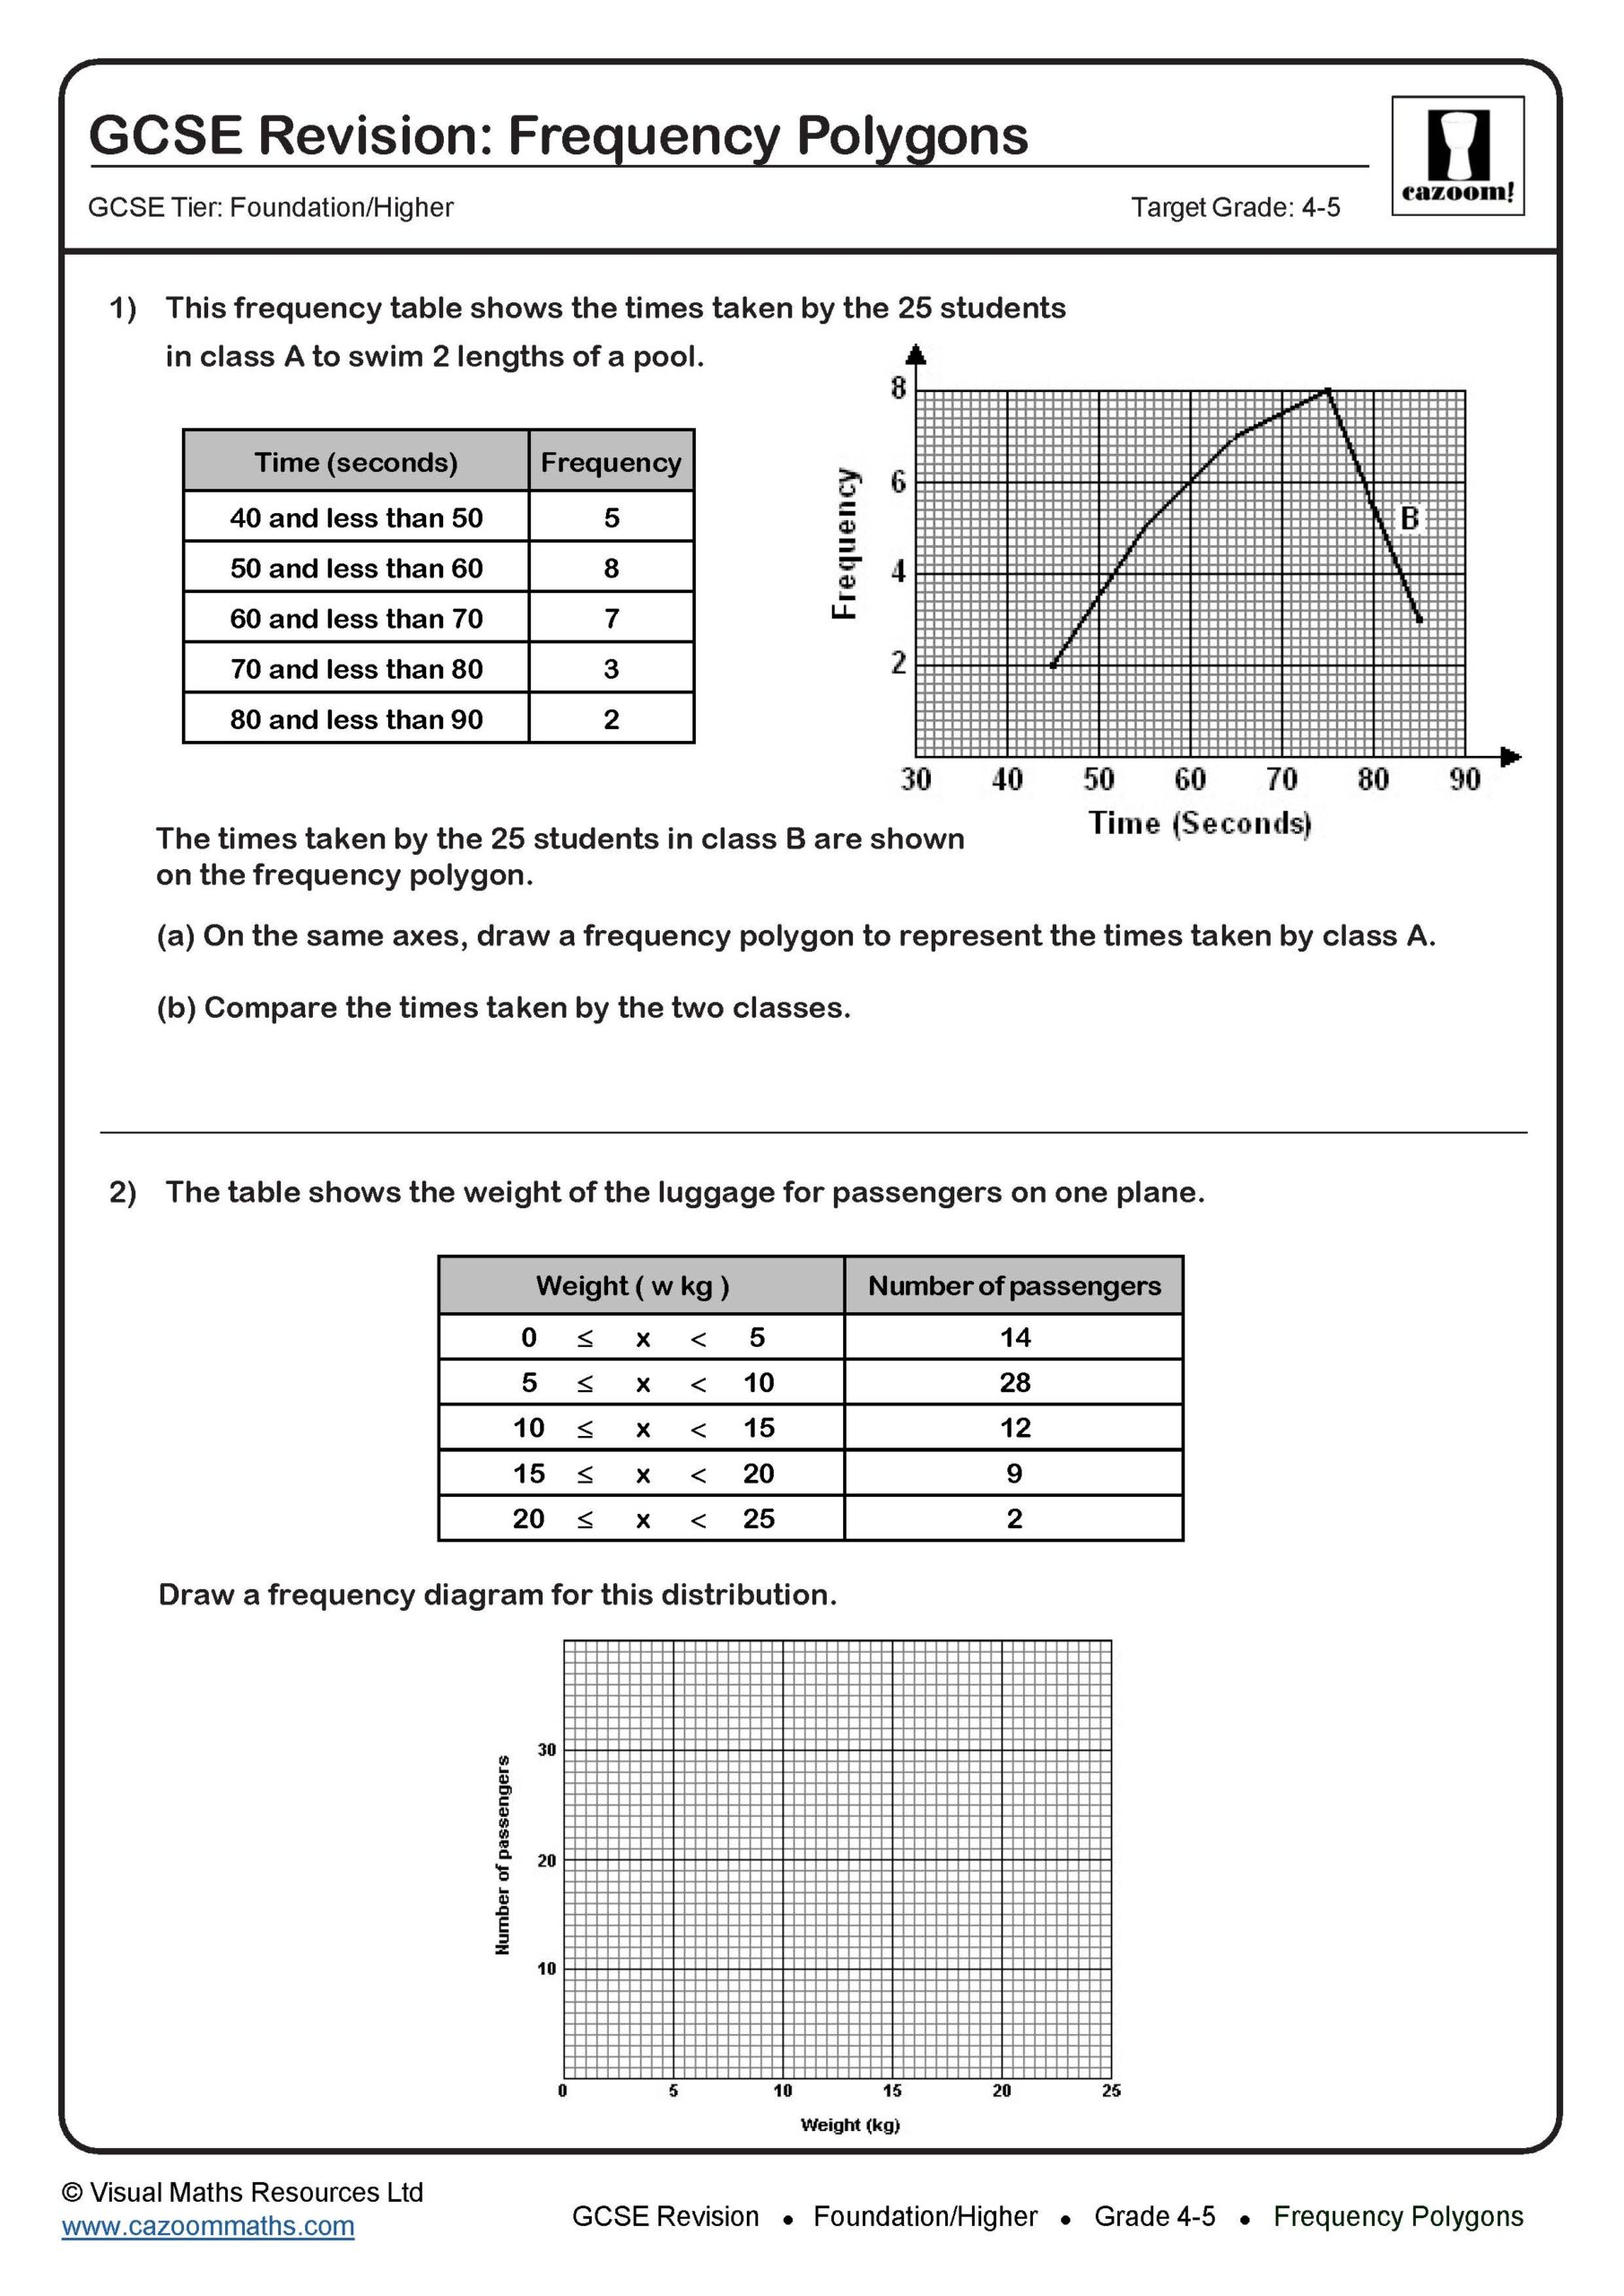
Frequency Polygons
Target Grade: 4-5
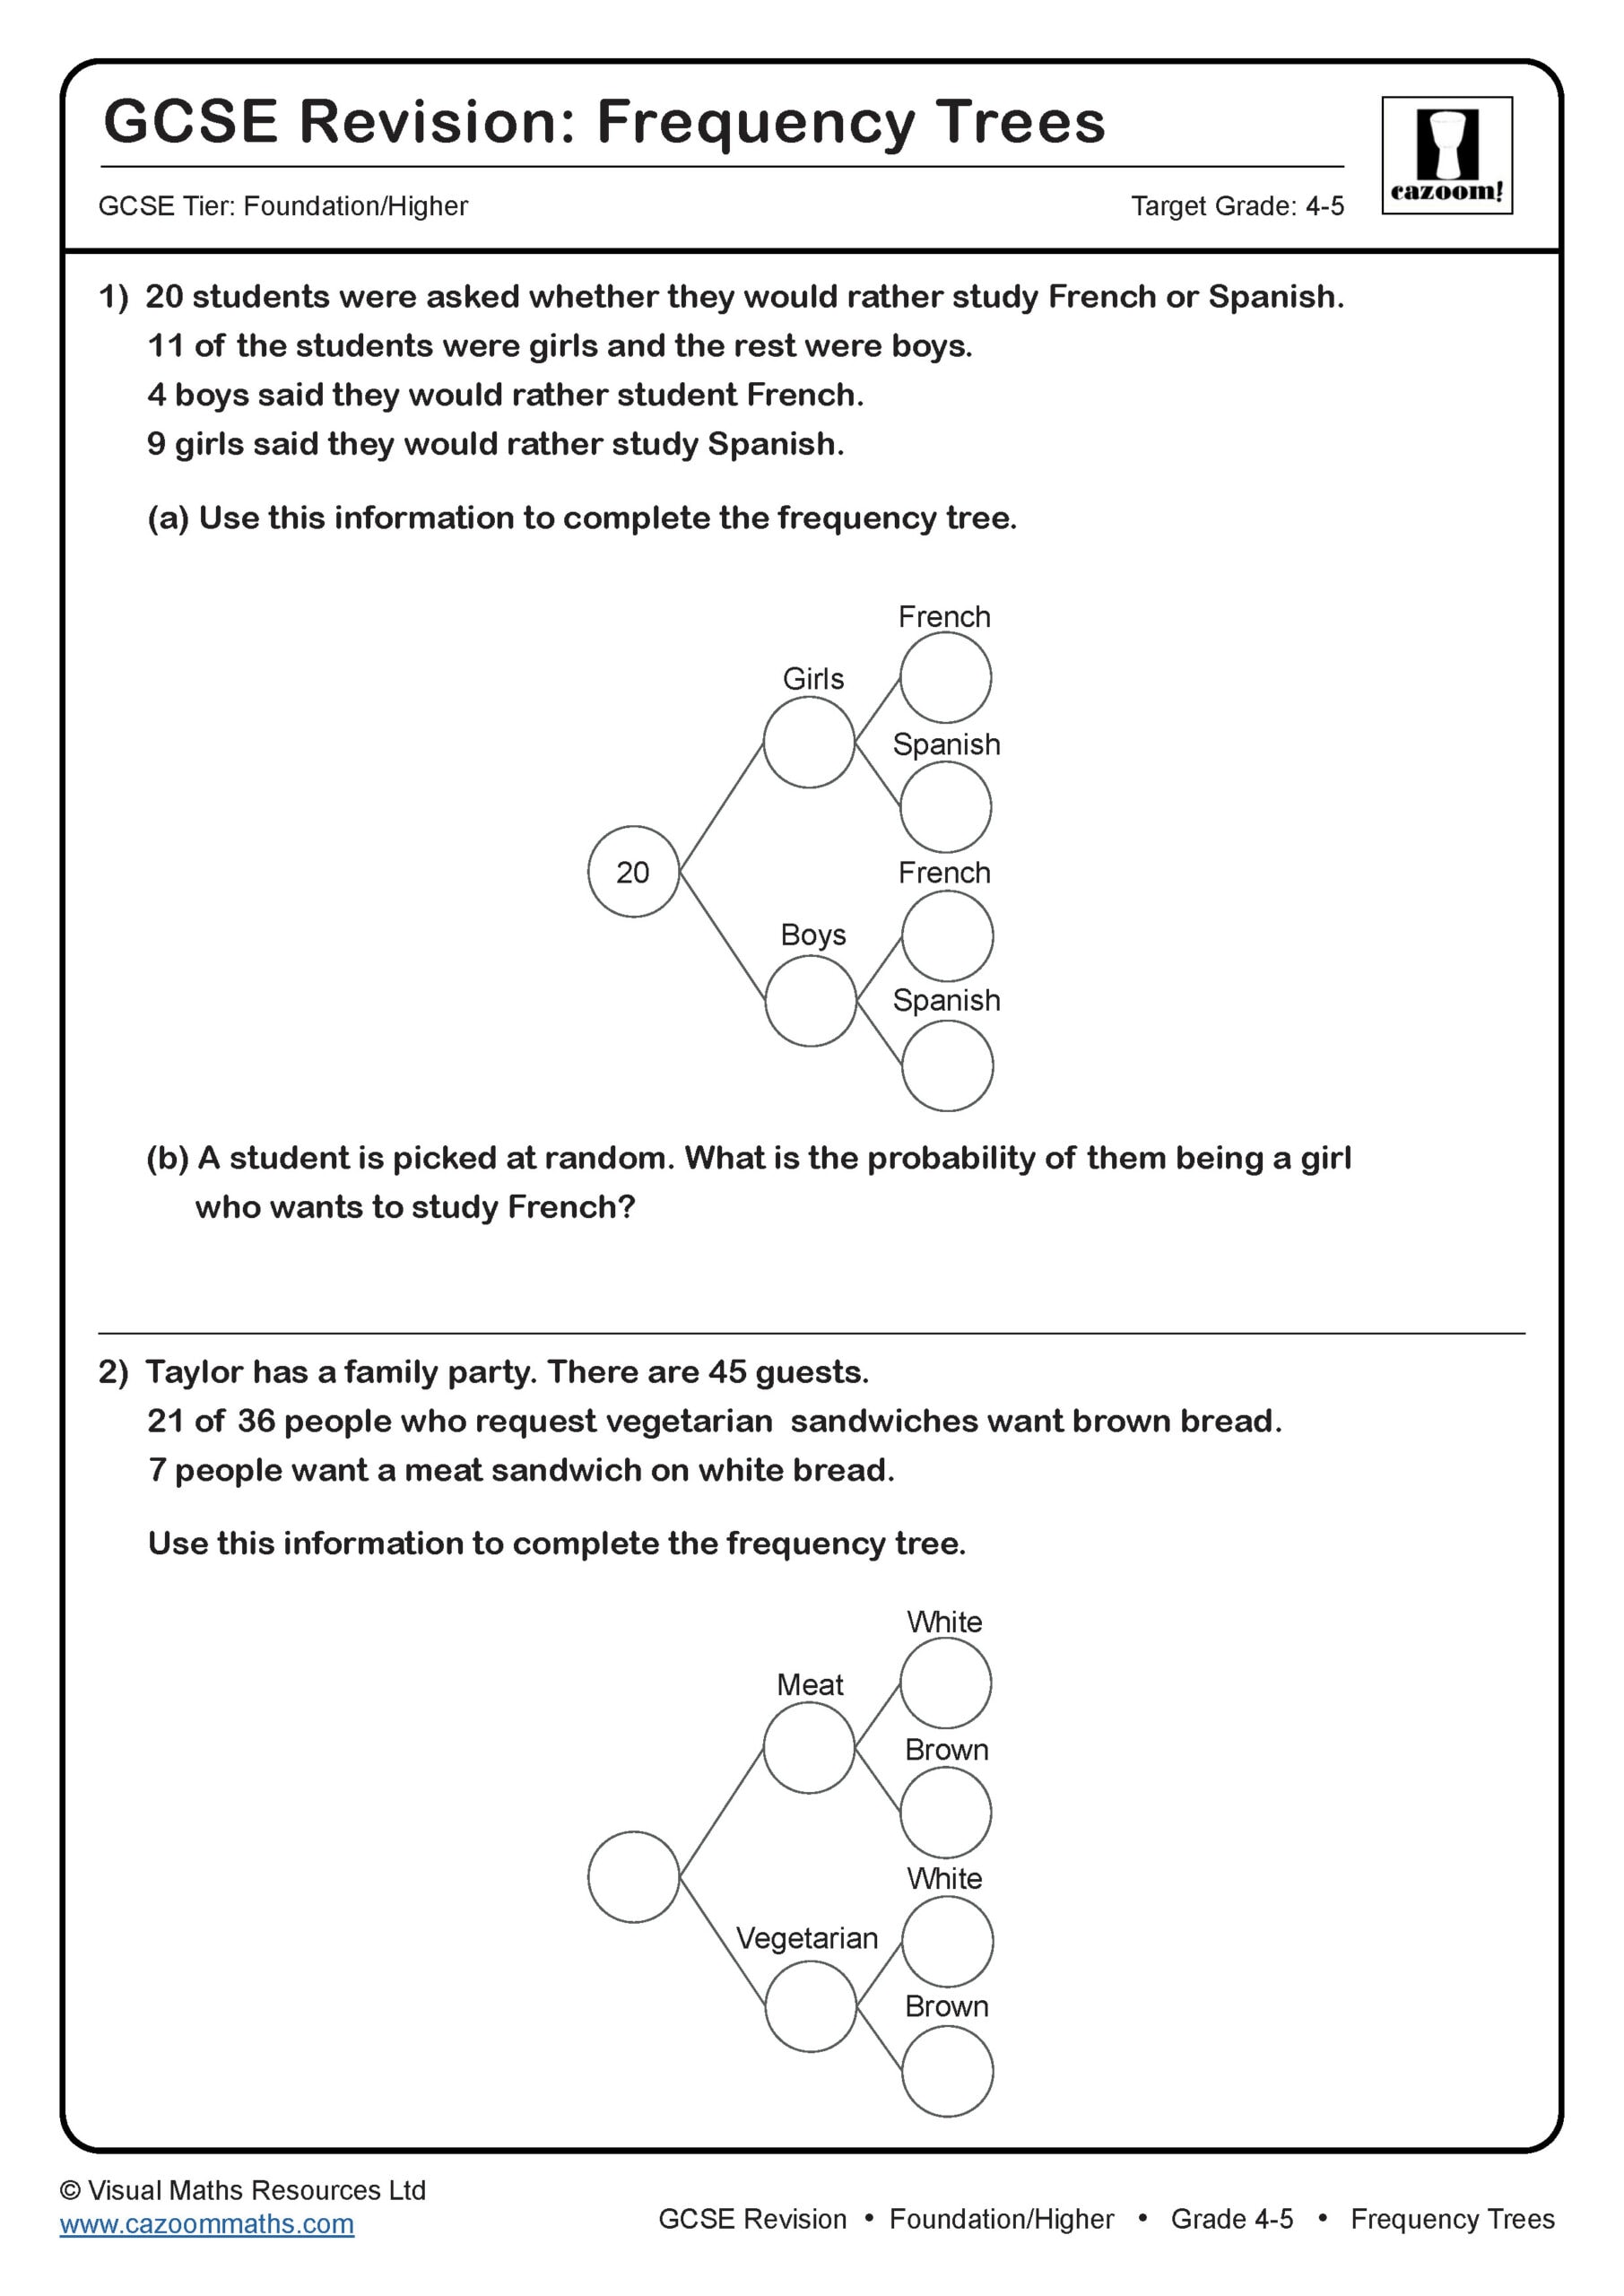
Frequency Trees
Target Grade: 4-5
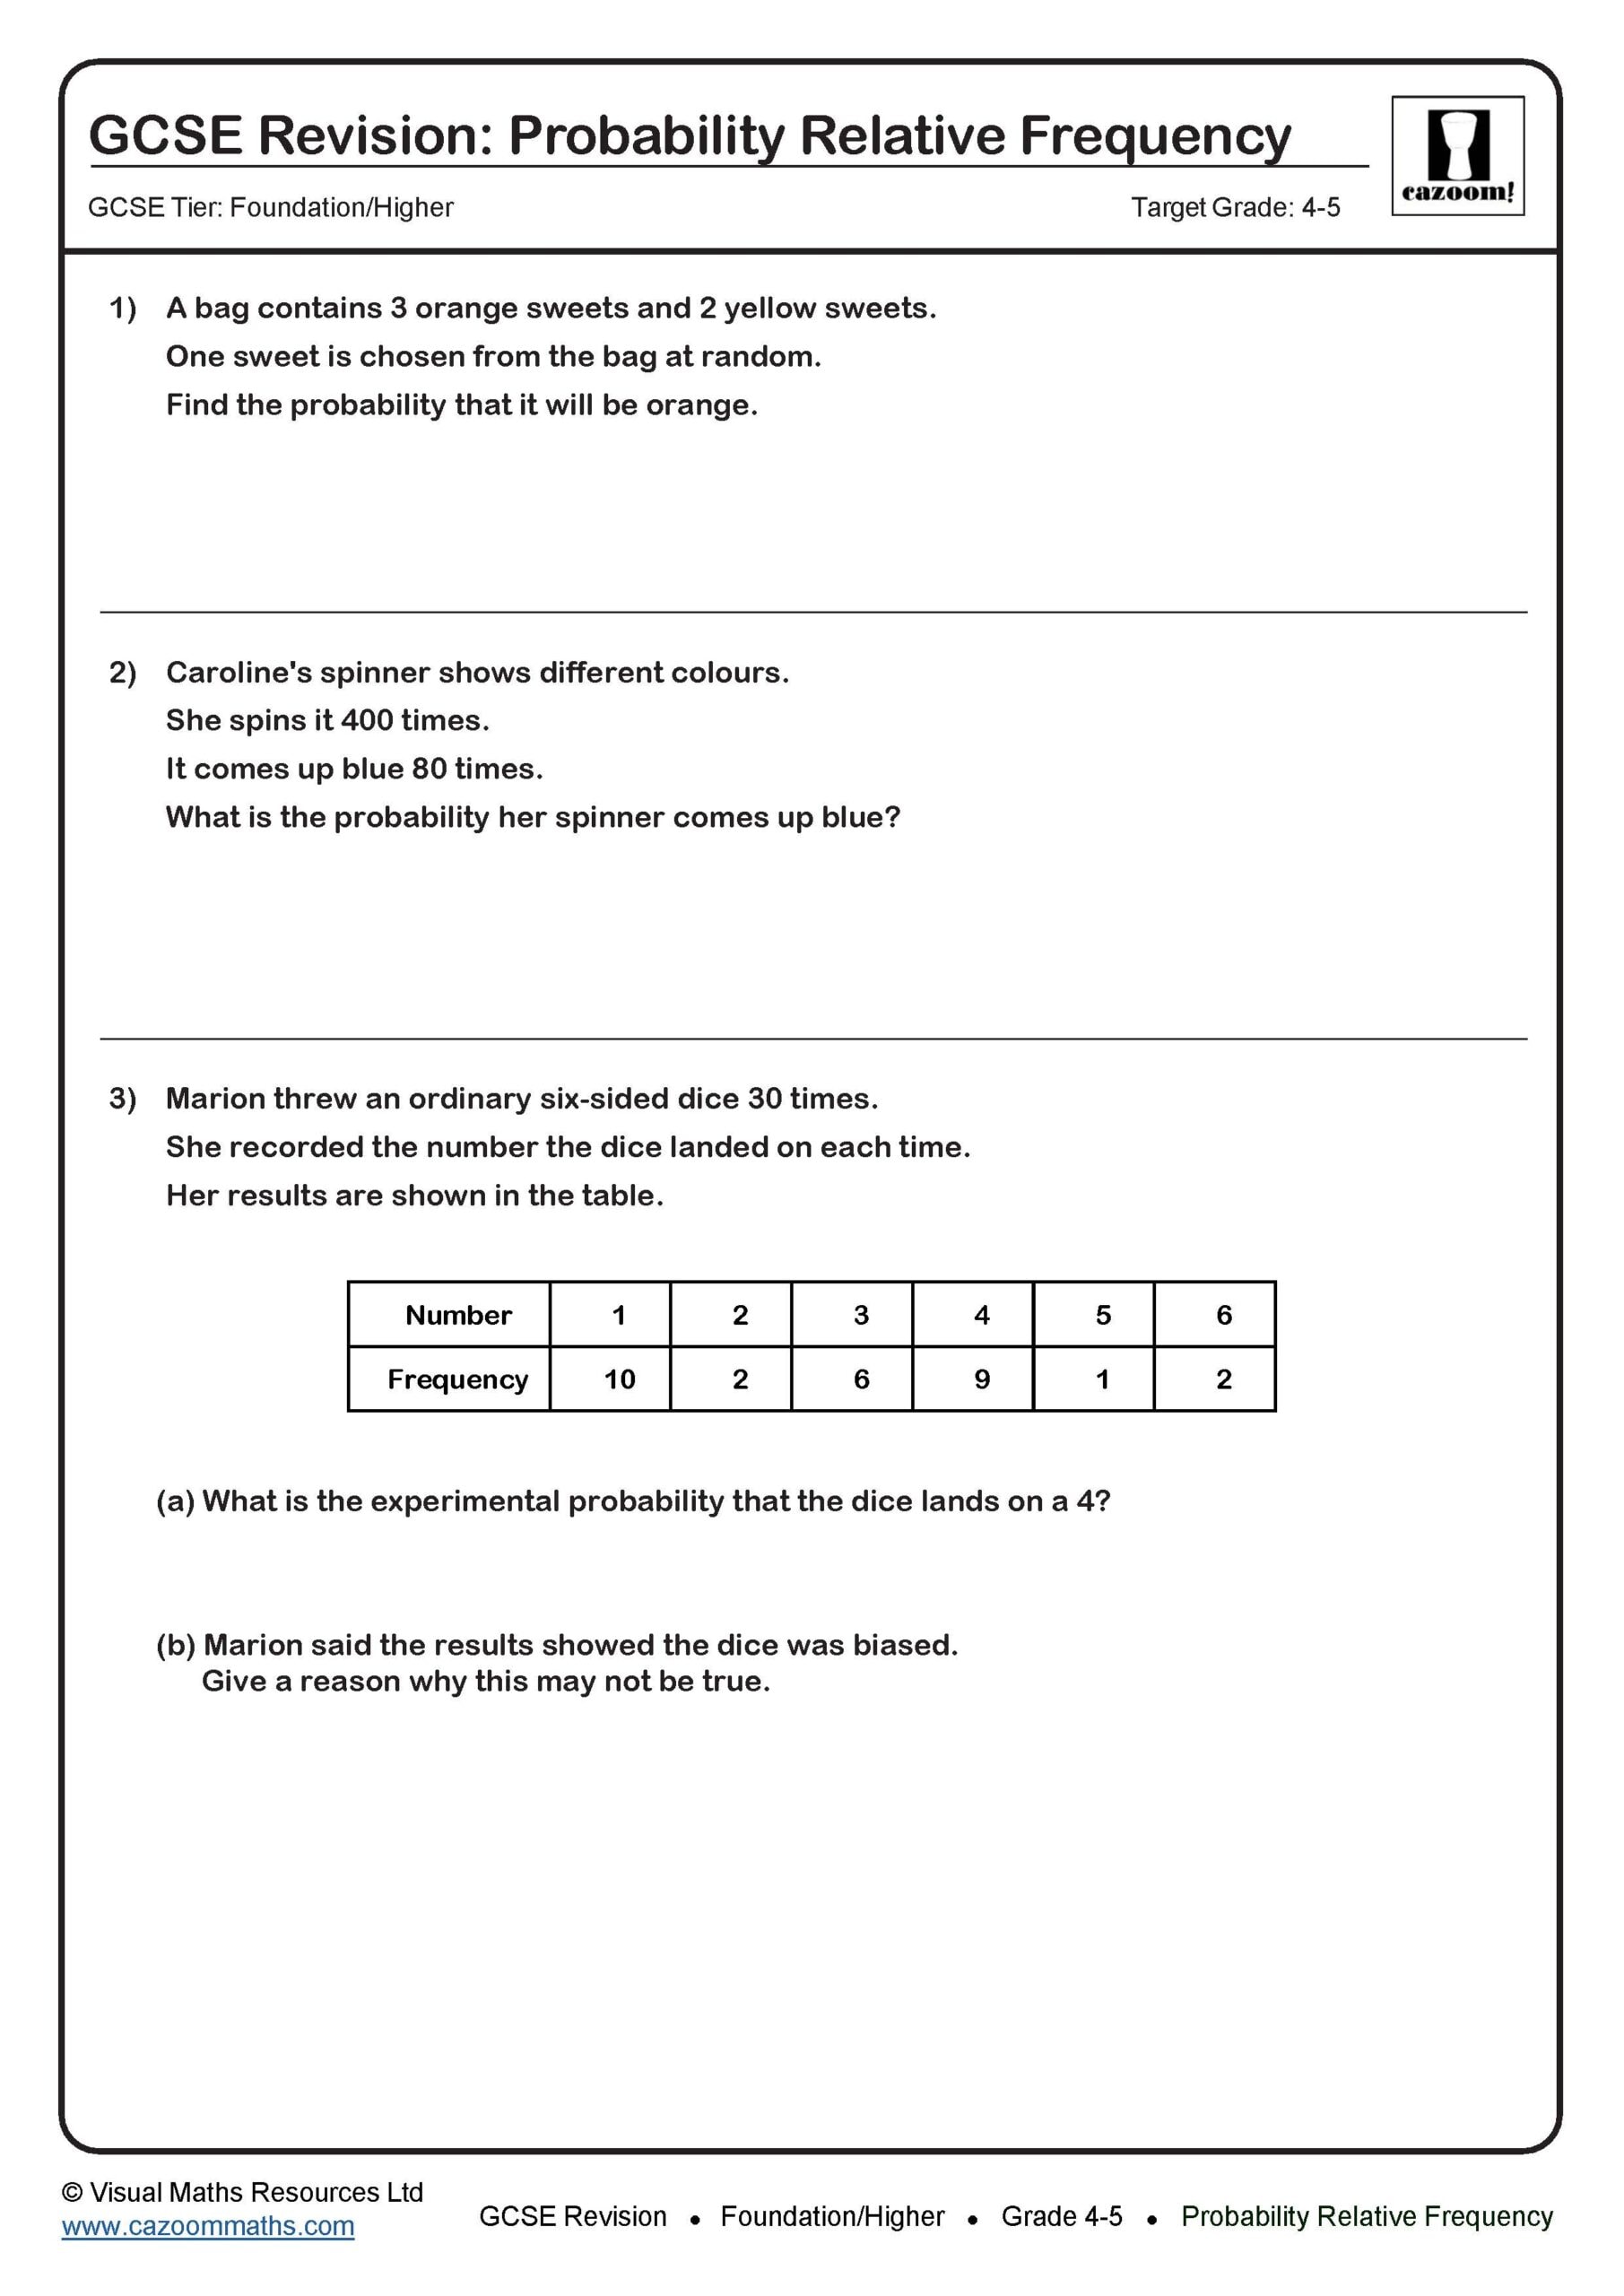
Probability Relative Frequency
Target Grade: 4-5
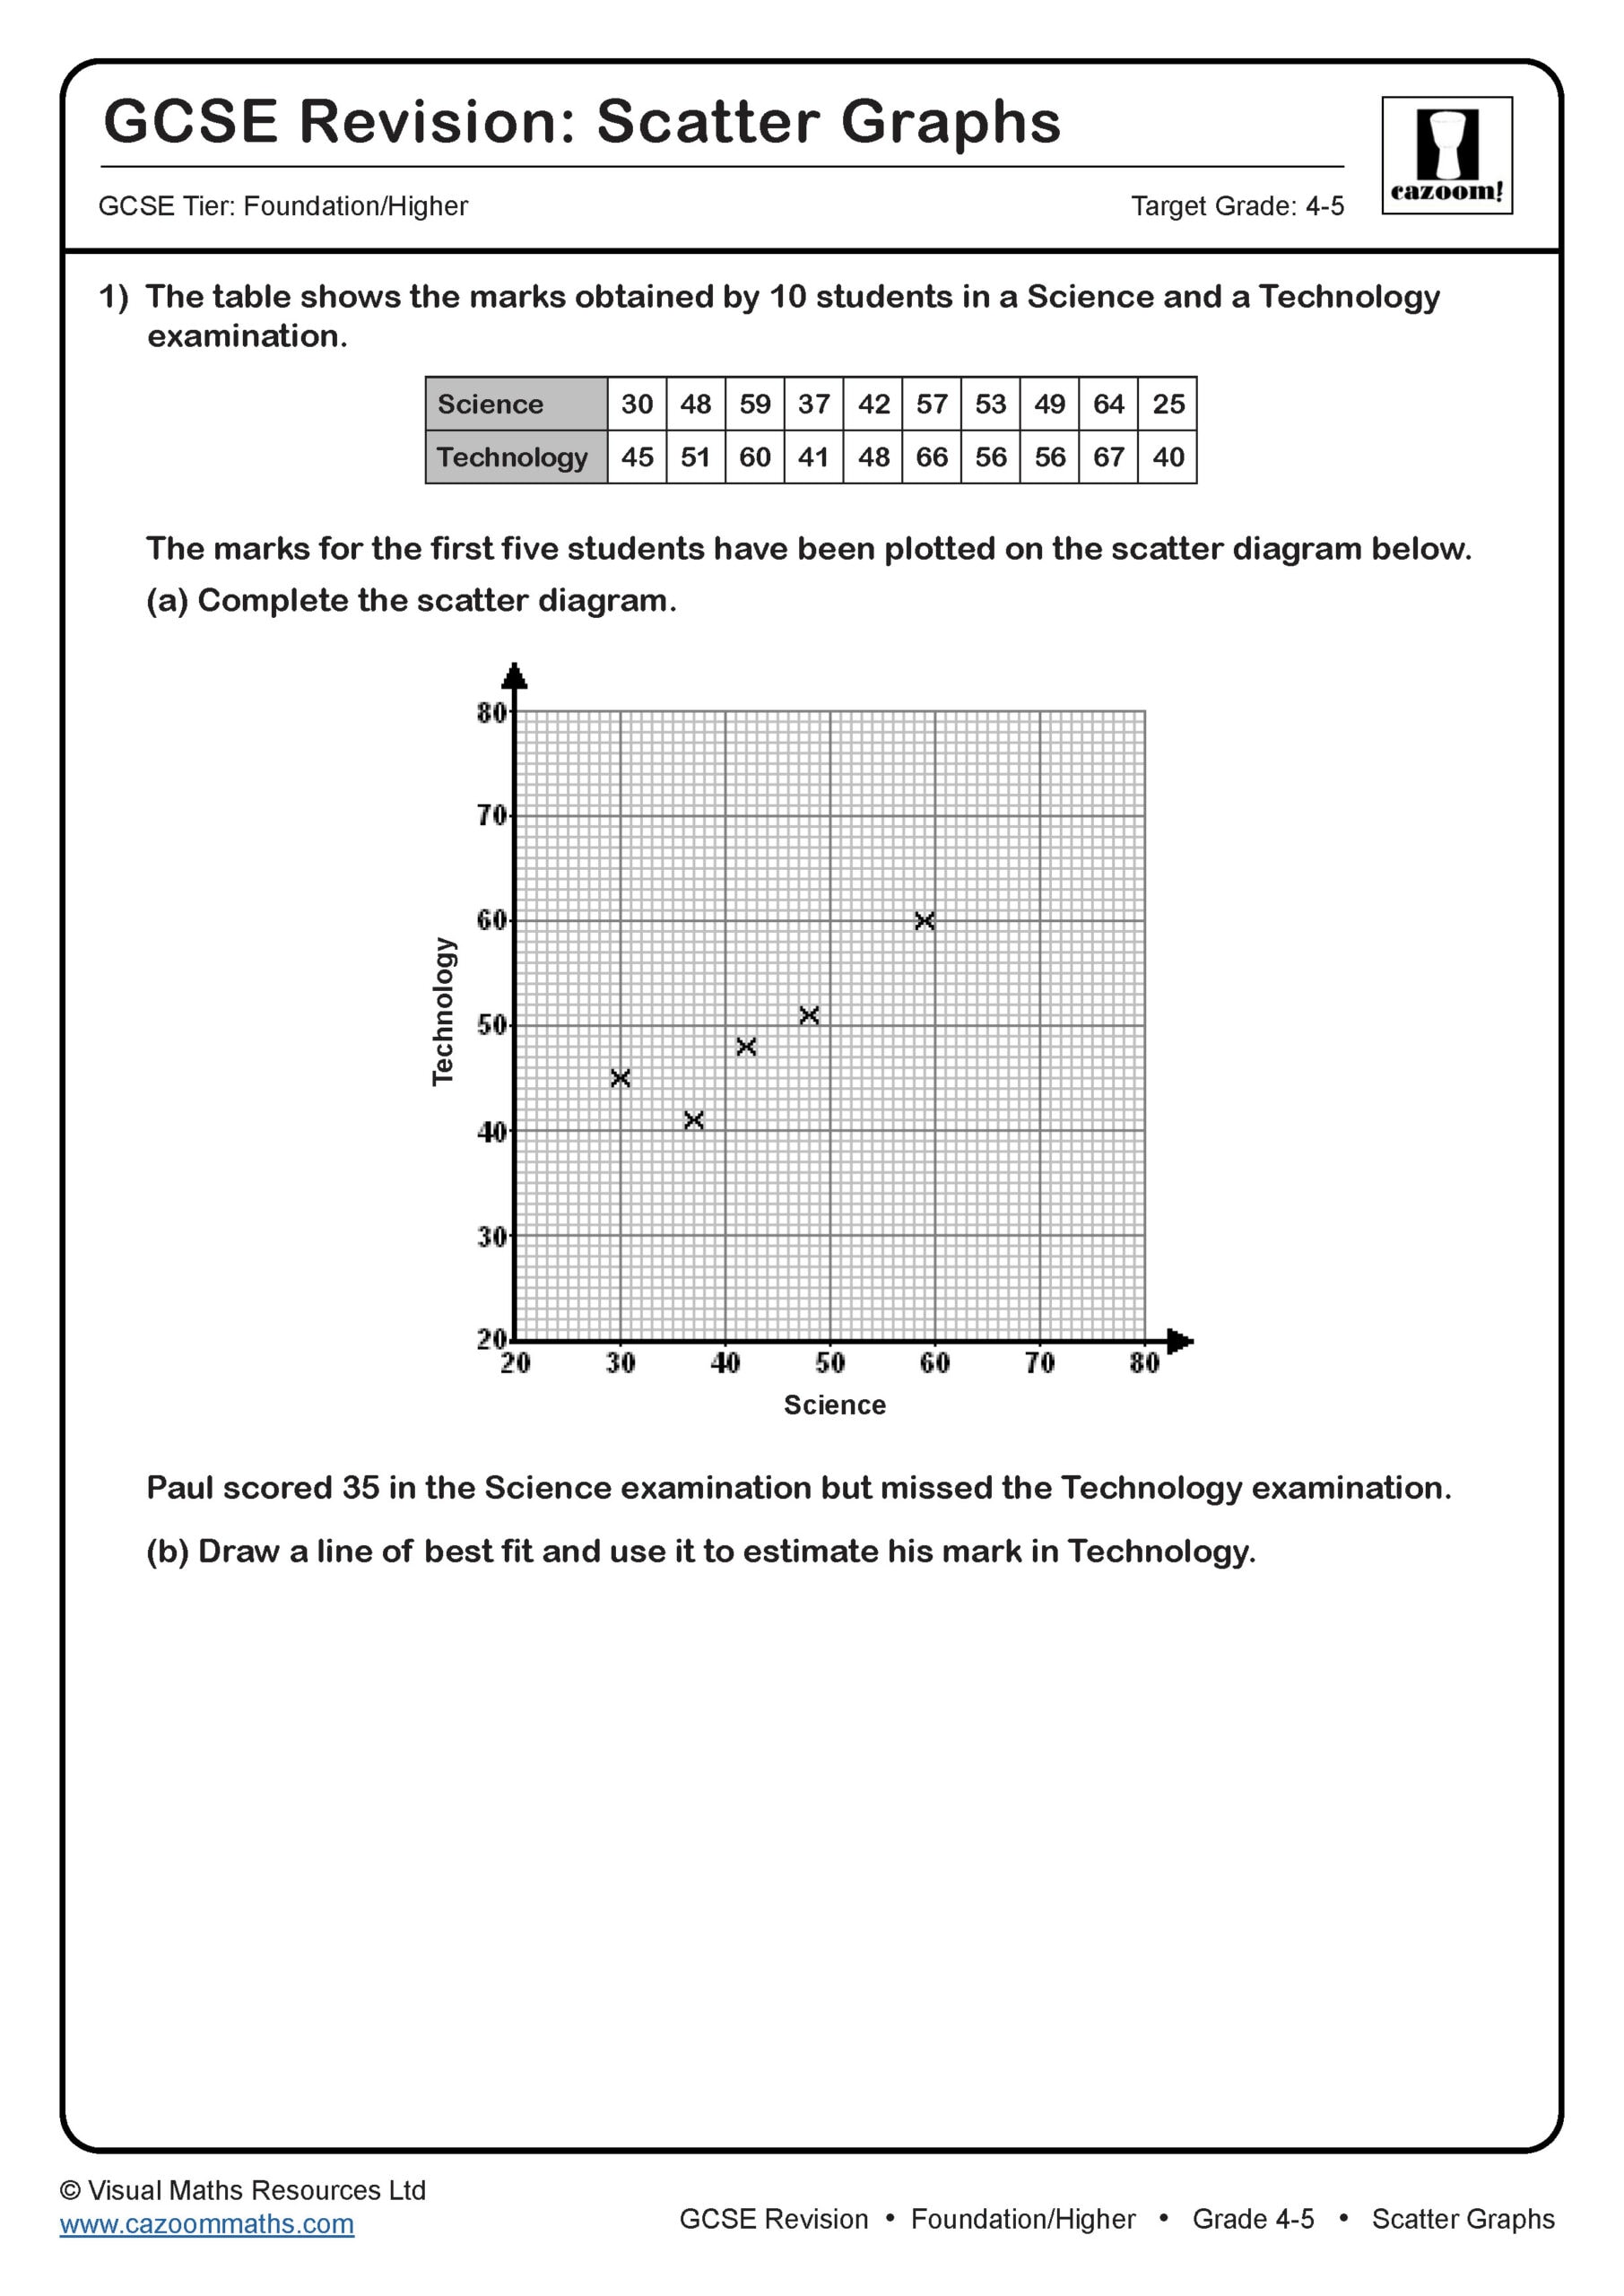
Scatter Graphs
Target Grade: 4-5
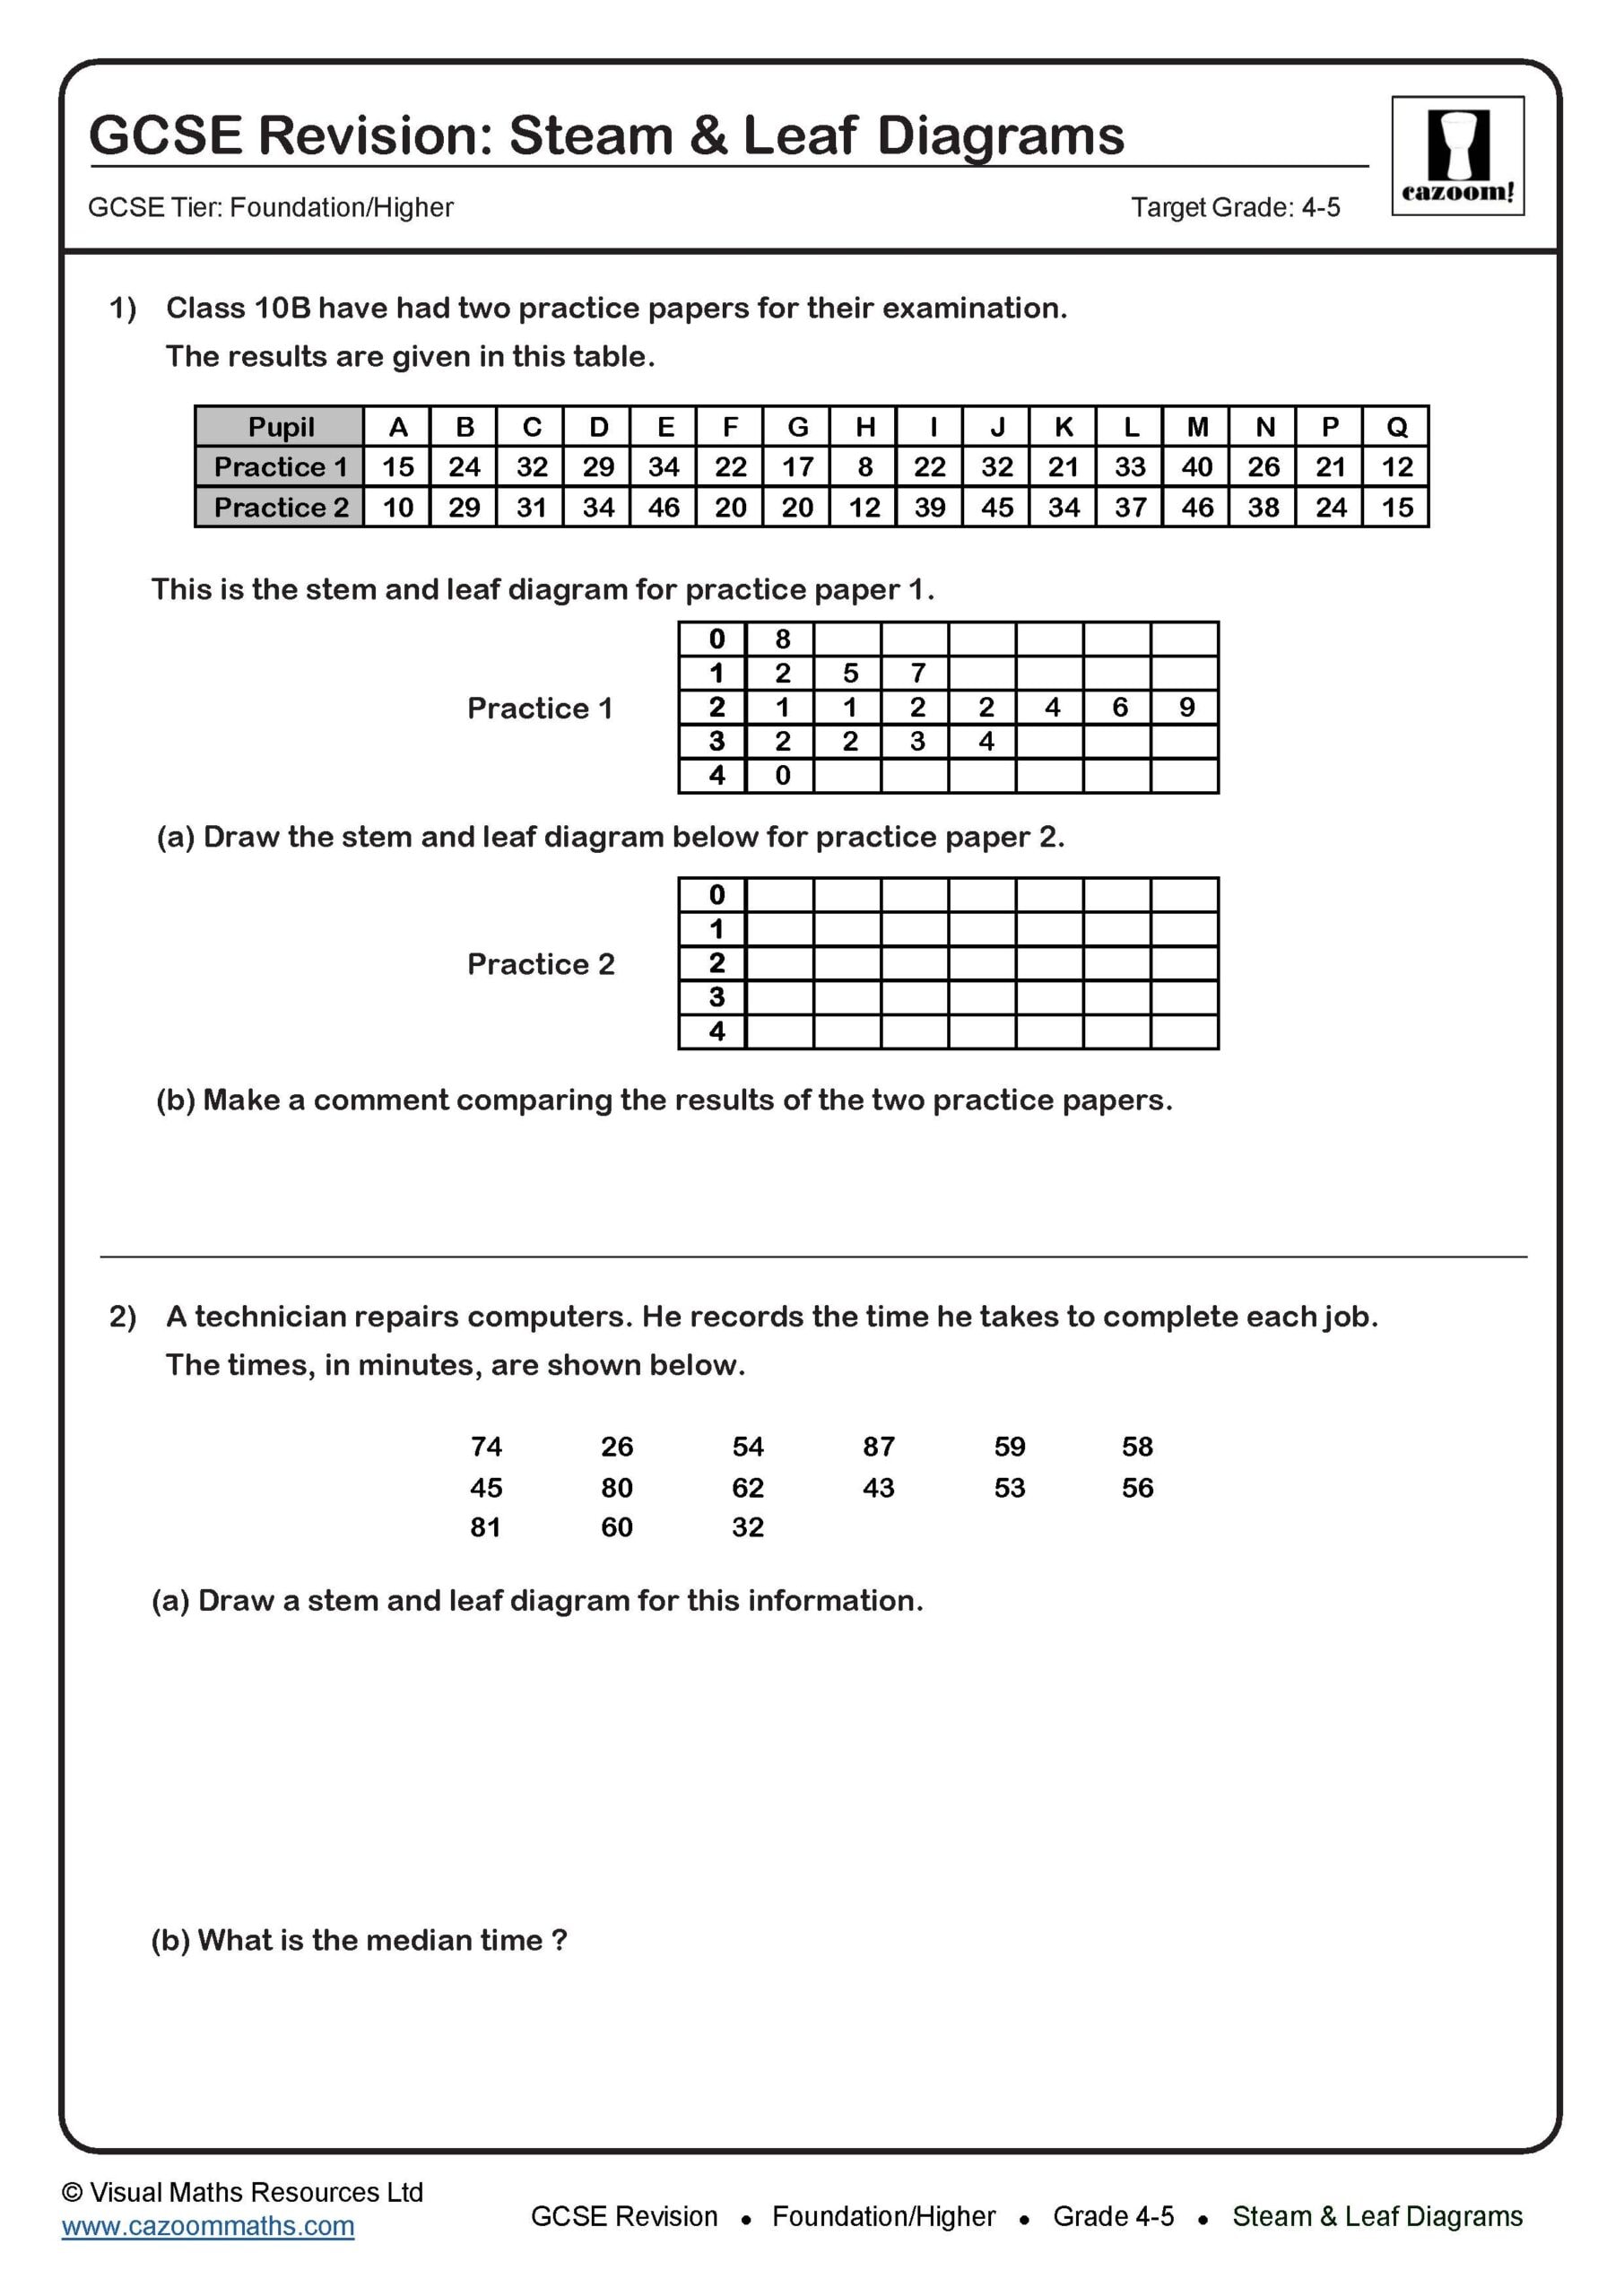
Stem & Leaf Diagrams
Target Grade: 4-5
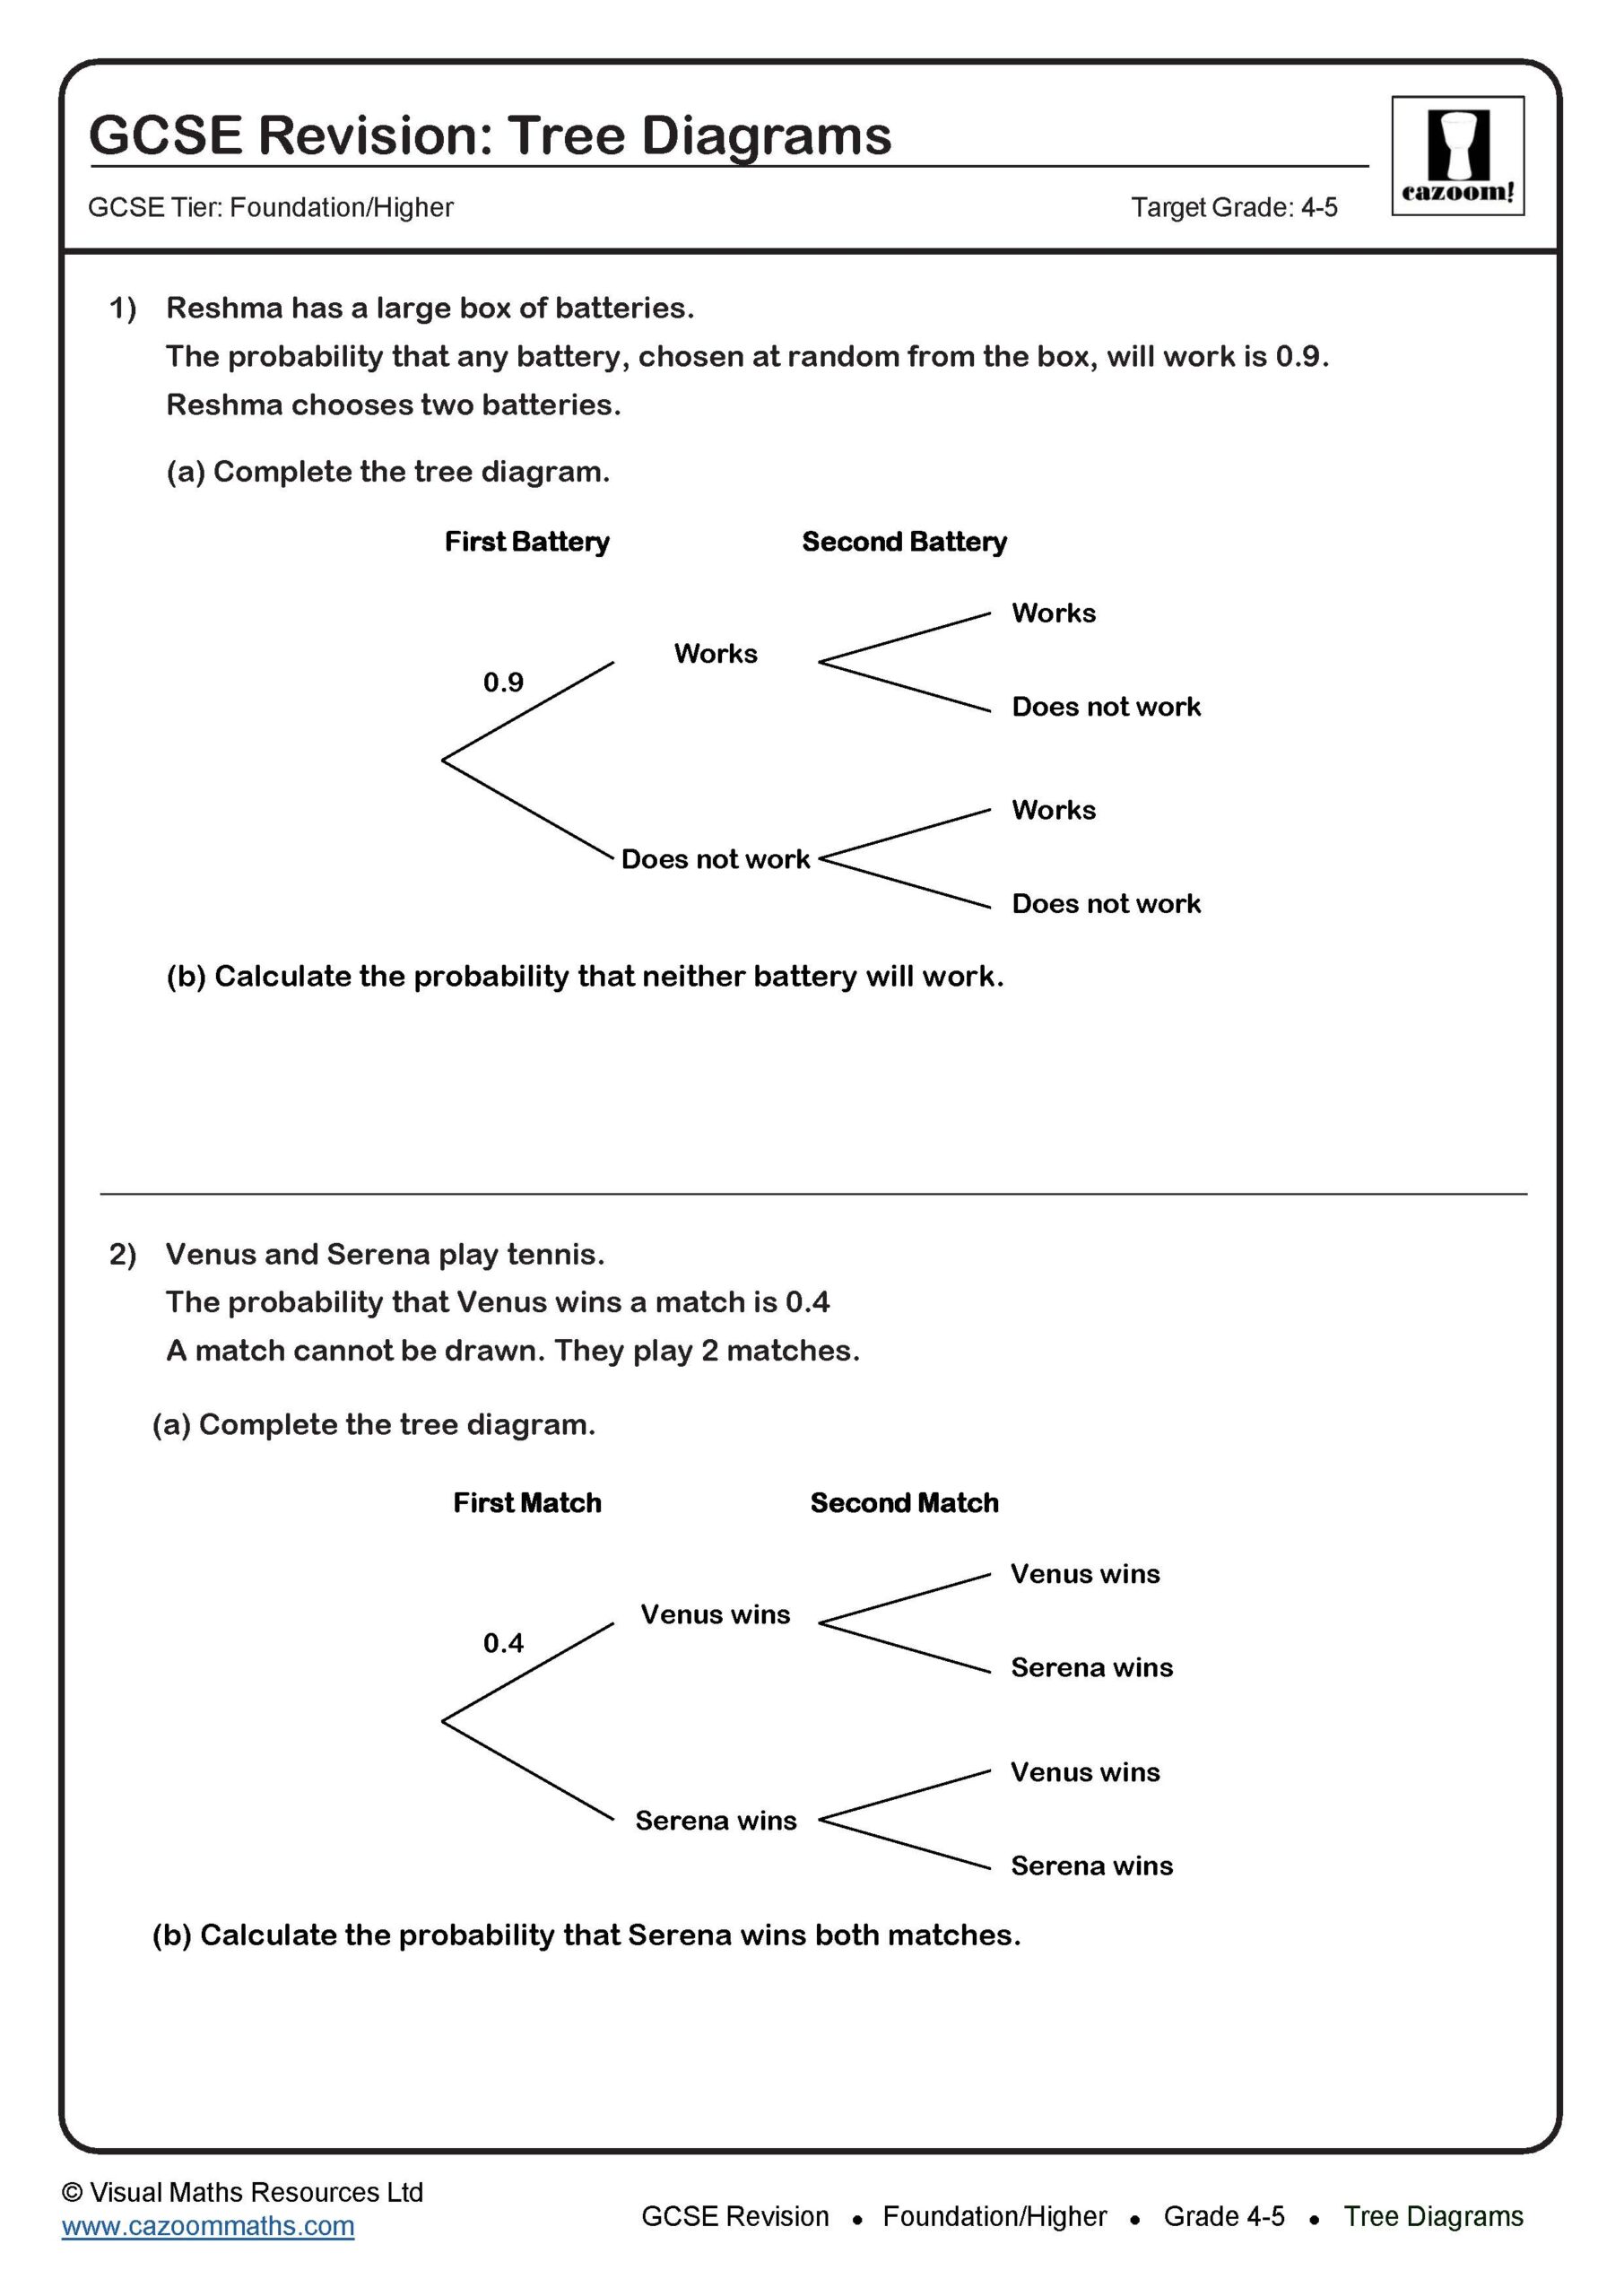
Tree Diagrams
Target Grade: 4-5
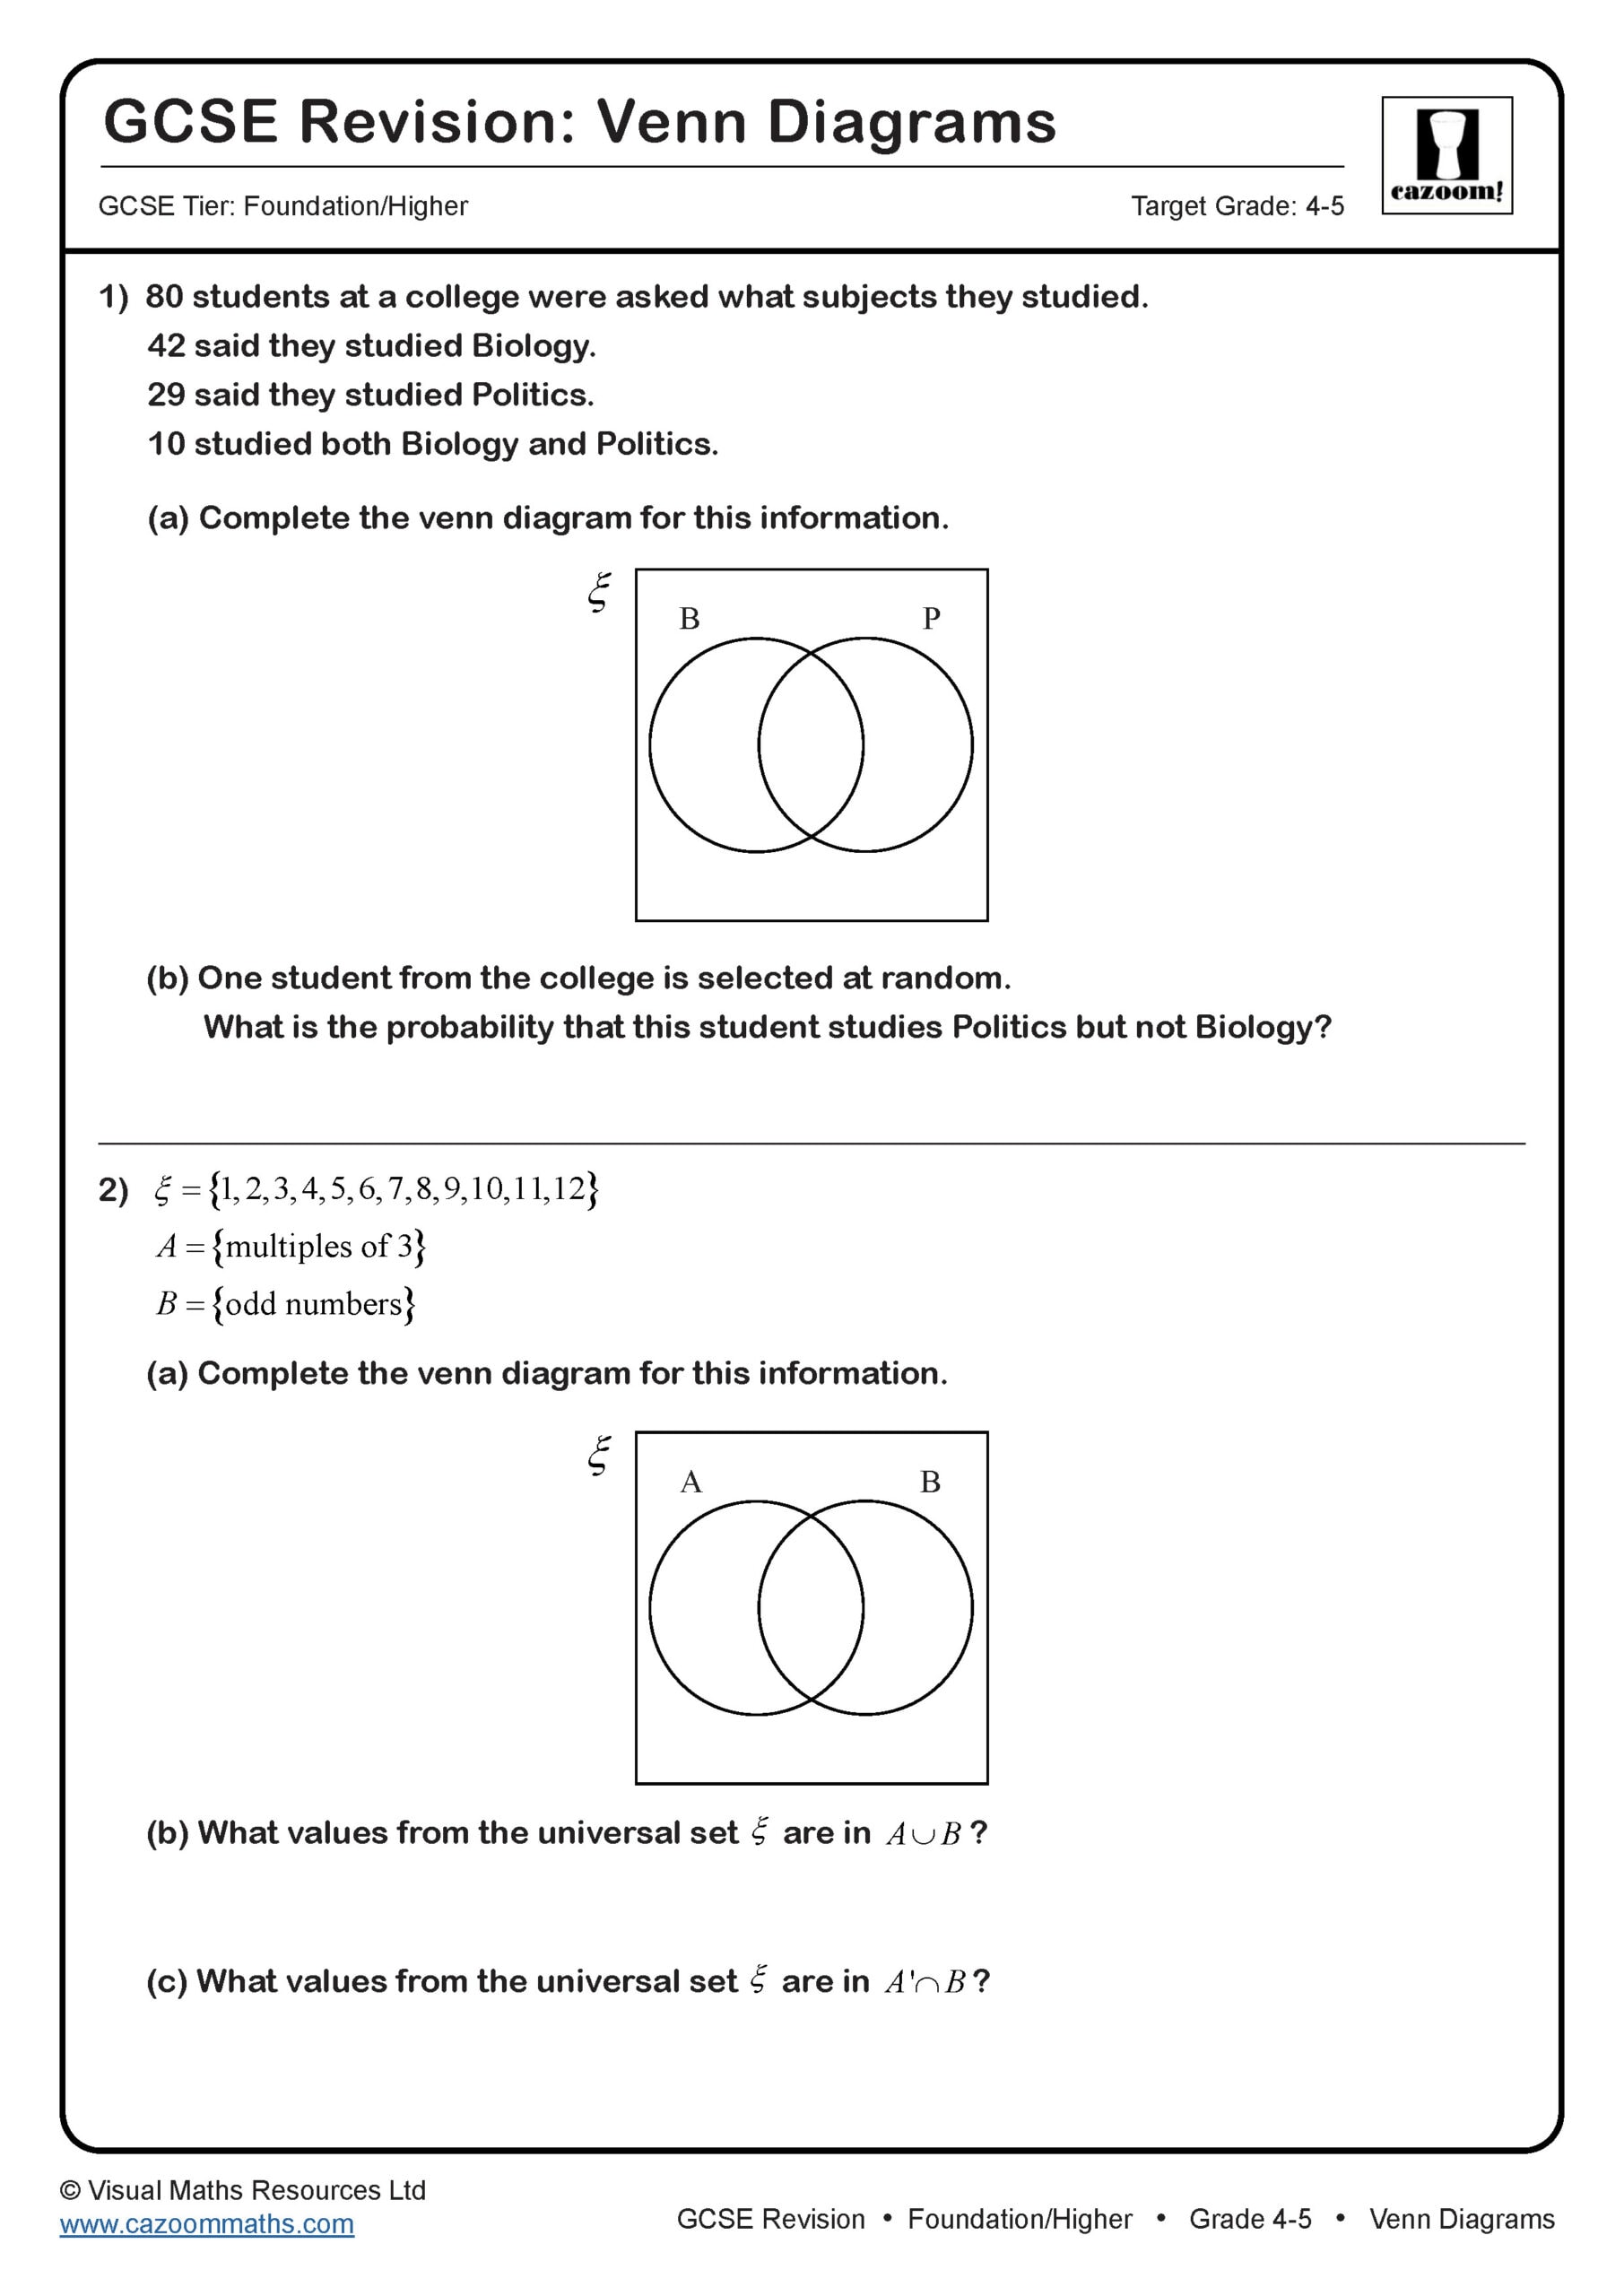
Venn Diagrams
Target Grade: 4-5
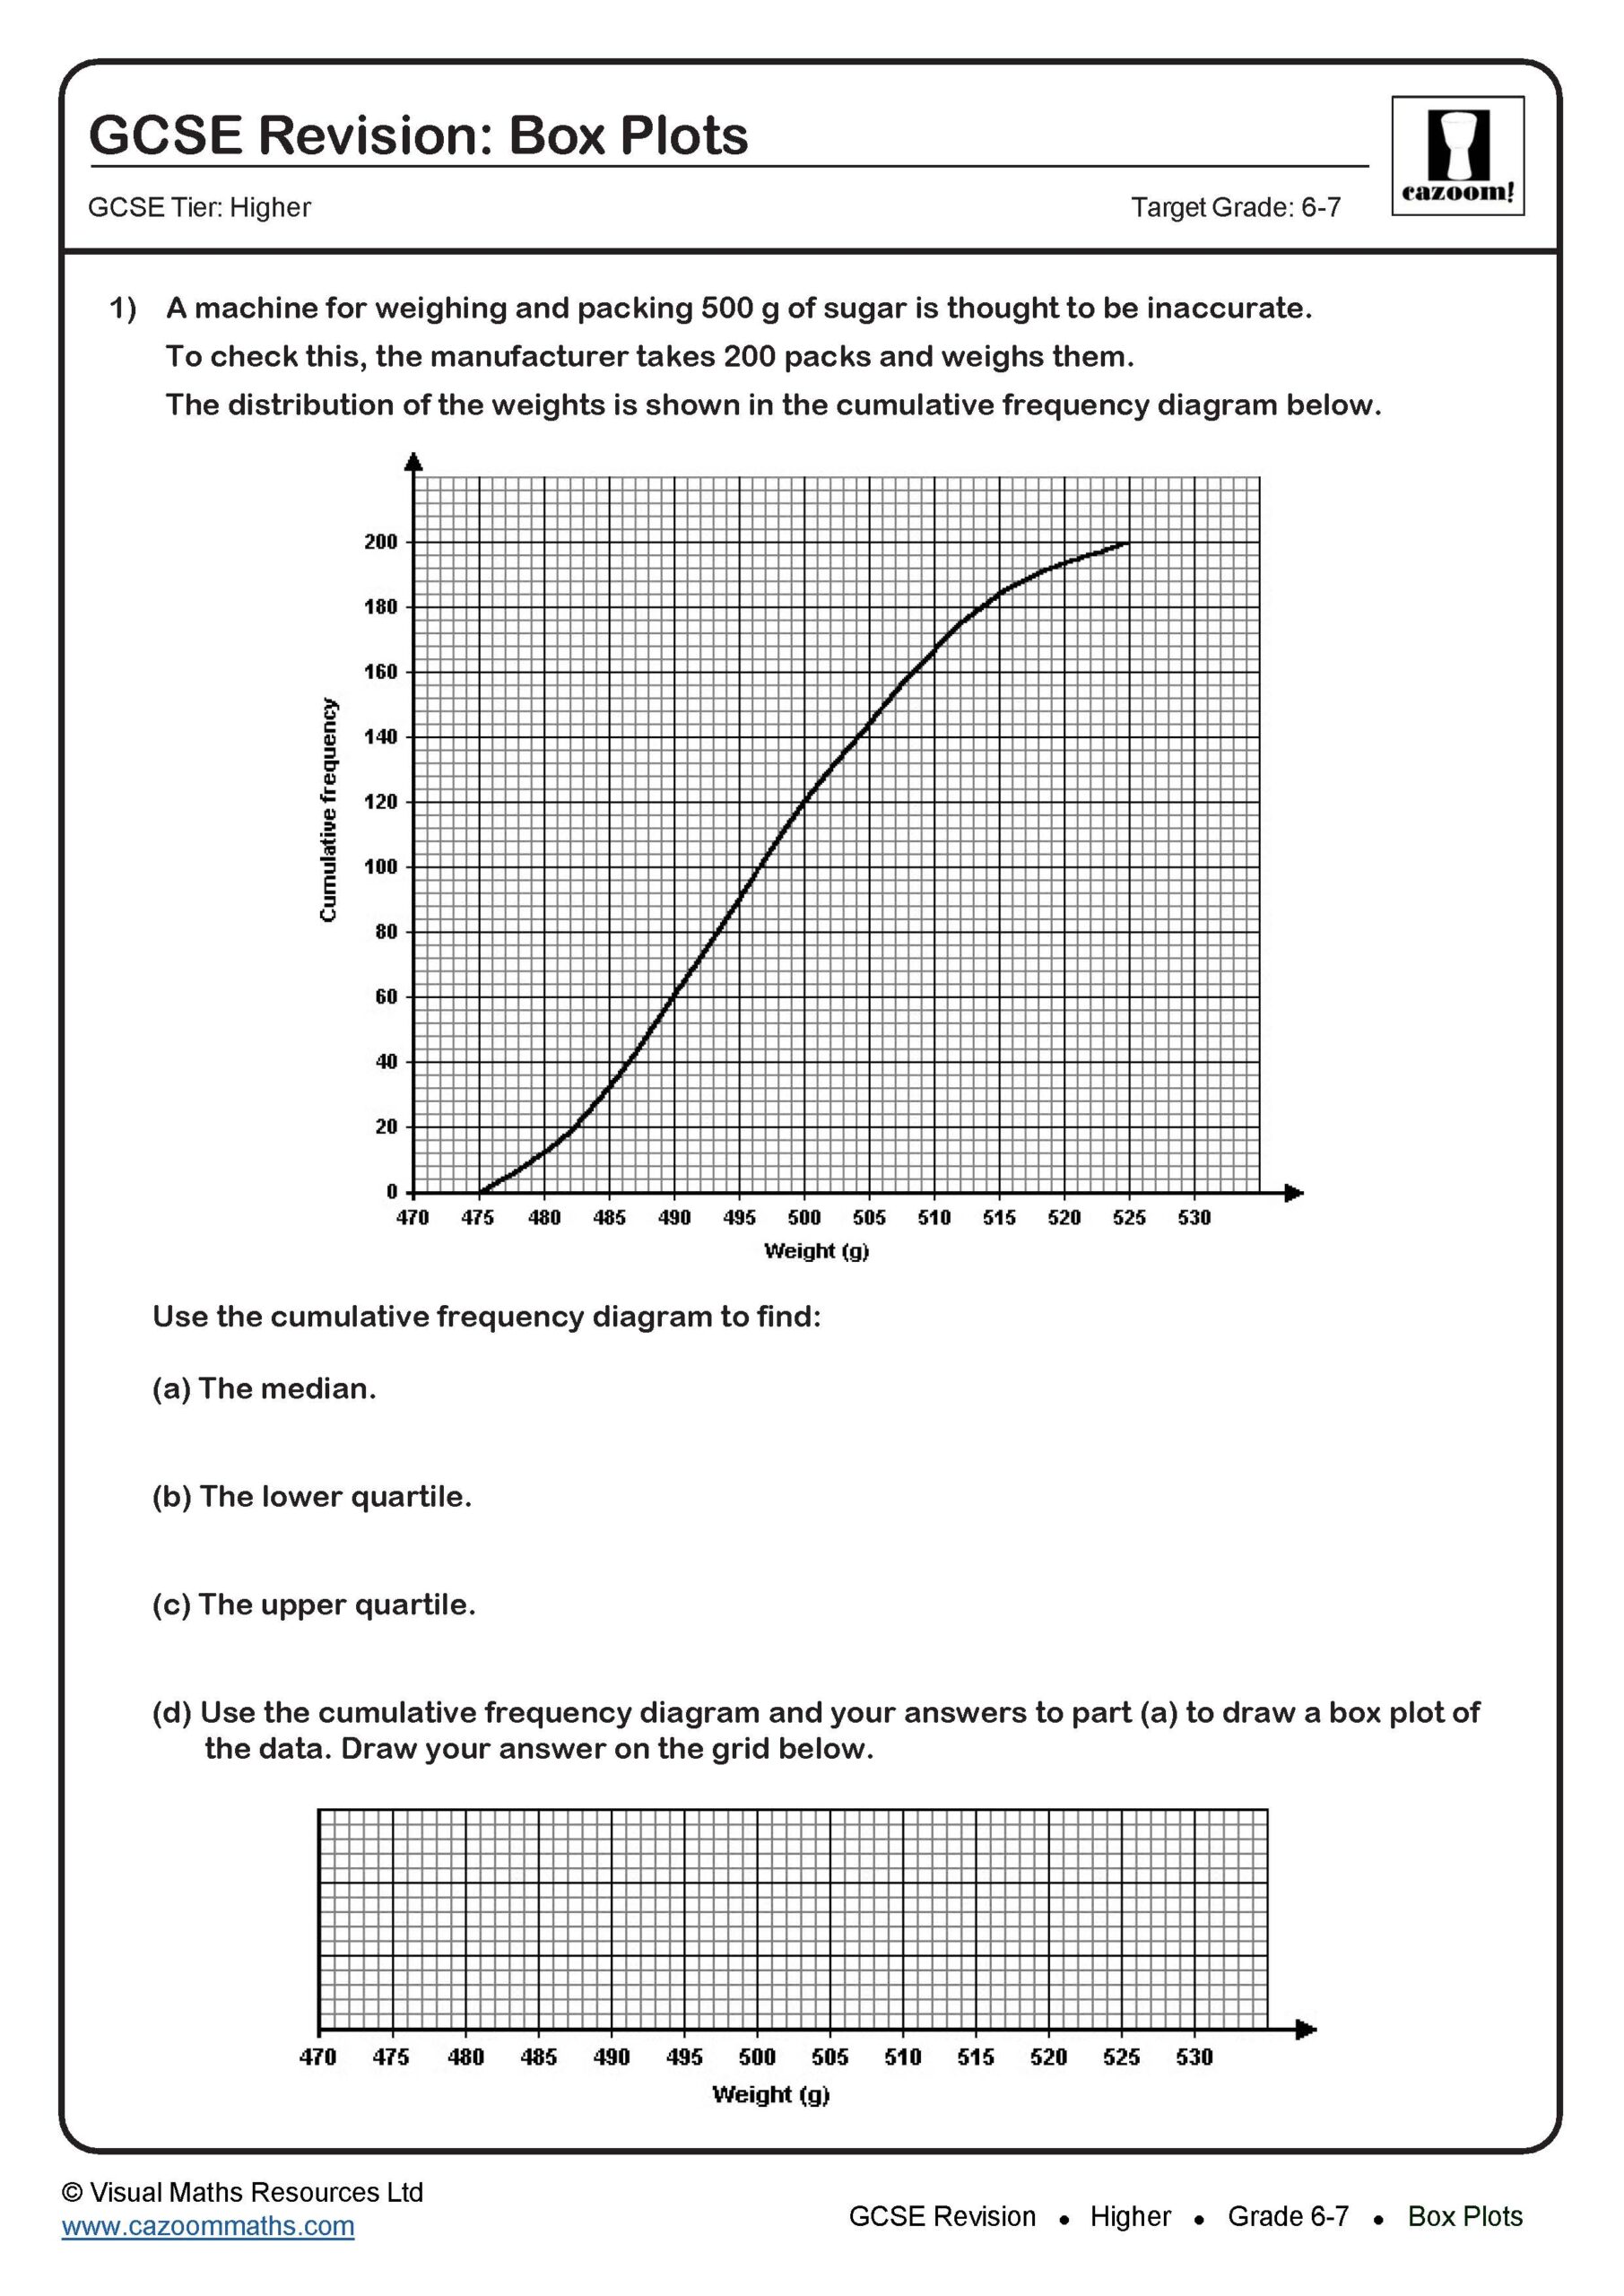
Box Plots
Target Grade: 6-7
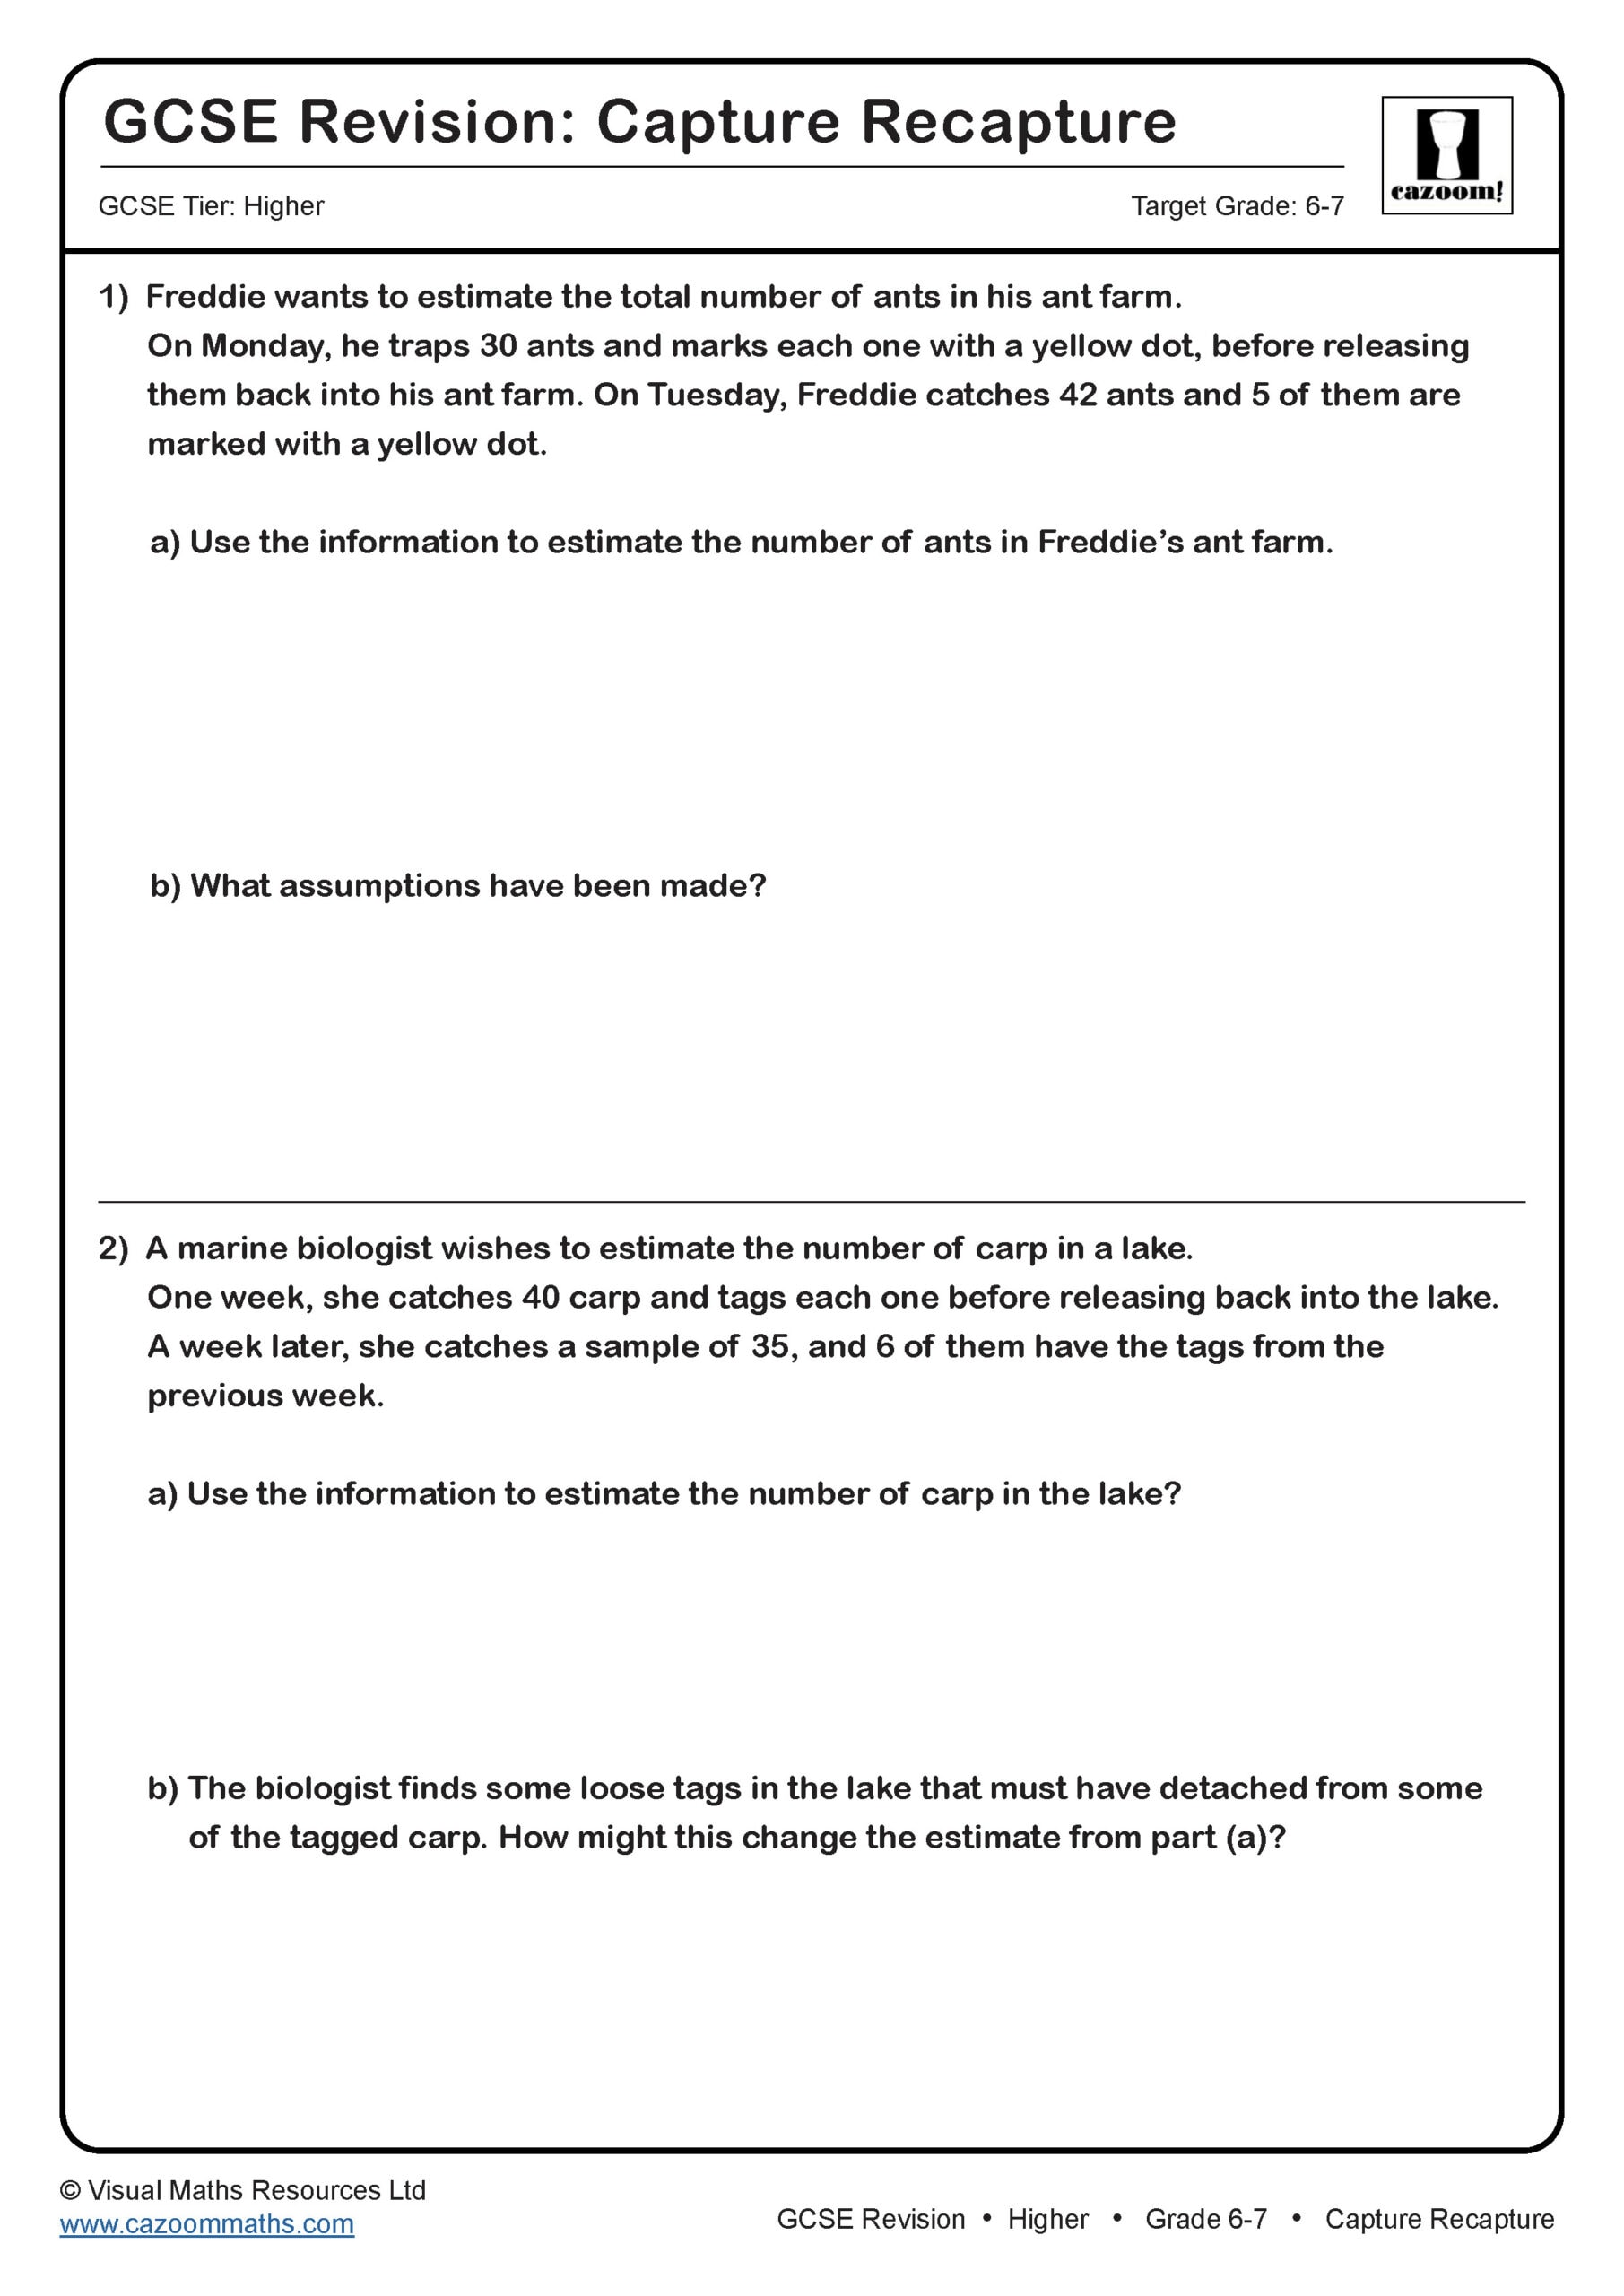
Capture Recapture
Target Grade: 6-7
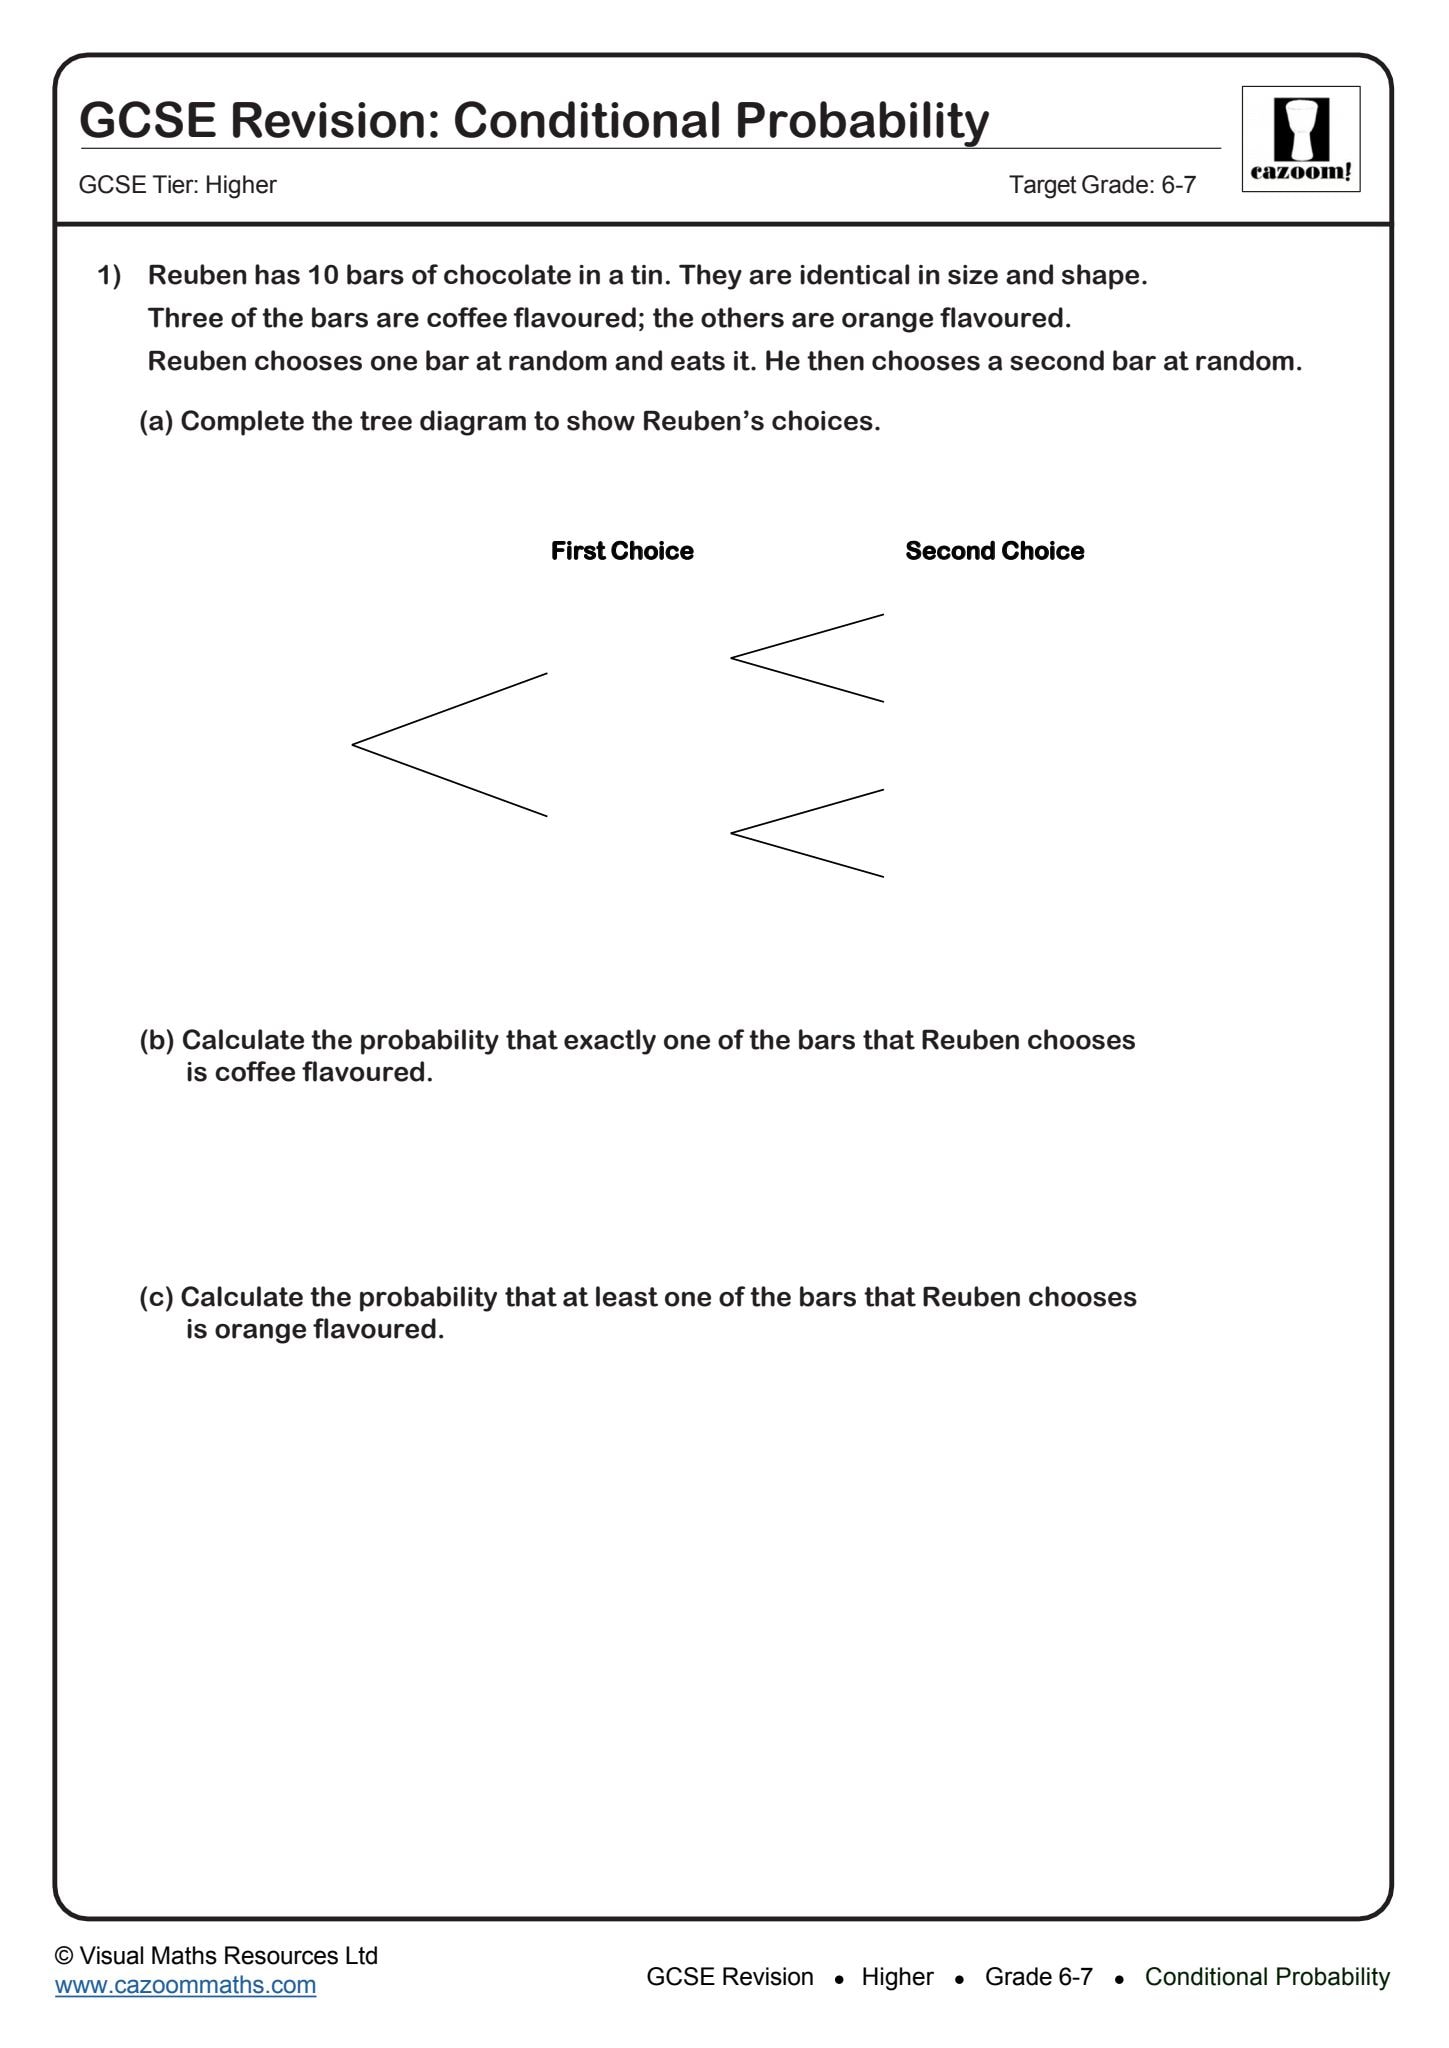
Conditional Probability
Target Grade: 6-7
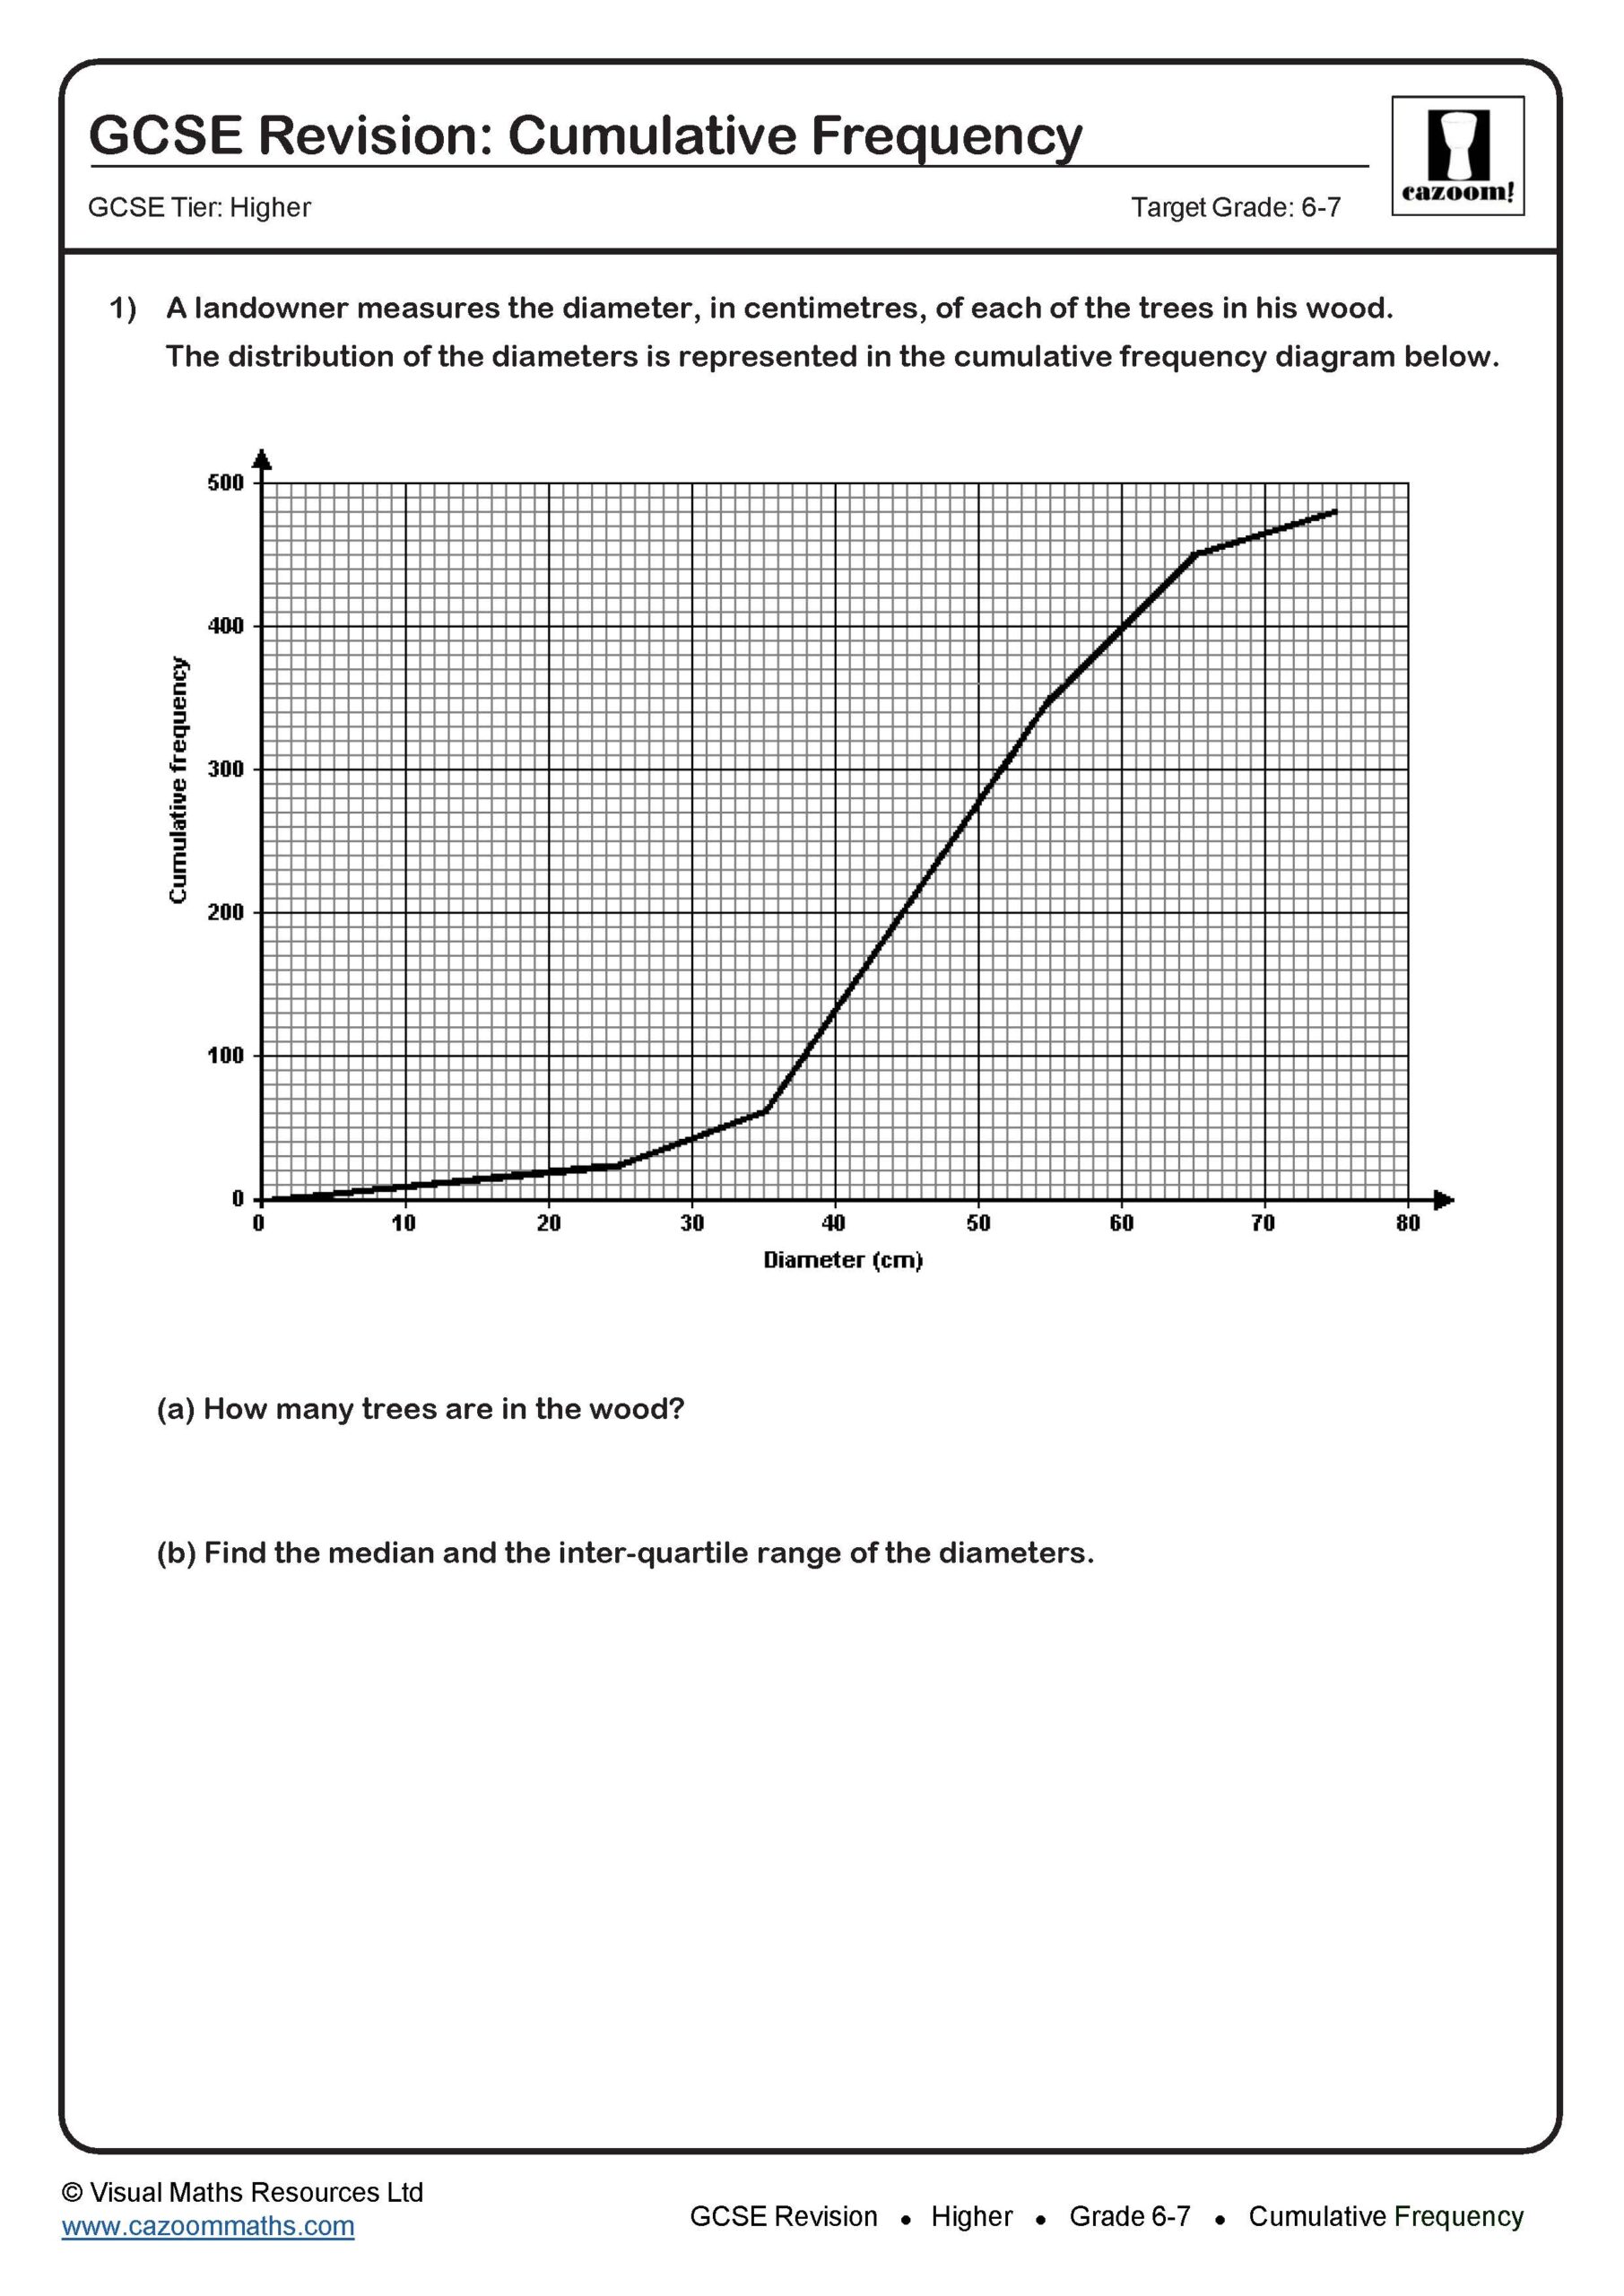
Cumulative Frequency
Target Grade: 6-7
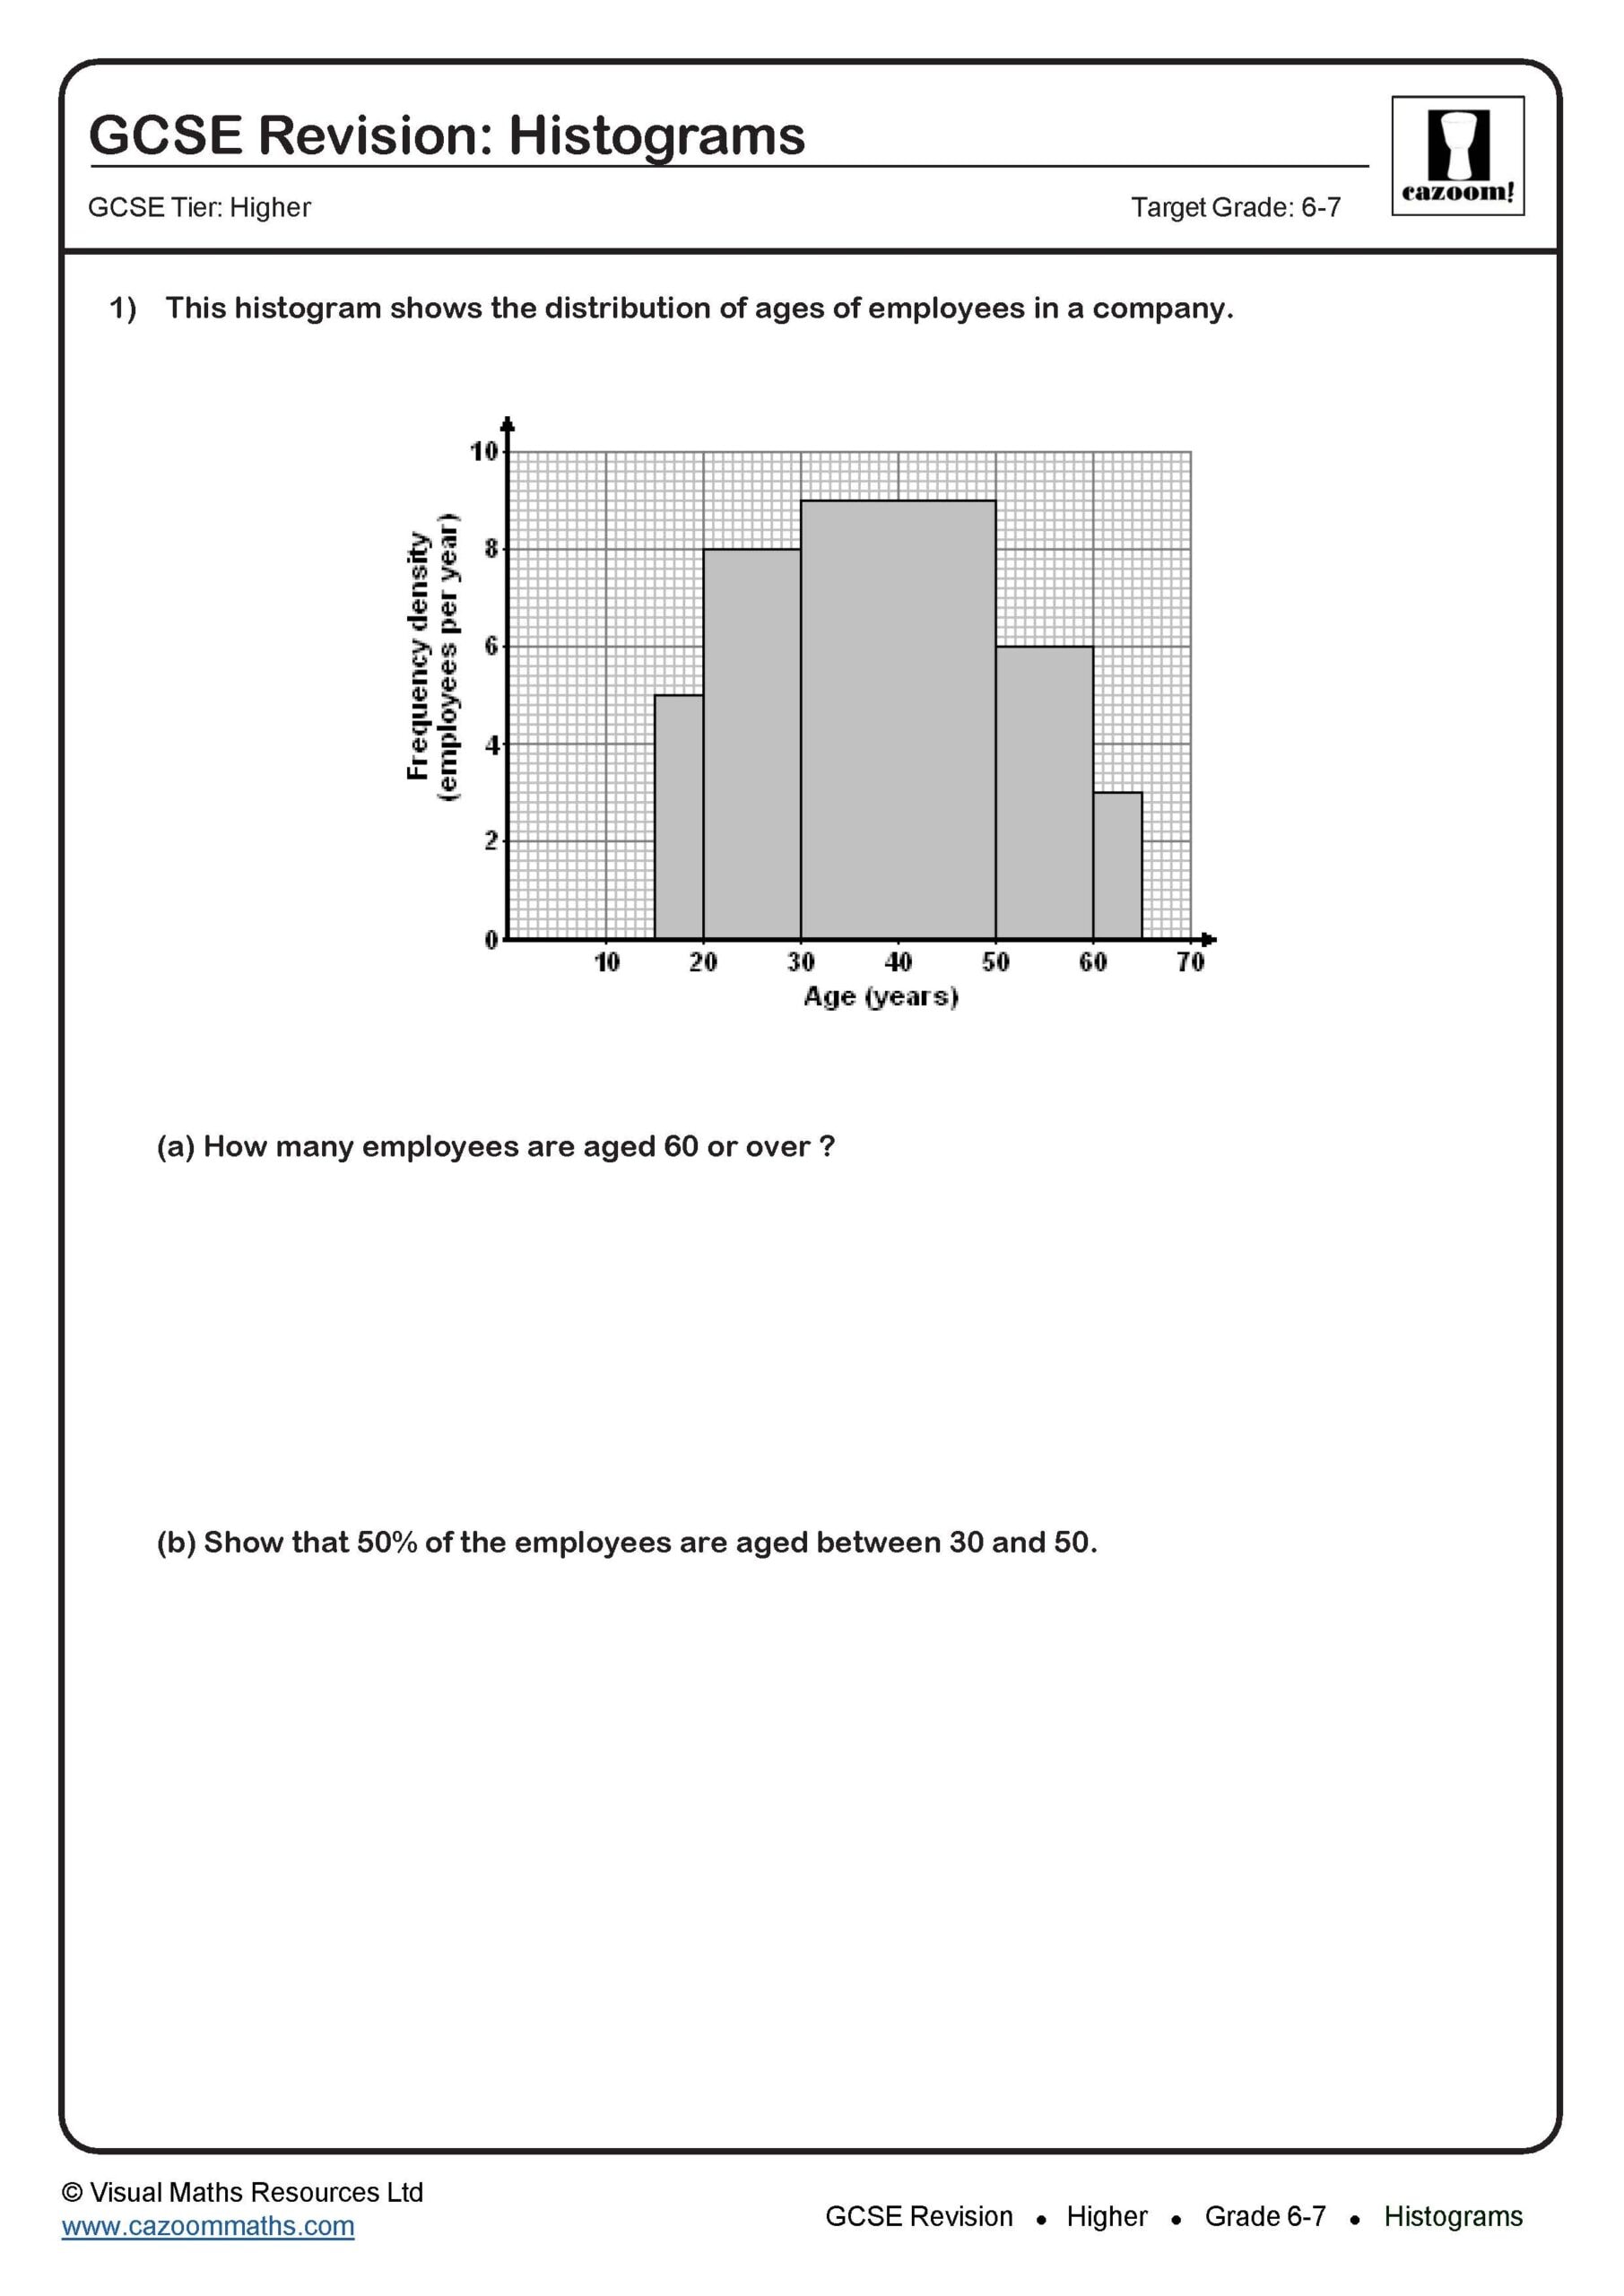
Histograms
Target Grade: 6-7
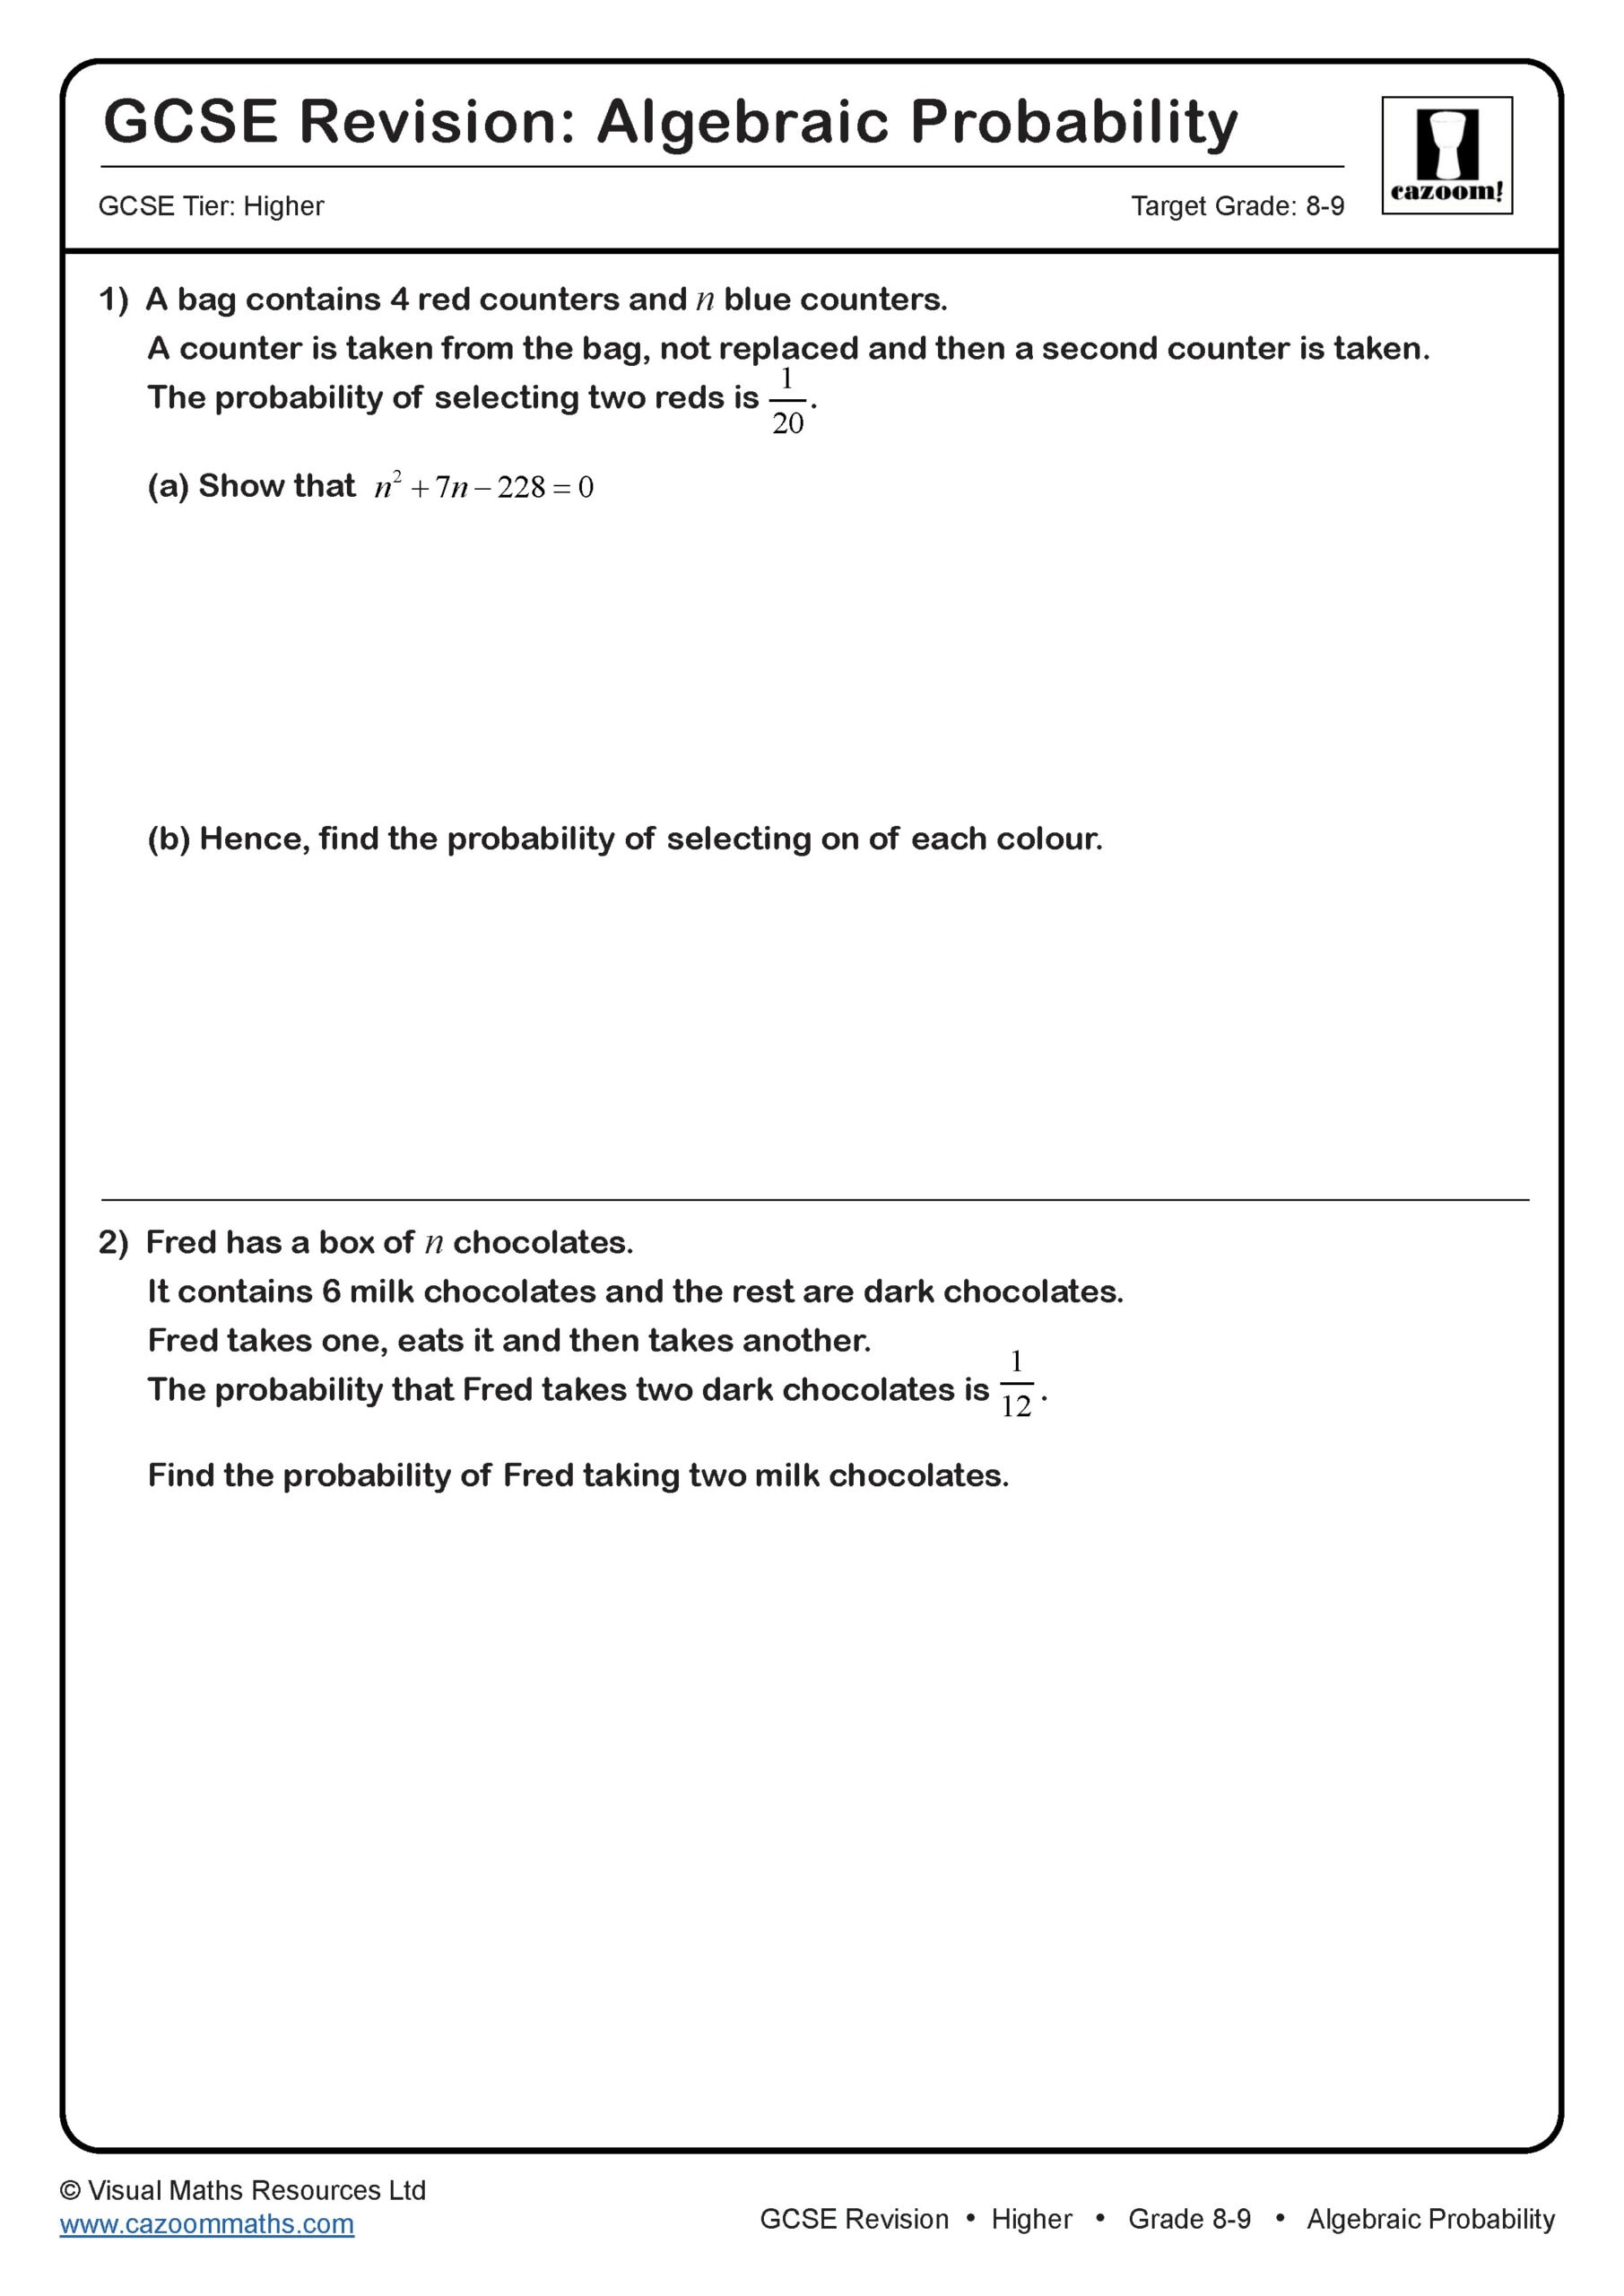
Algebraic Probabilty
Target Grade: 8-9
All worksheets are created by the team of experienced teachers at Cazoom Maths.
What topics do GCSE statistics worksheets cover?
GCSE statistics worksheets span the entire statistics and probability curriculum, from Foundation topics like pie charts, averages and basic probability through to Higher content including histograms, cumulative frequency, tree diagrams and conditional probability. At grades 8-9, students encounter algebraic probability, probability distributions and complex multi-stage problems that combine statistical reasoning with algebraic manipulation.
A probability and statistics worksheet should mirror exam question styles: students need practice interpreting real-world data, not just performing calculations. Examiners consistently award marks for correct interpretation of statistical diagrams, so revision must include reading values from cumulative frequency curves and comparing distributions using quartiles. Students lose marks when they calculate correctly but fail to write a conclusion that answers the question asked.
How are the statistics worksheets organised by grade?
The worksheets are structured across four grade bands that align with GCSE expectations. Grades 1-3 cover foundational data handling: bar charts, pictograms, averages, basic probability and two-way tables. Grades 4-5 introduce frequency polygons, stem and leaf diagrams, tree diagrams and scatter graphs. Grades 6-7 bring in cumulative frequency, box plots, histograms and the product rule for counting. Grades 8-9 focus on circle theorem proofs applied to probability, transforming probability distributions and complex conditional probability.
Foundation tier students should concentrate on grades 1-5, ensuring fluency with frequency tables, relative frequency and comparing data sets. Higher tier students working at grades 4-9 need particular attention to histograms (where frequency density causes persistent confusion) and conditional probability, which regularly appears as a challenging final question worth four or five marks.
How is statistics tested in GCSE maths exams?
Statistics questions appear across all three GCSE maths papers, typically worth 15-20 marks per paper. Foundation papers test drawing and interpreting statistical diagrams, calculating averages from tables, and basic probability calculations including relative frequency and simple tree diagrams. Higher papers add multi-step problems: drawing histograms from grouped data, interpreting cumulative frequency graphs to find quartiles, and conditional probability questions that require systematic working through probability trees or two-way tables.
Examiners award method marks for correct processes even when final answers are wrong, so students must show full working. A common error is misreading histogram scales: students forget that area represents frequency when bars have unequal widths. In probability questions, marks are lost when tree diagram branches don't sum to one or when students multiply probabilities instead of adding them for 'or' situations. Time management matters because higher-grade statistics questions often appear late in papers.
What revision strategies work best for GCSE statistics?
Effective statistics revision combines regular practice with deliberate focus on weak topics. Students should work through worksheets under timed conditions, allowing roughly one minute per mark as in the actual exam. Spaced repetition works well: return to histogram questions or conditional probability problems weekly rather than cramming everything in one session. Teachers notice that students who annotate diagrams (labelling axes carefully, marking cumulative frequency points clearly) make fewer errors than those who rush straight to calculations.
These worksheets work well as starter activities for identifying gaps before moving to past papers. Set homework targeting specific weak areas: if a student struggles with tree diagrams, complete three different tree diagram worksheets before attempting full exam questions. Pairing worksheet practice with mark scheme analysis helps students understand exactly what examiners expect. Foundation students benefit from repeated practice interpreting different chart types, whilst Higher students need exposure to unfamiliar contexts that require statistical reasoning rather than formula application.