Trigonometric Graphs Worksheets
All worksheets are created by the team of experienced teachers at Cazoom Maths.
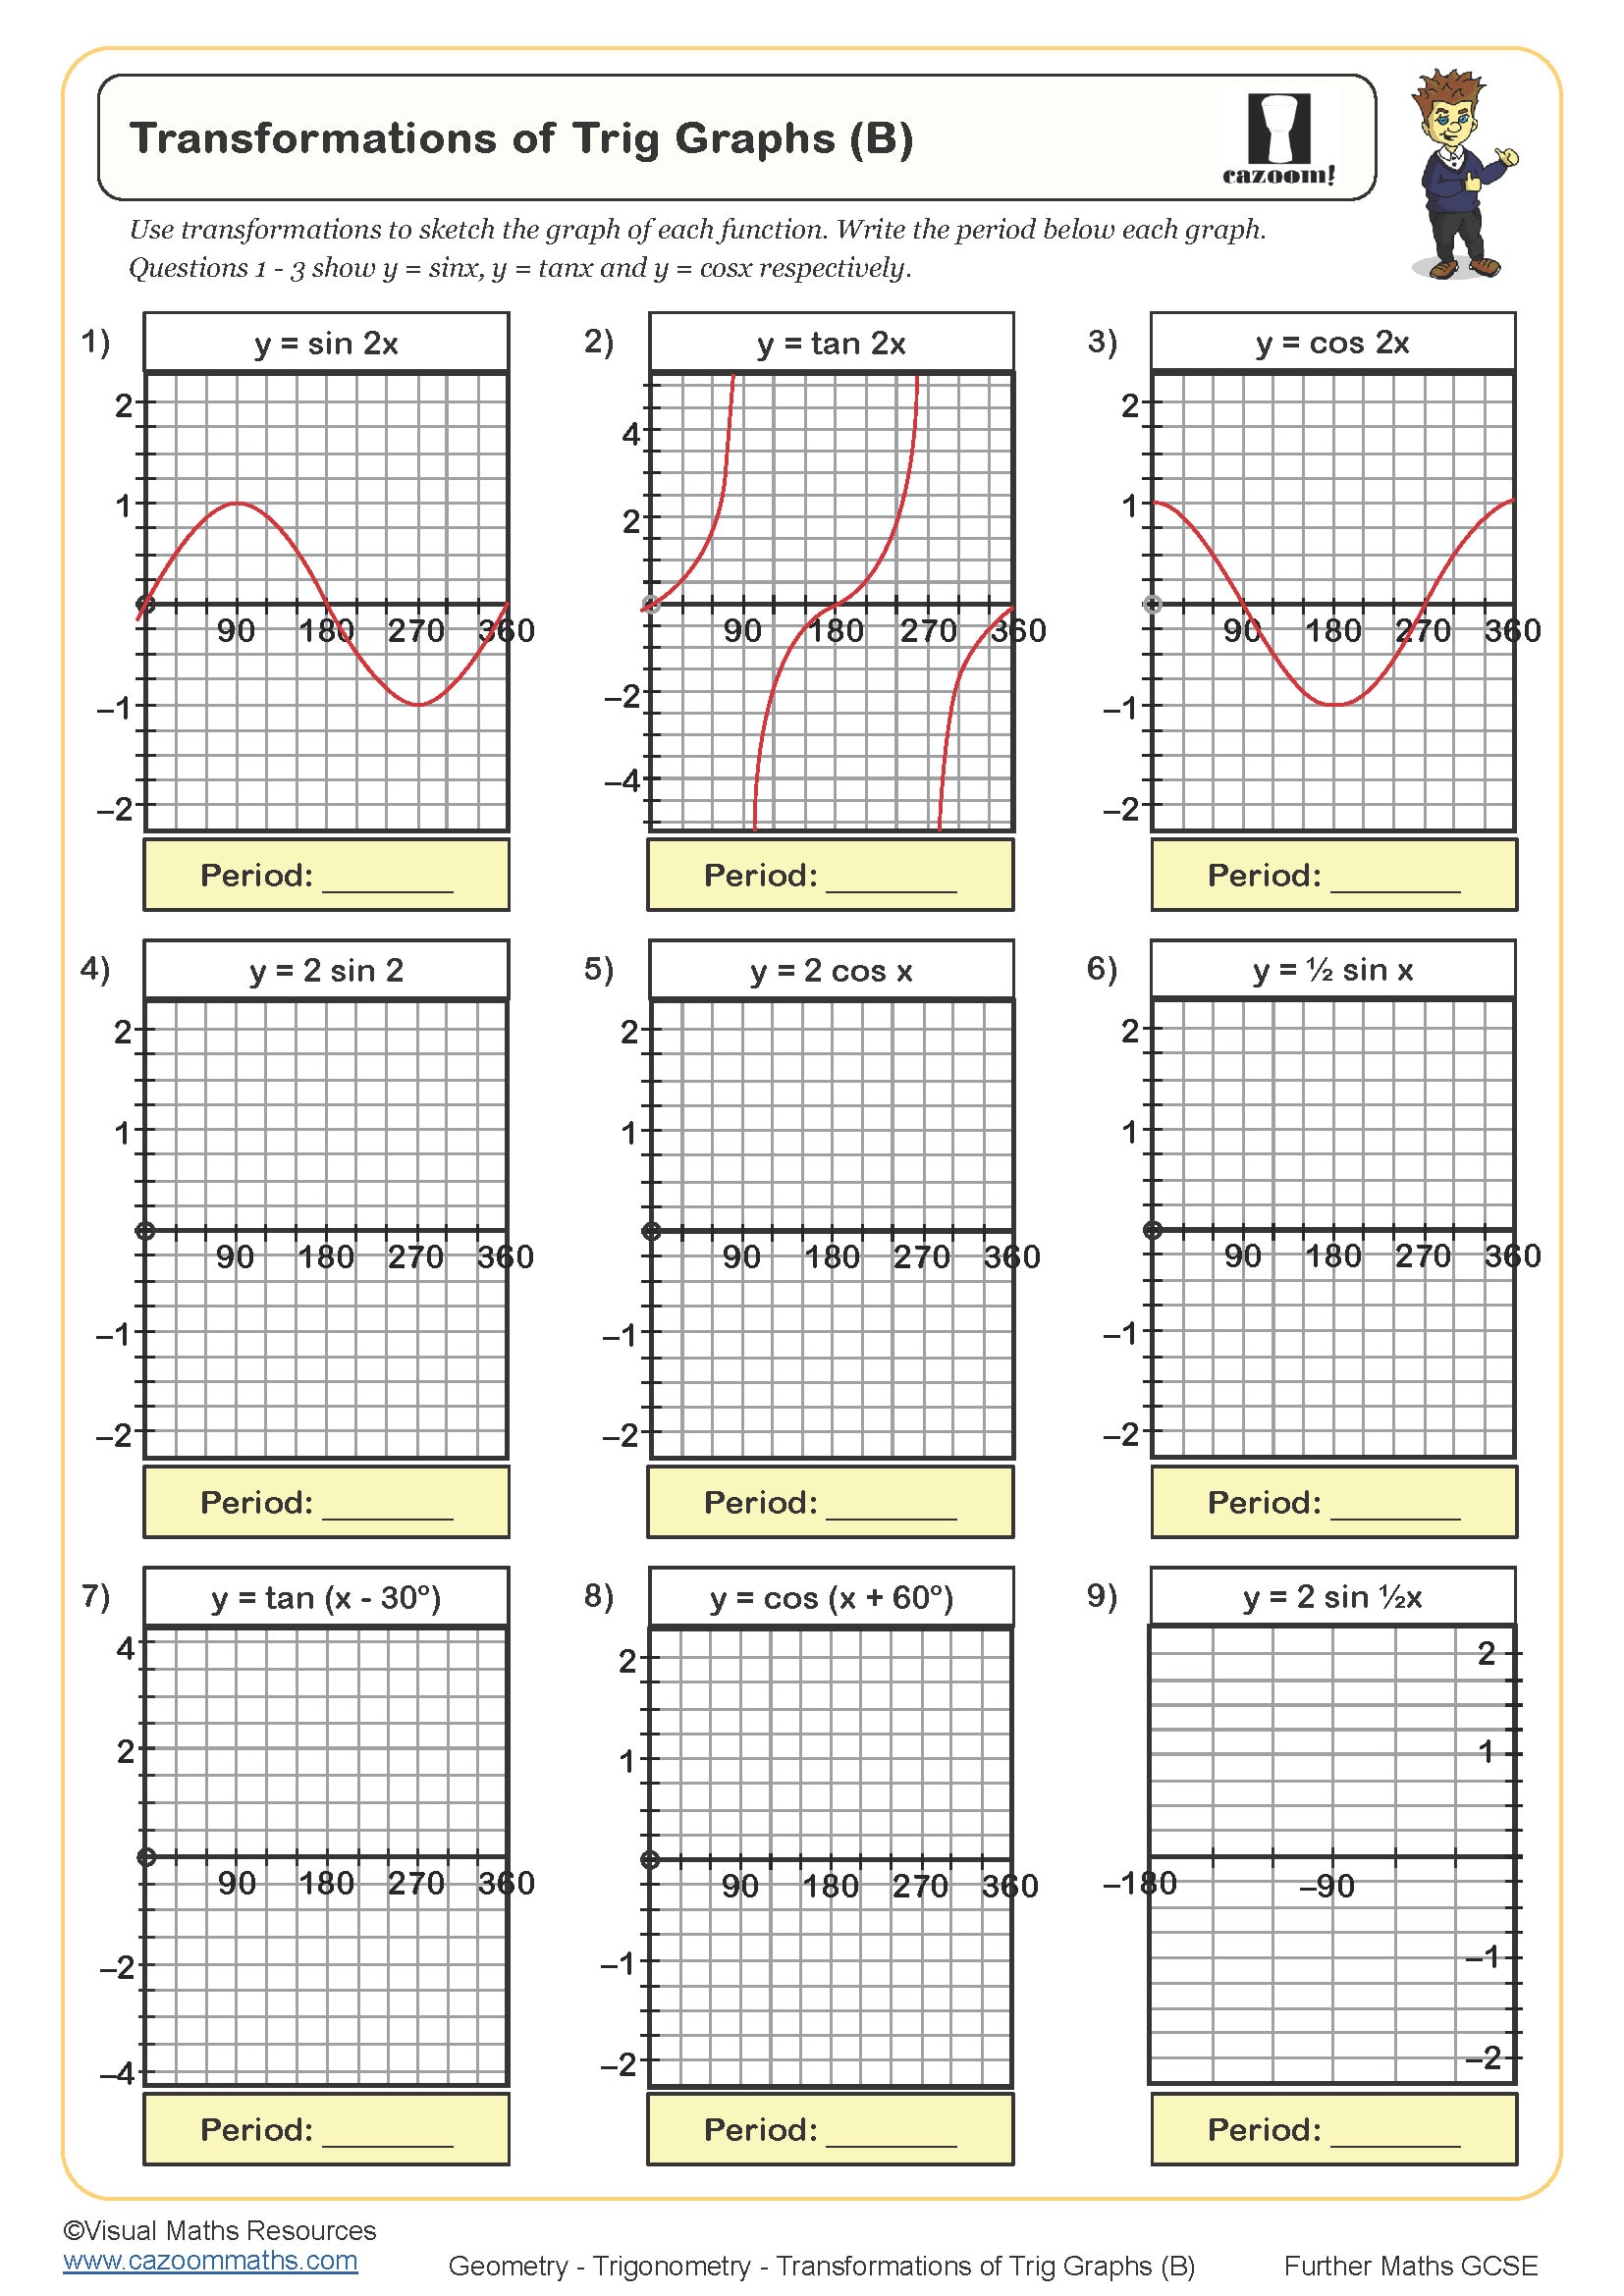
What are the key features of trigonometric graphs that students need to identify?
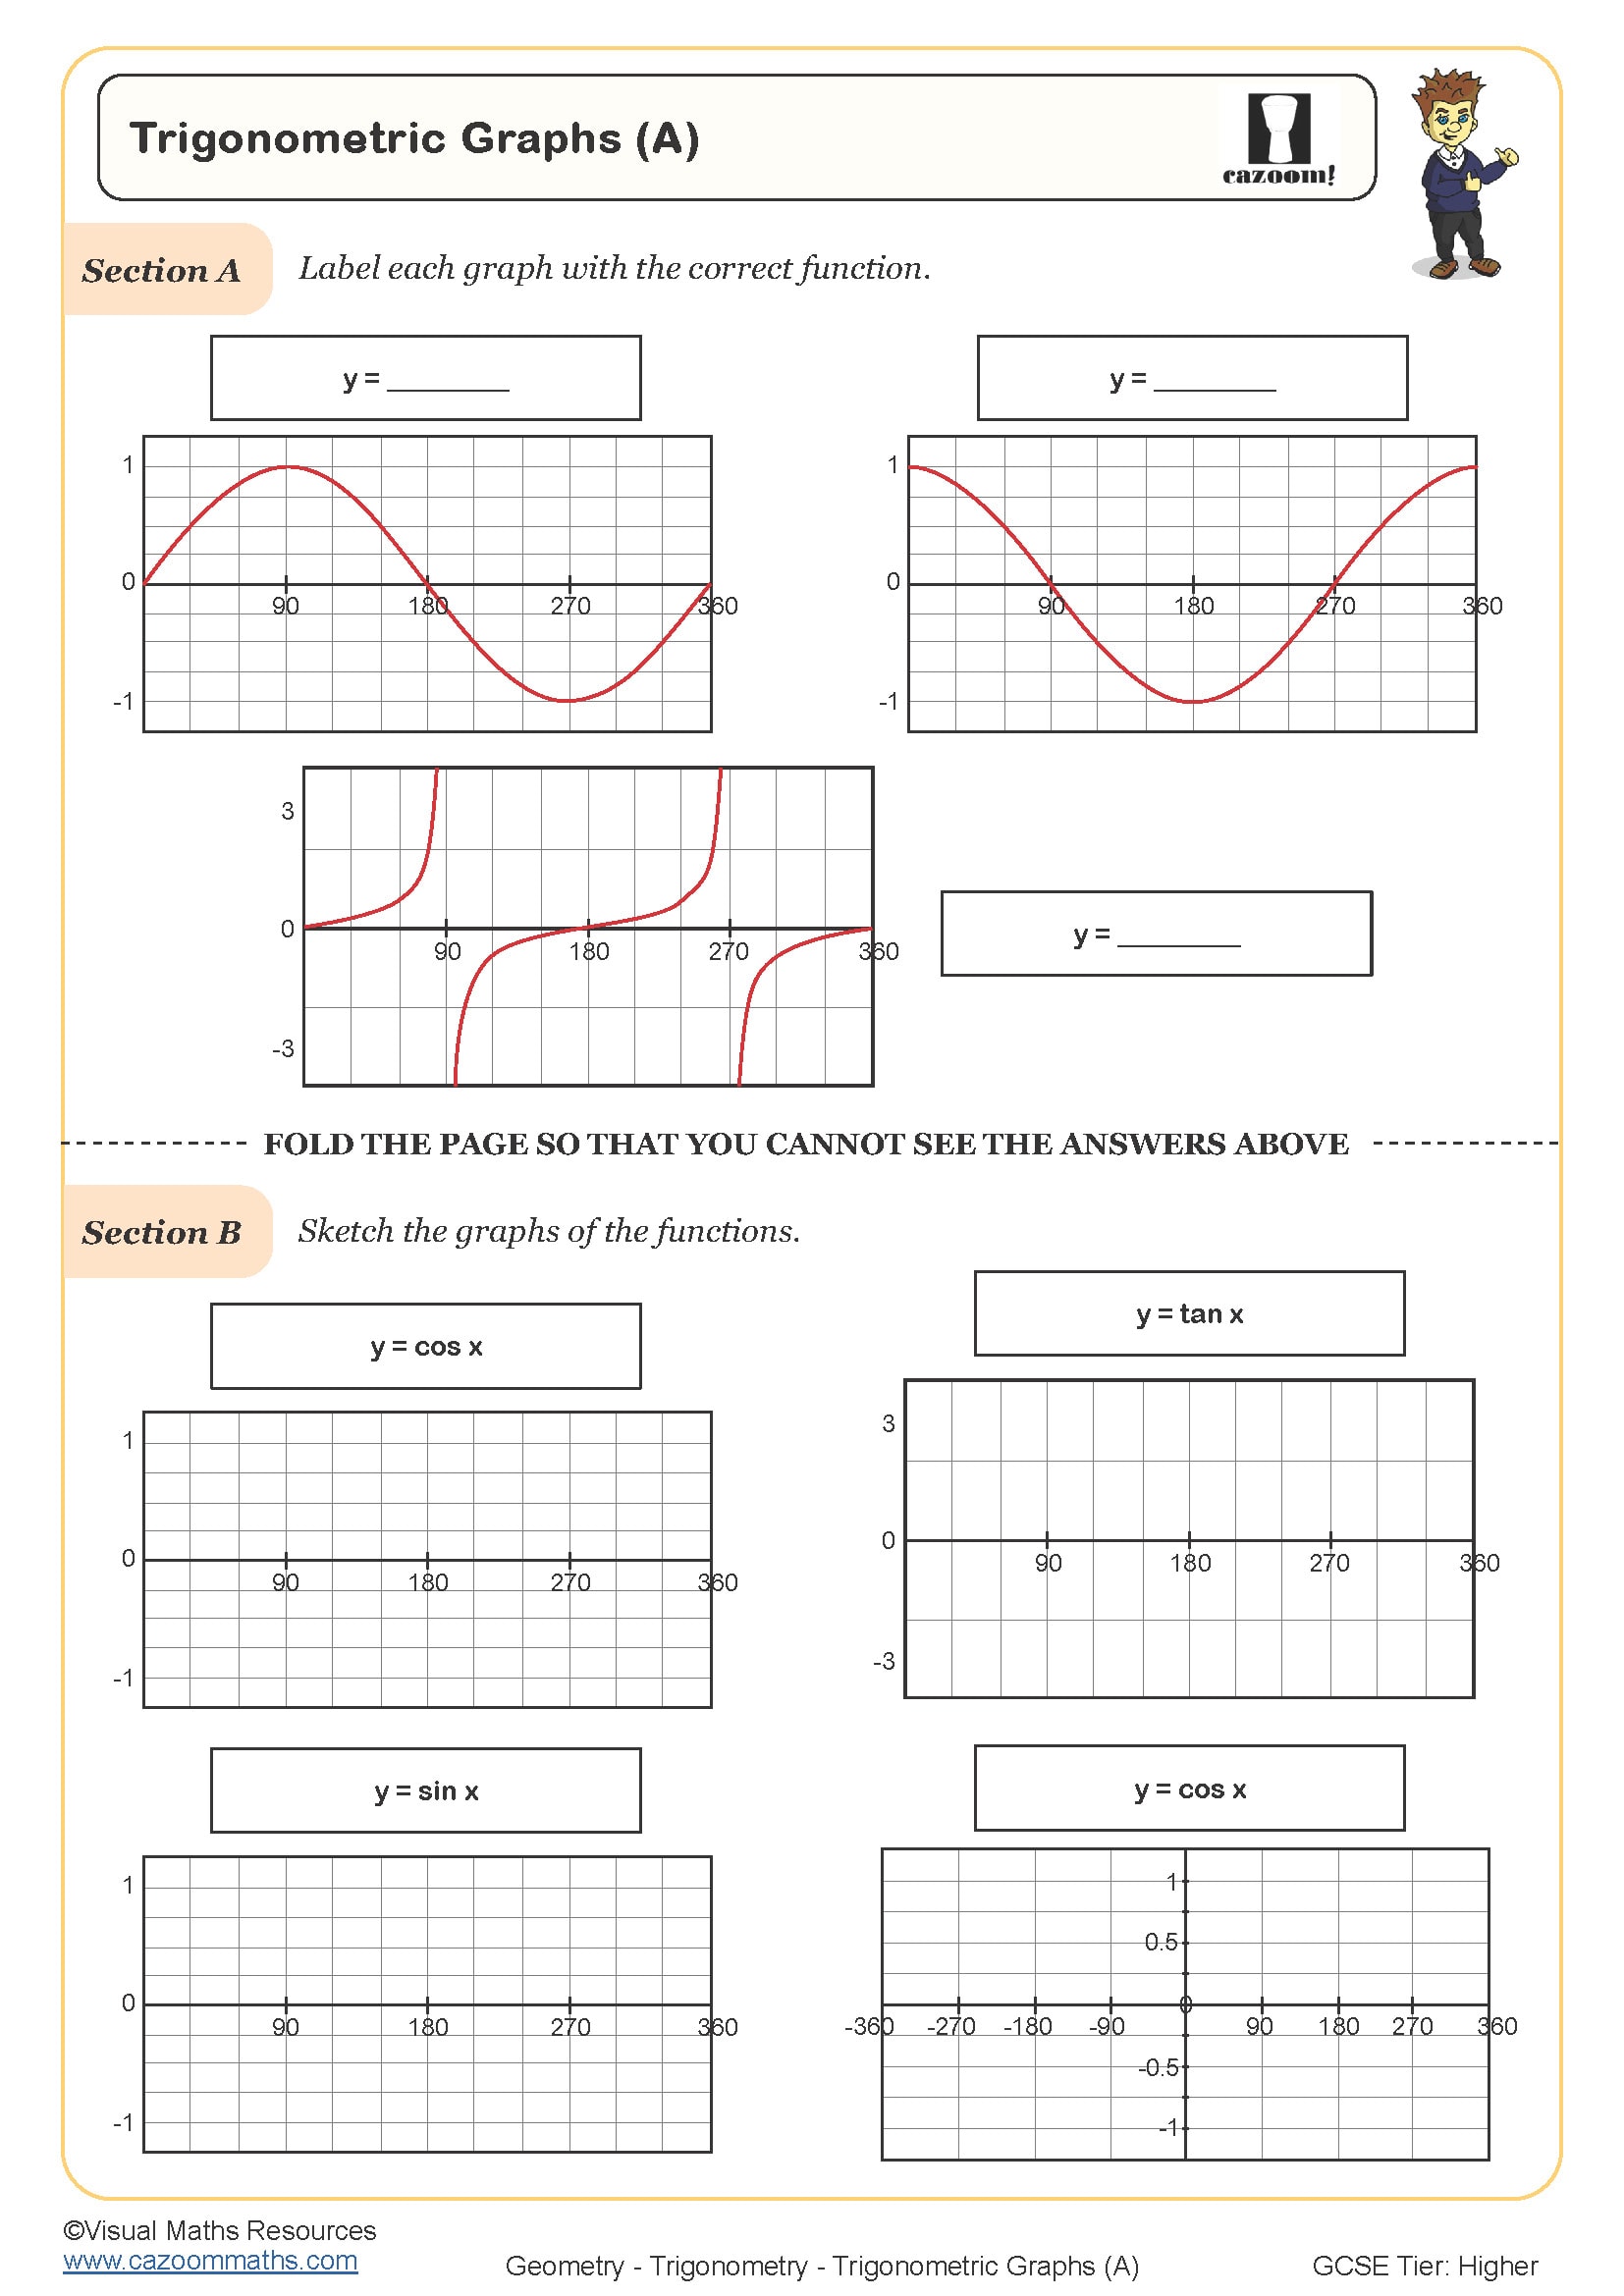
Students working with trigonometric graphs must identify amplitude (the height of the wave), period (the length of one complete cycle), and any vertical or horizontal translations. For y = sin x and y = cos x, the standard amplitude is 1 and the period is 360°, whilst y = tan x has no amplitude limit and a period of 180°. The graphs also require knowledge of key coordinates, such as where each function crosses the axes and reaches maximum or minimum values.
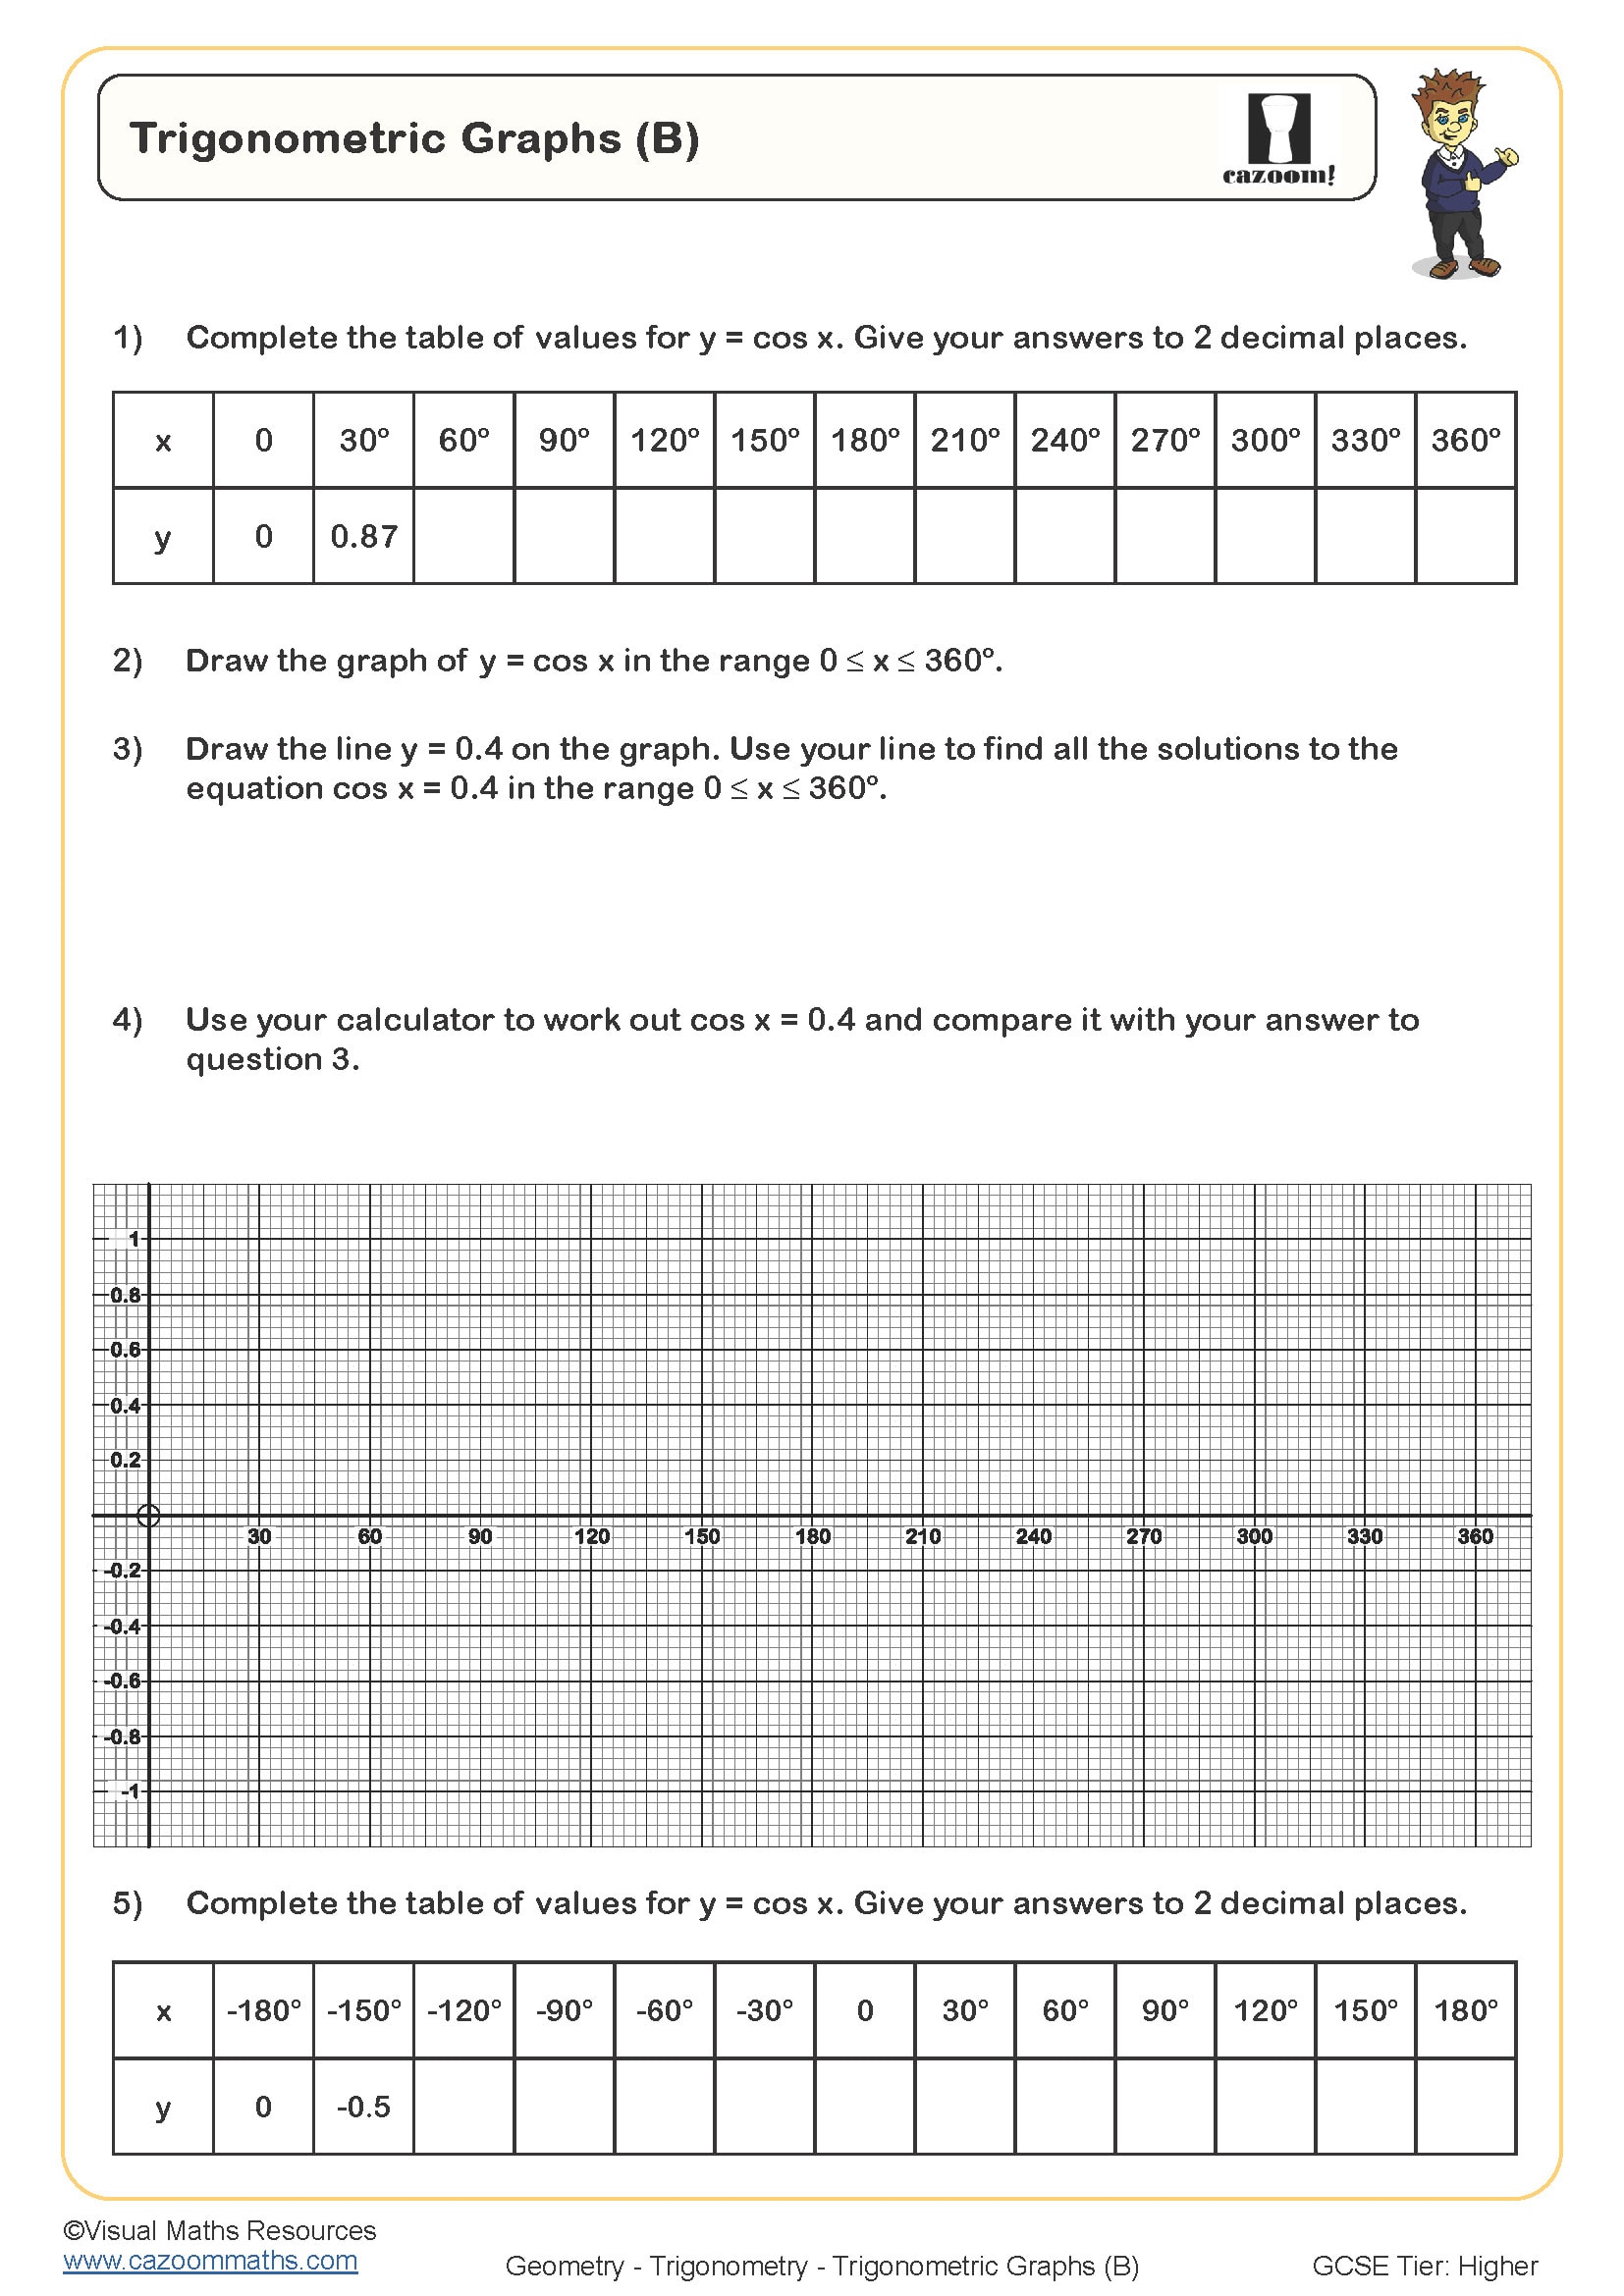
Many students lose marks in GCSE questions by confusing the period with the frequency or by incorrectly applying transformations in the wrong order. Teachers observe that students often sketch sine and cosine graphs that look correct at first glance but have incorrect scales on the x-axis, leading to errors when reading off specific values or solving trigonometric equations graphically.
Which year groups study trigonometric graphs in the UK curriculum?
Trigonometric graphs appear in the Year 10 and Year 11 curriculum as part of the higher tier GCSE mathematics specification. Students at KS4 are expected to sketch and interpret graphs of y = sin x, y = cos x, and y = tan x for angles of any size, and to apply transformations such as y = a sin bx or y = cos(x + c). This topic builds on earlier work with straight-line graphs and introduces the concept of periodic functions.
The progression across Year 10 and Year 11 involves moving from plotting basic trigonometric graphs using calculators and coordinates to sketching transformed graphs from understanding how coefficients affect the function. By Year 11, students should recognise trigonometric graphs without plotting points and use them to solve equations, a skill that connects directly to mechanics problems at A-level where wave motion and oscillations feature prominently.
How do amplitude and period transformations affect trigonometric graphs?
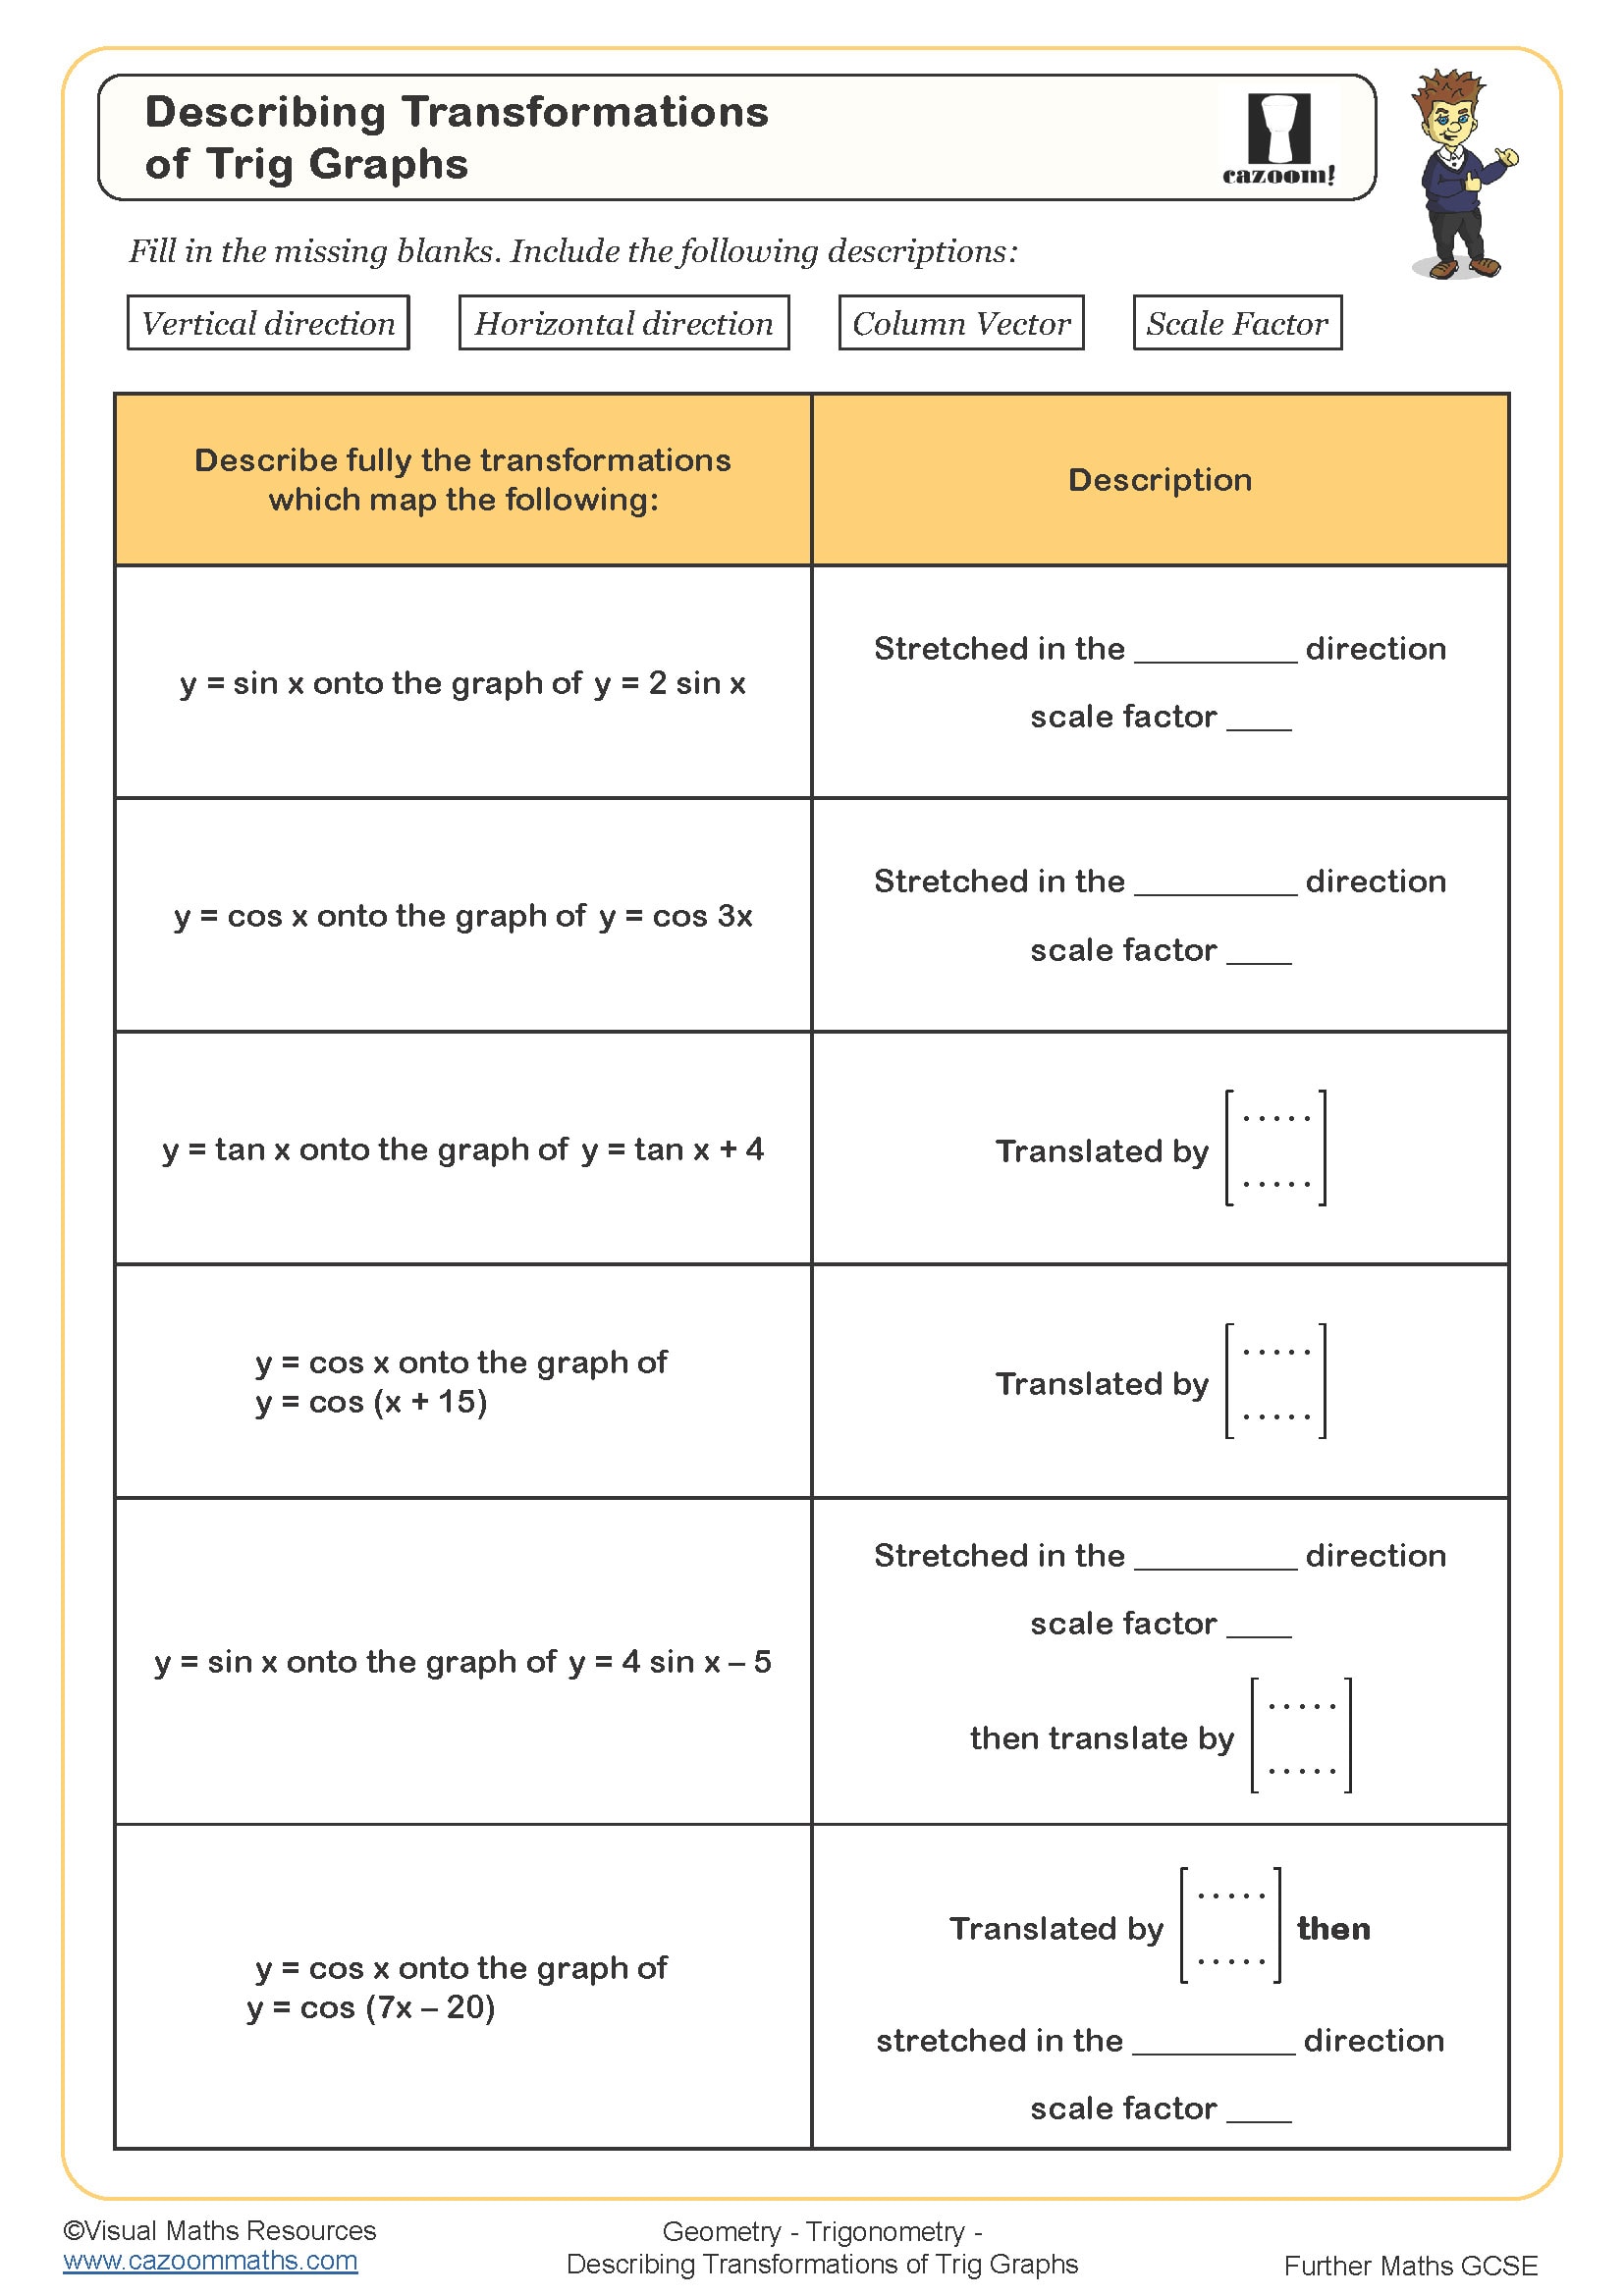
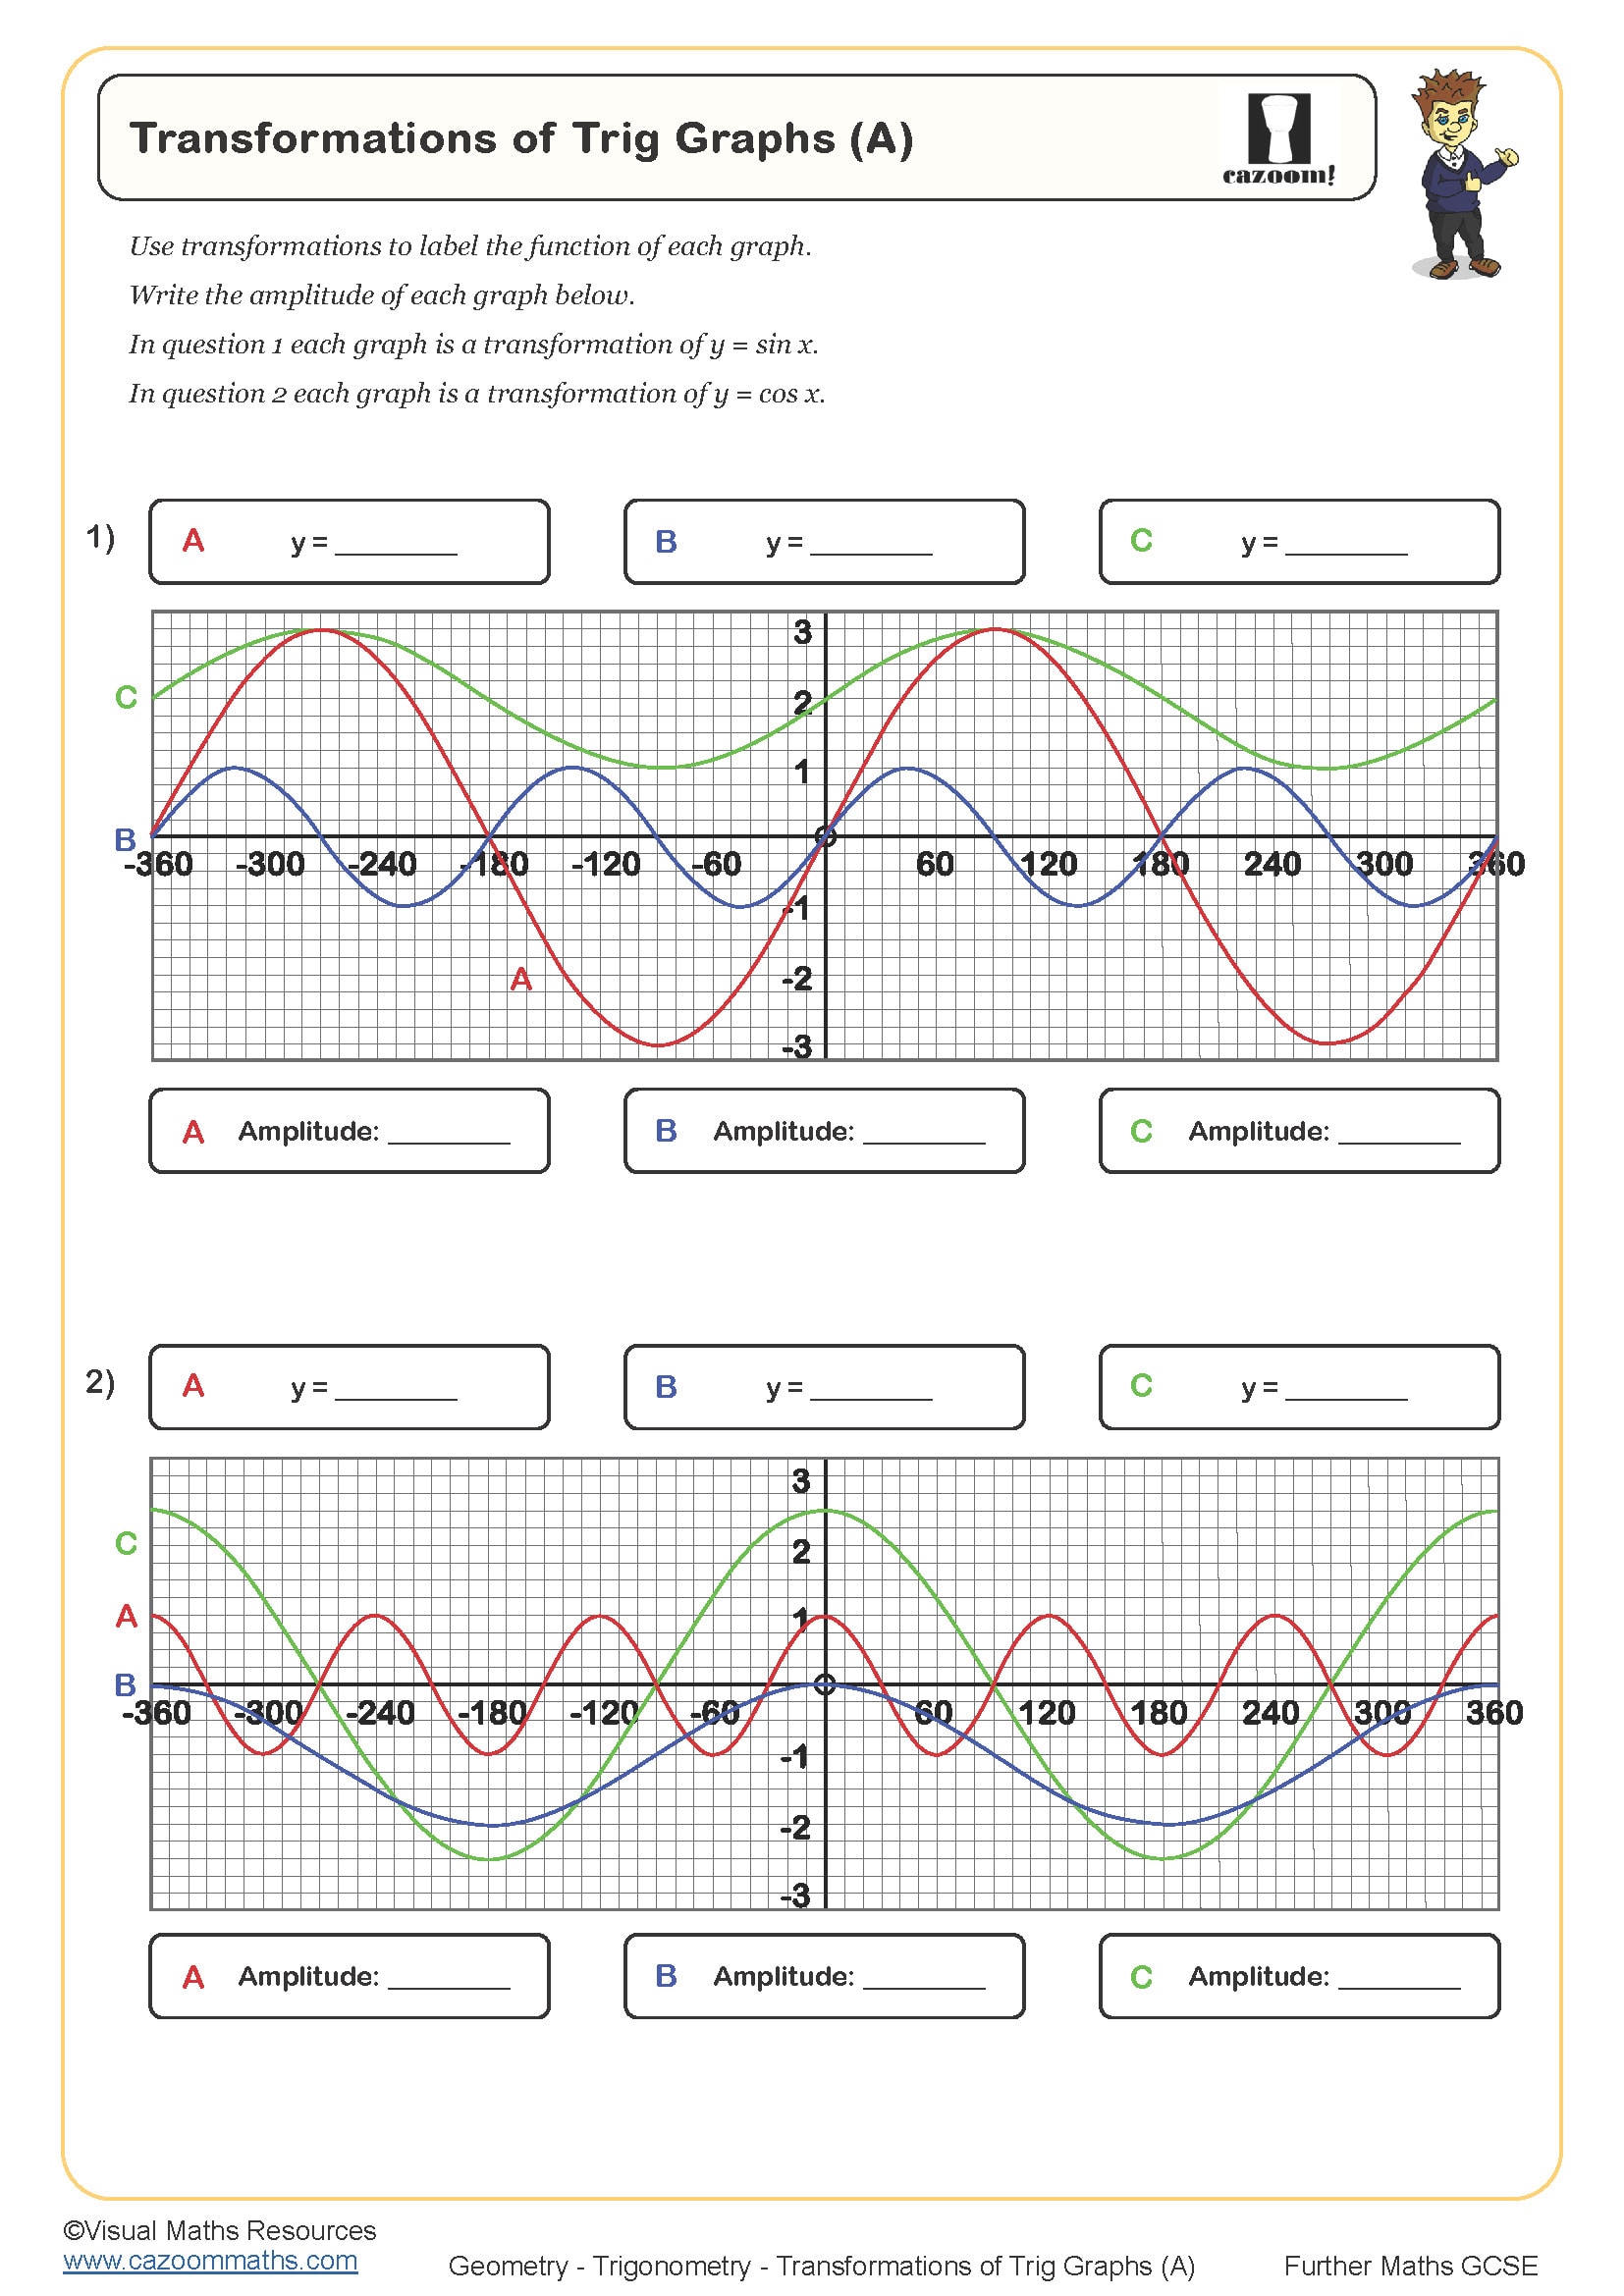
Amplitude transformations occur when a coefficient multiplies the entire trigonometric function, such as y = 3 sin x, which stretches the graph vertically so it oscillates between -3 and 3 rather than -1 and 1. Period transformations happen when a coefficient multiplies the angle inside the function, as in y = sin 2x, which doubles the frequency and halves the period to 180°. Students must understand that the coefficient inside affects the horizontal scaling whilst the coefficient outside affects the vertical scaling.
These transformations model real-world phenomena such as sound waves, where amplitude represents volume and frequency determines pitch, or tidal patterns where coastal engineers use sine functions to predict water levels. In AC electrical circuits, voltage and current are modelled using trigonometric functions with specific amplitudes and frequencies, making this a foundational concept across multiple STEM disciplines where periodic behaviour needs mathematical representation.
How do these worksheets help students master trigonometric graphs?
The worksheets scaffold learning by starting with plotting basic sine, cosine, and tangent graphs from tables of values before progressing to sketching transformed graphs using knowledge of key features. Questions guide students through identifying how each transformation affects the standard graph, building the visual reasoning needed to sketch curves accurately without plotting multiple points. The answer sheets show correct scales and labelled axes, which helps students self-assess whether their sketches capture the correct amplitude, period, and translations.
Teachers use these resources for targeted intervention with students who struggle to connect algebraic transformations to graphical changes, or as revision material before assessments where graph sketching questions regularly appear. The worksheets work well for paired activities where students compare their sketches and discuss why certain transformations produce specific effects, reinforcing the connection between function notation and graph shape that underpins success in both GCSE examinations and future study of trigonometry.