KS3 Mean Median Mode Worksheets
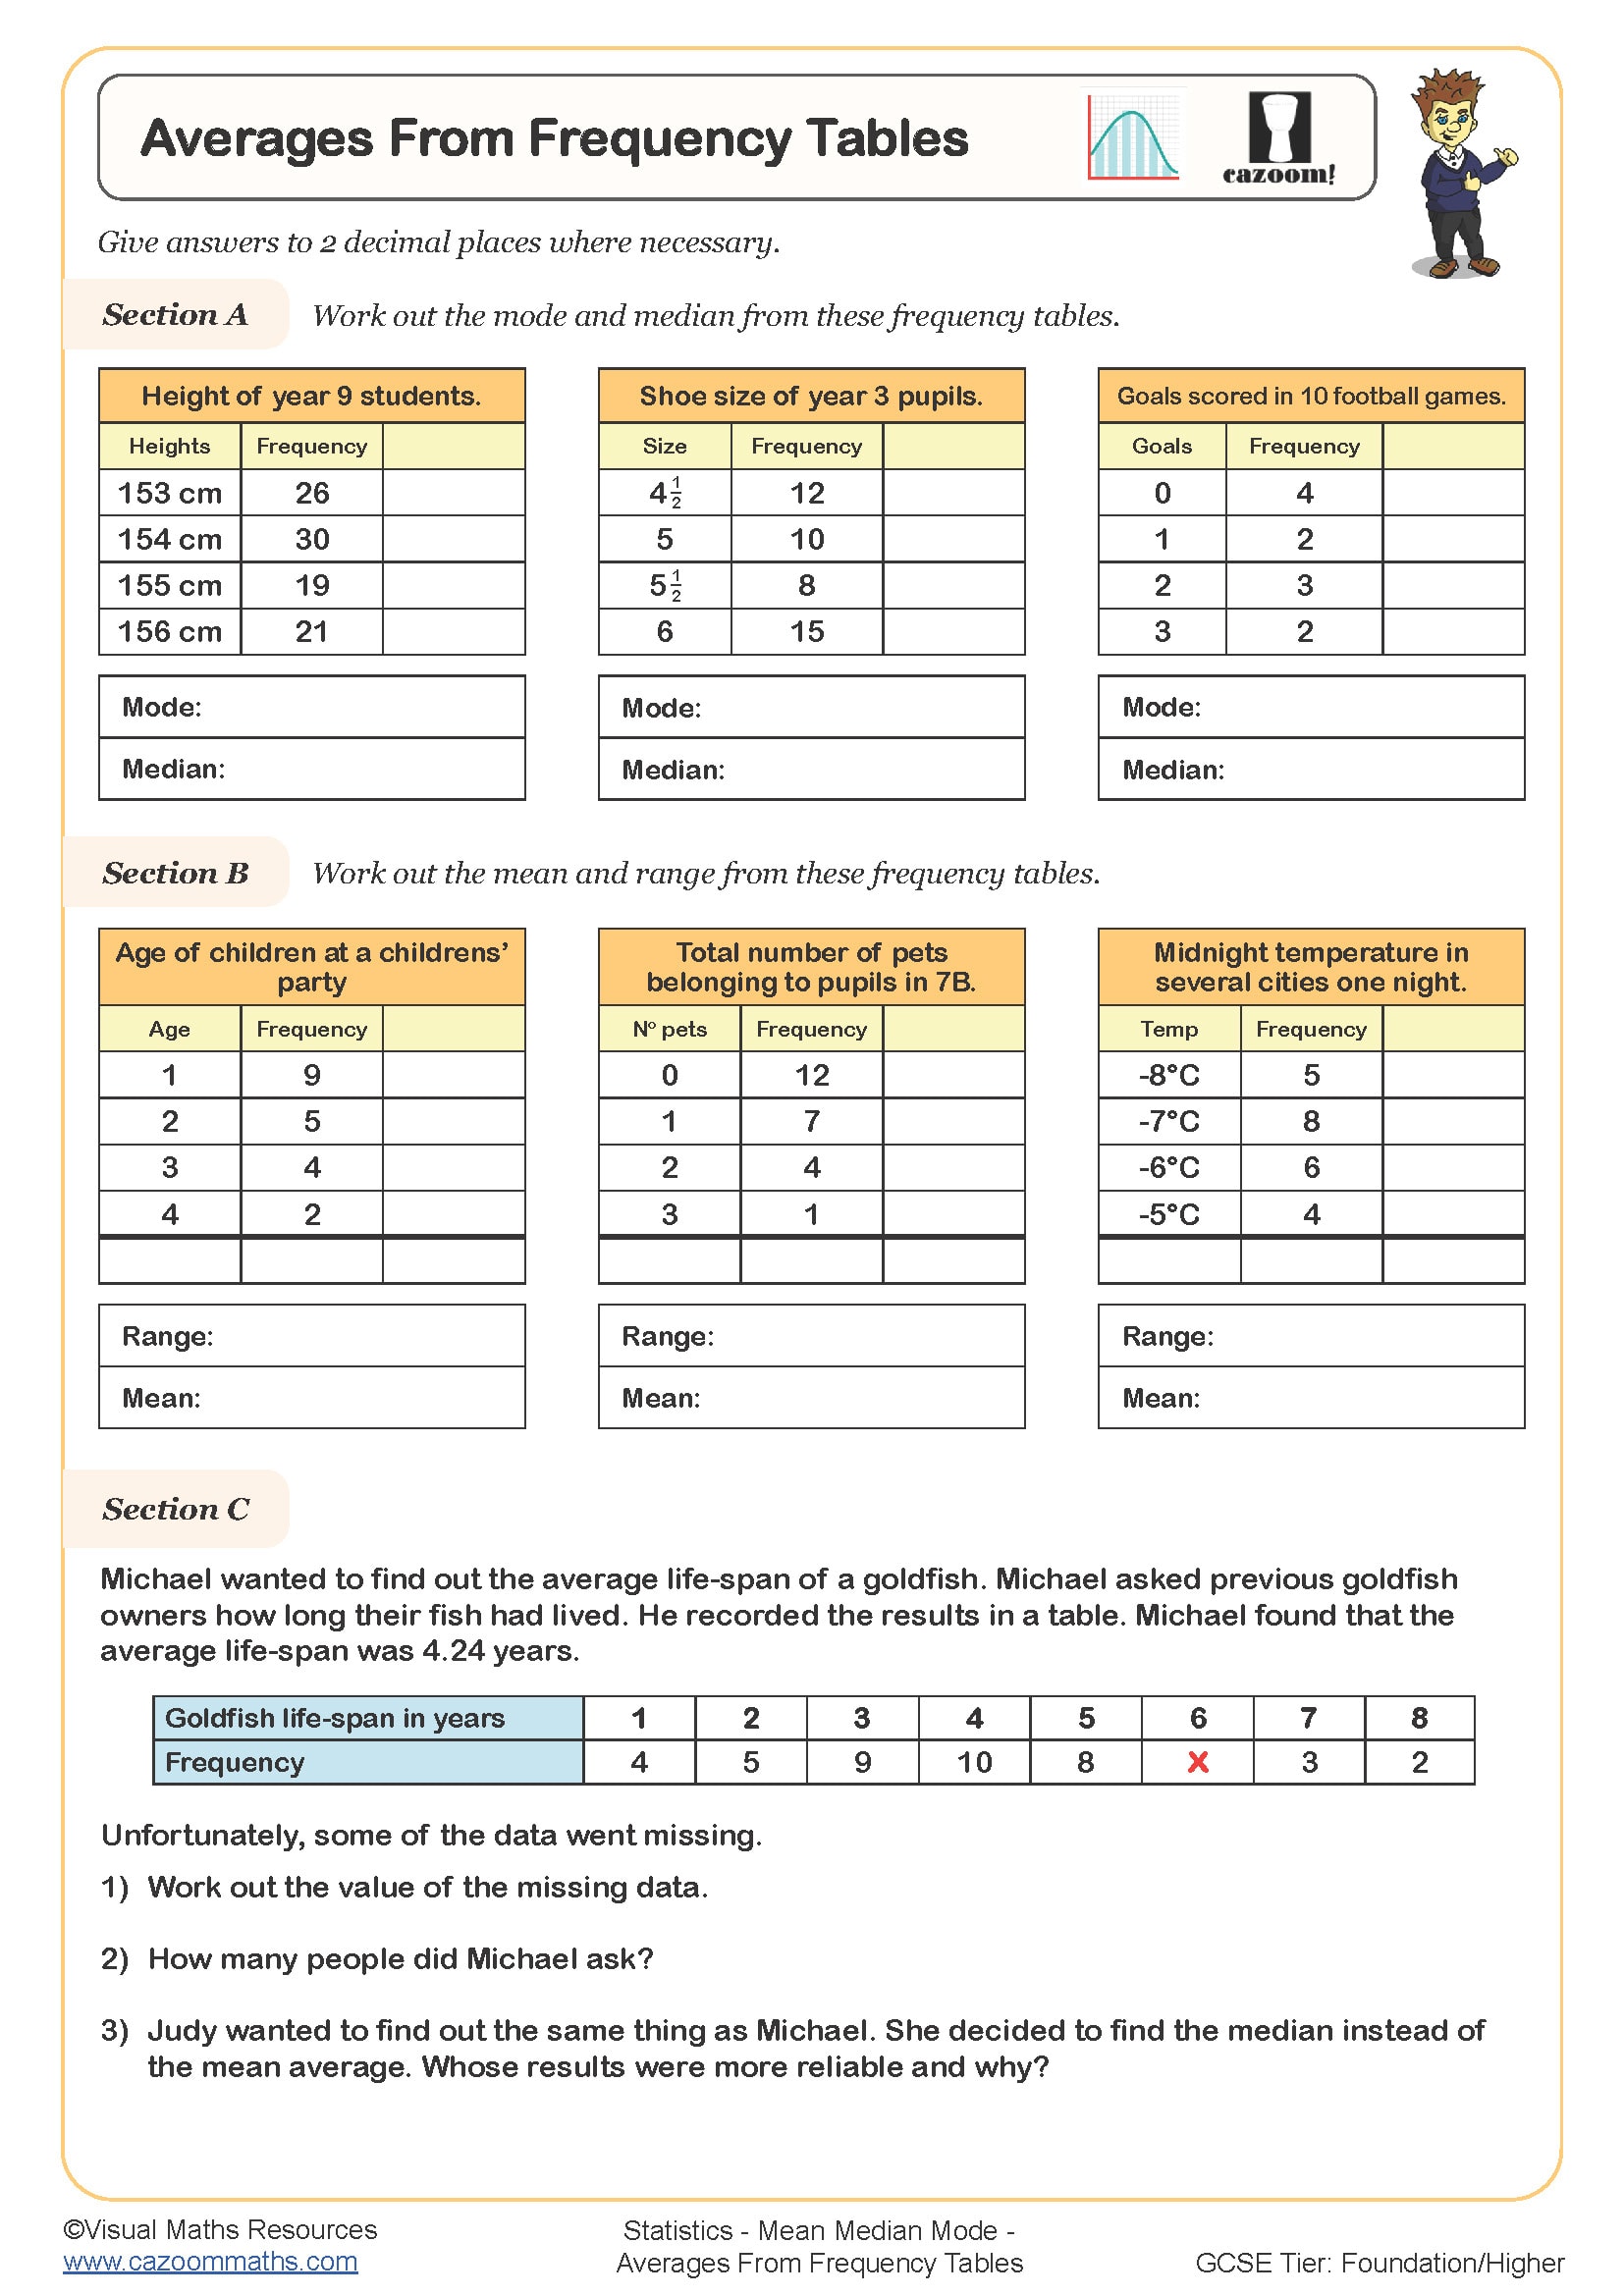
Averages from Frequency Tables
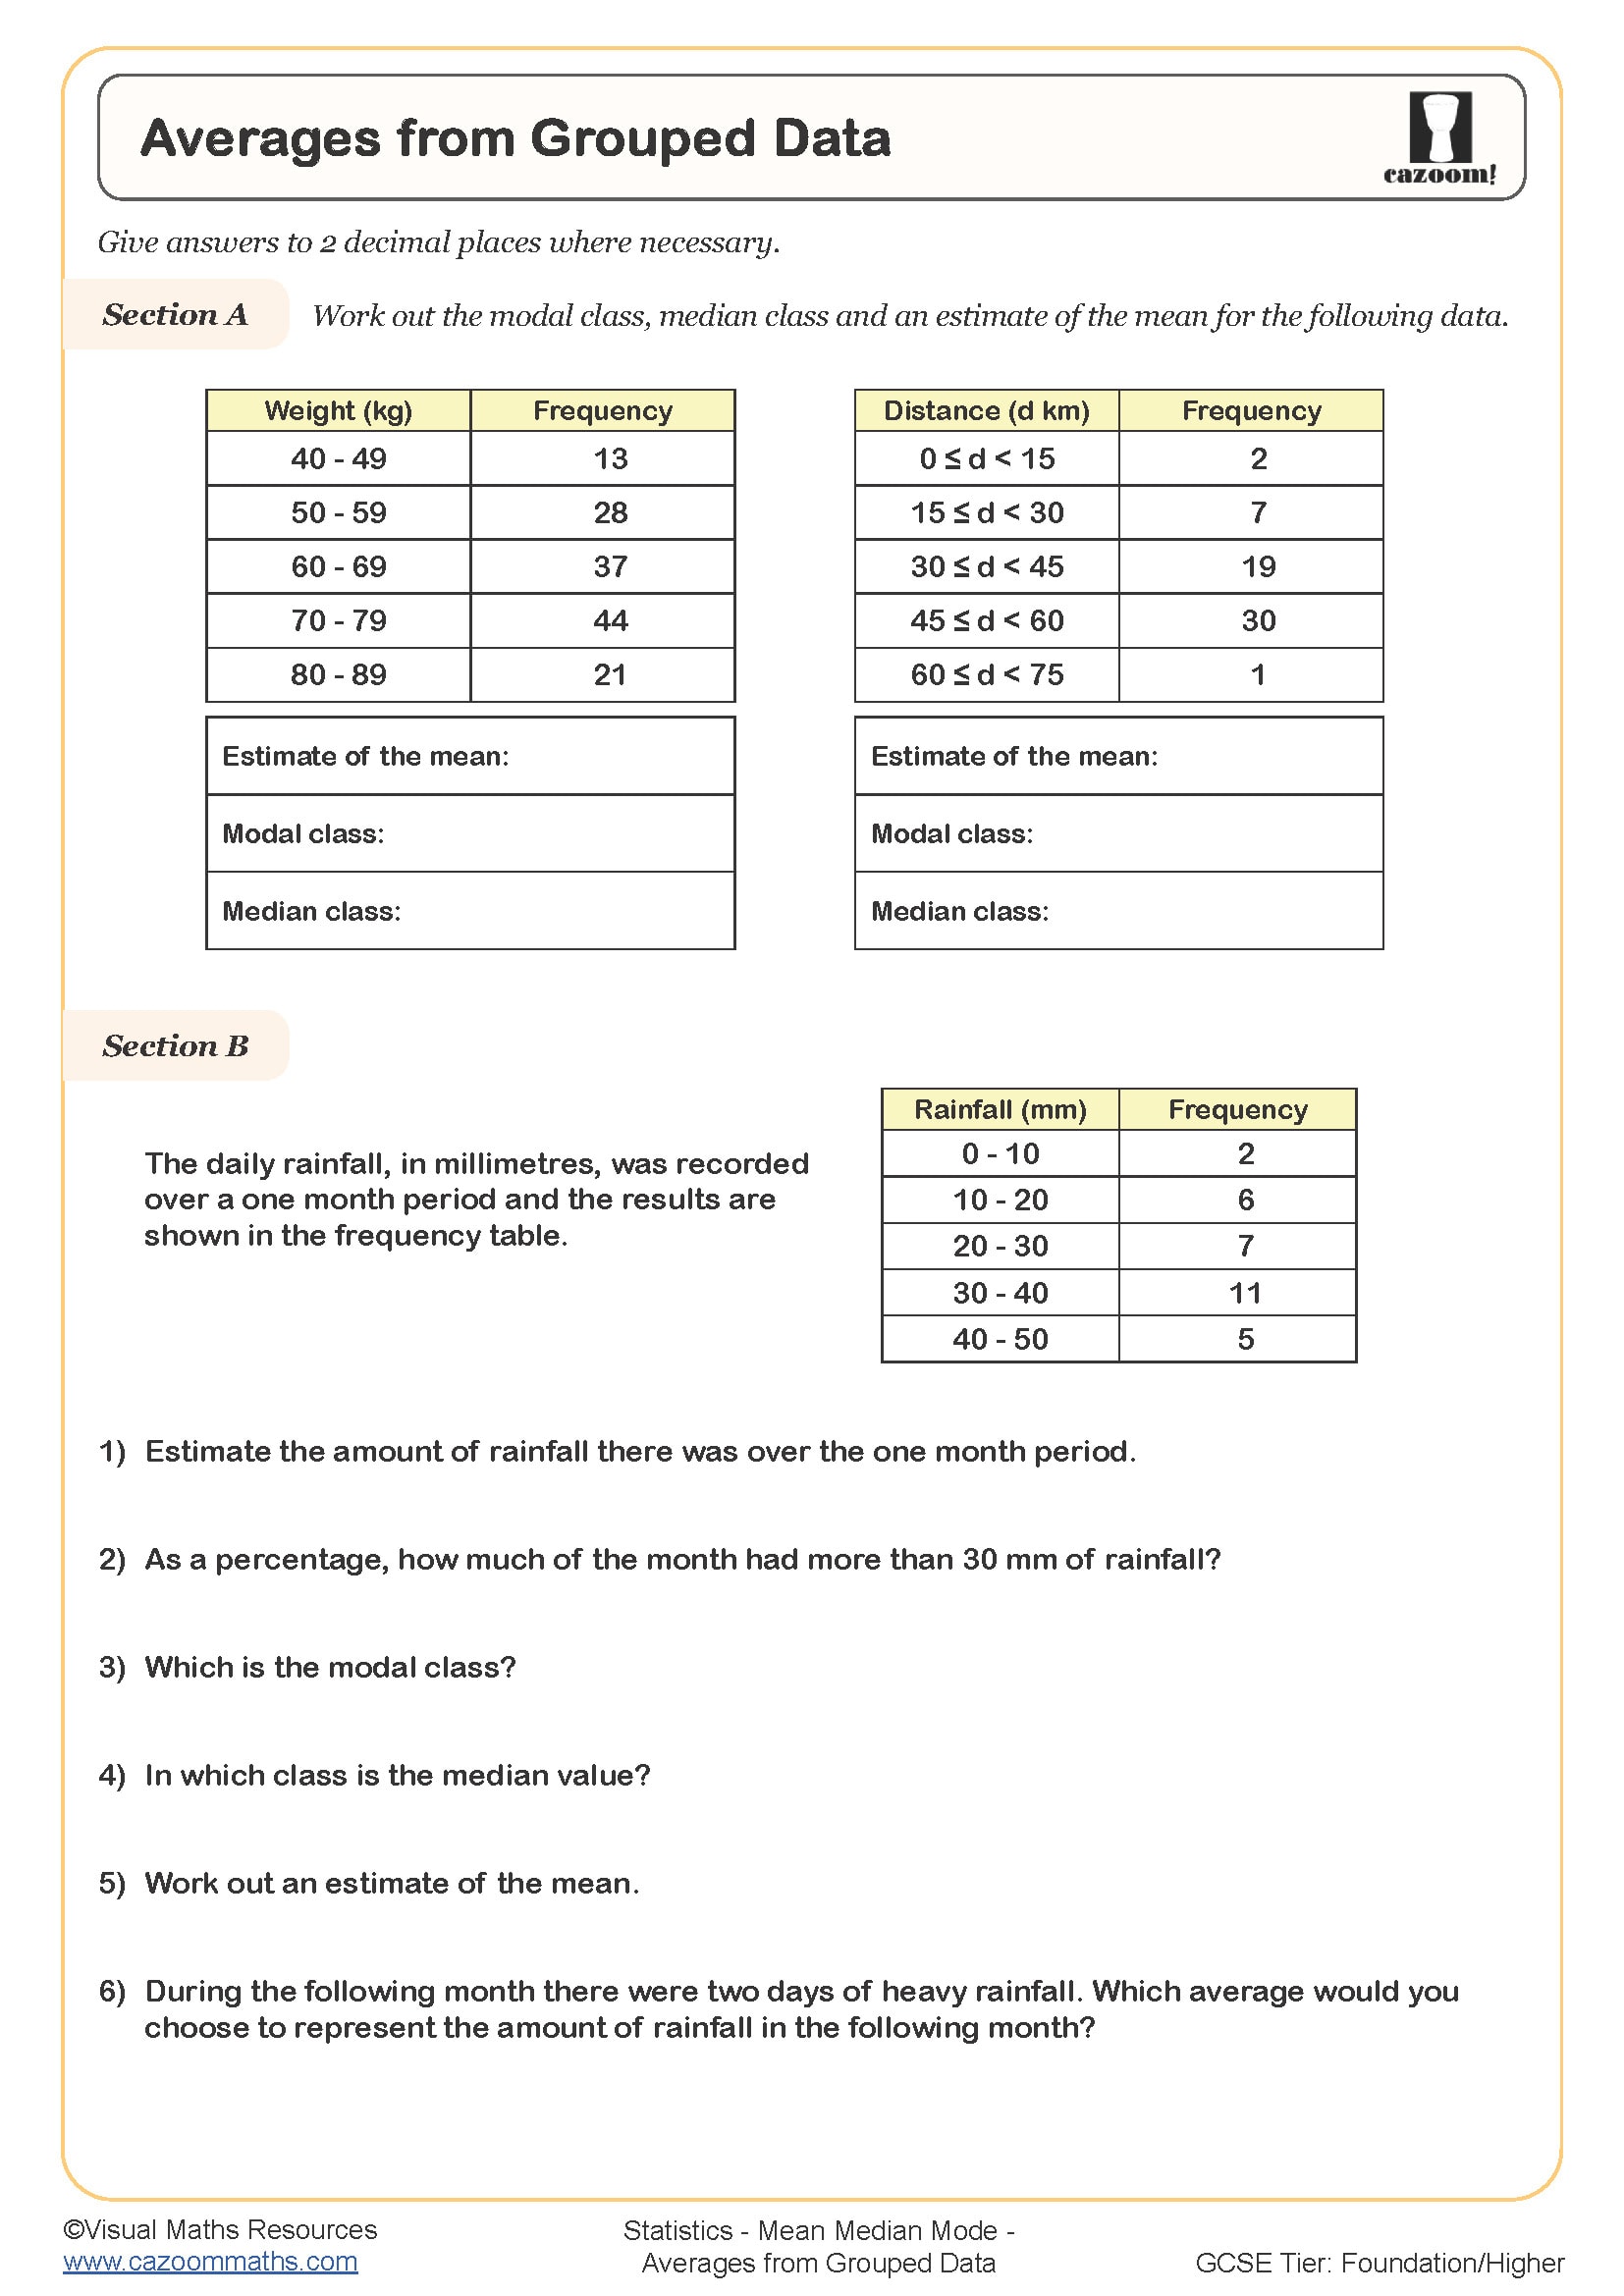
Averages from Grouped Data
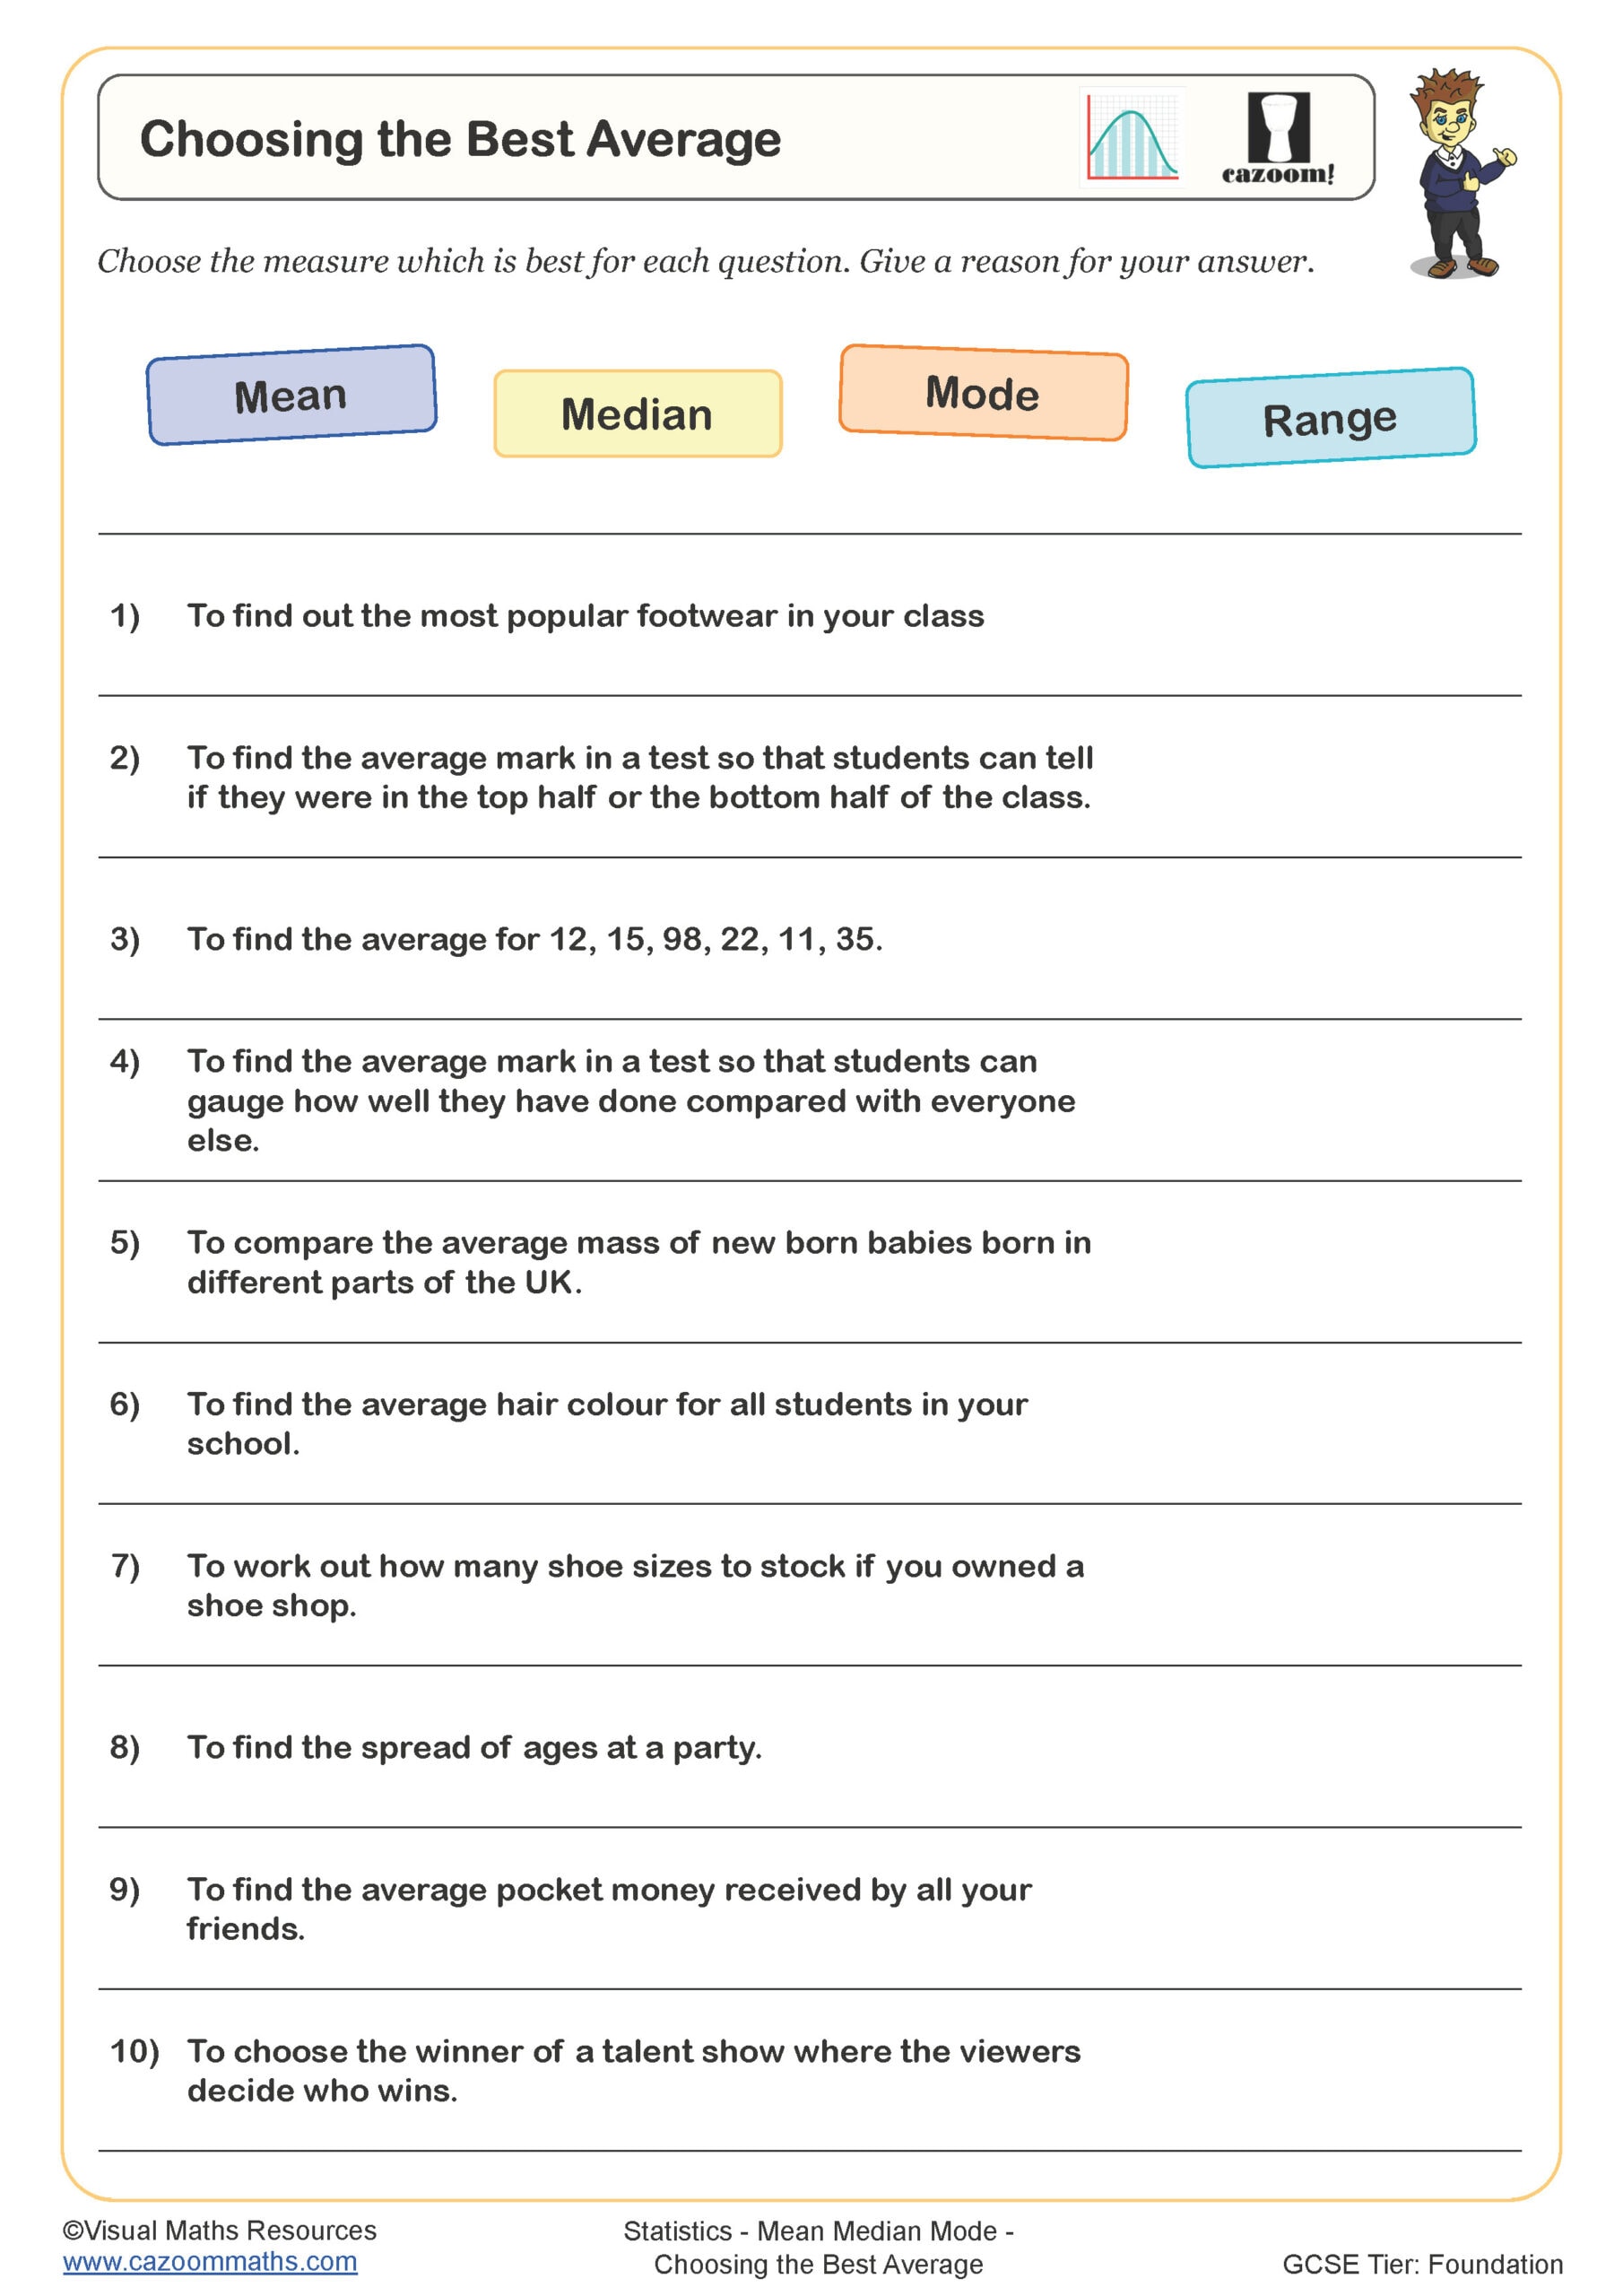
Choosing the Best Average
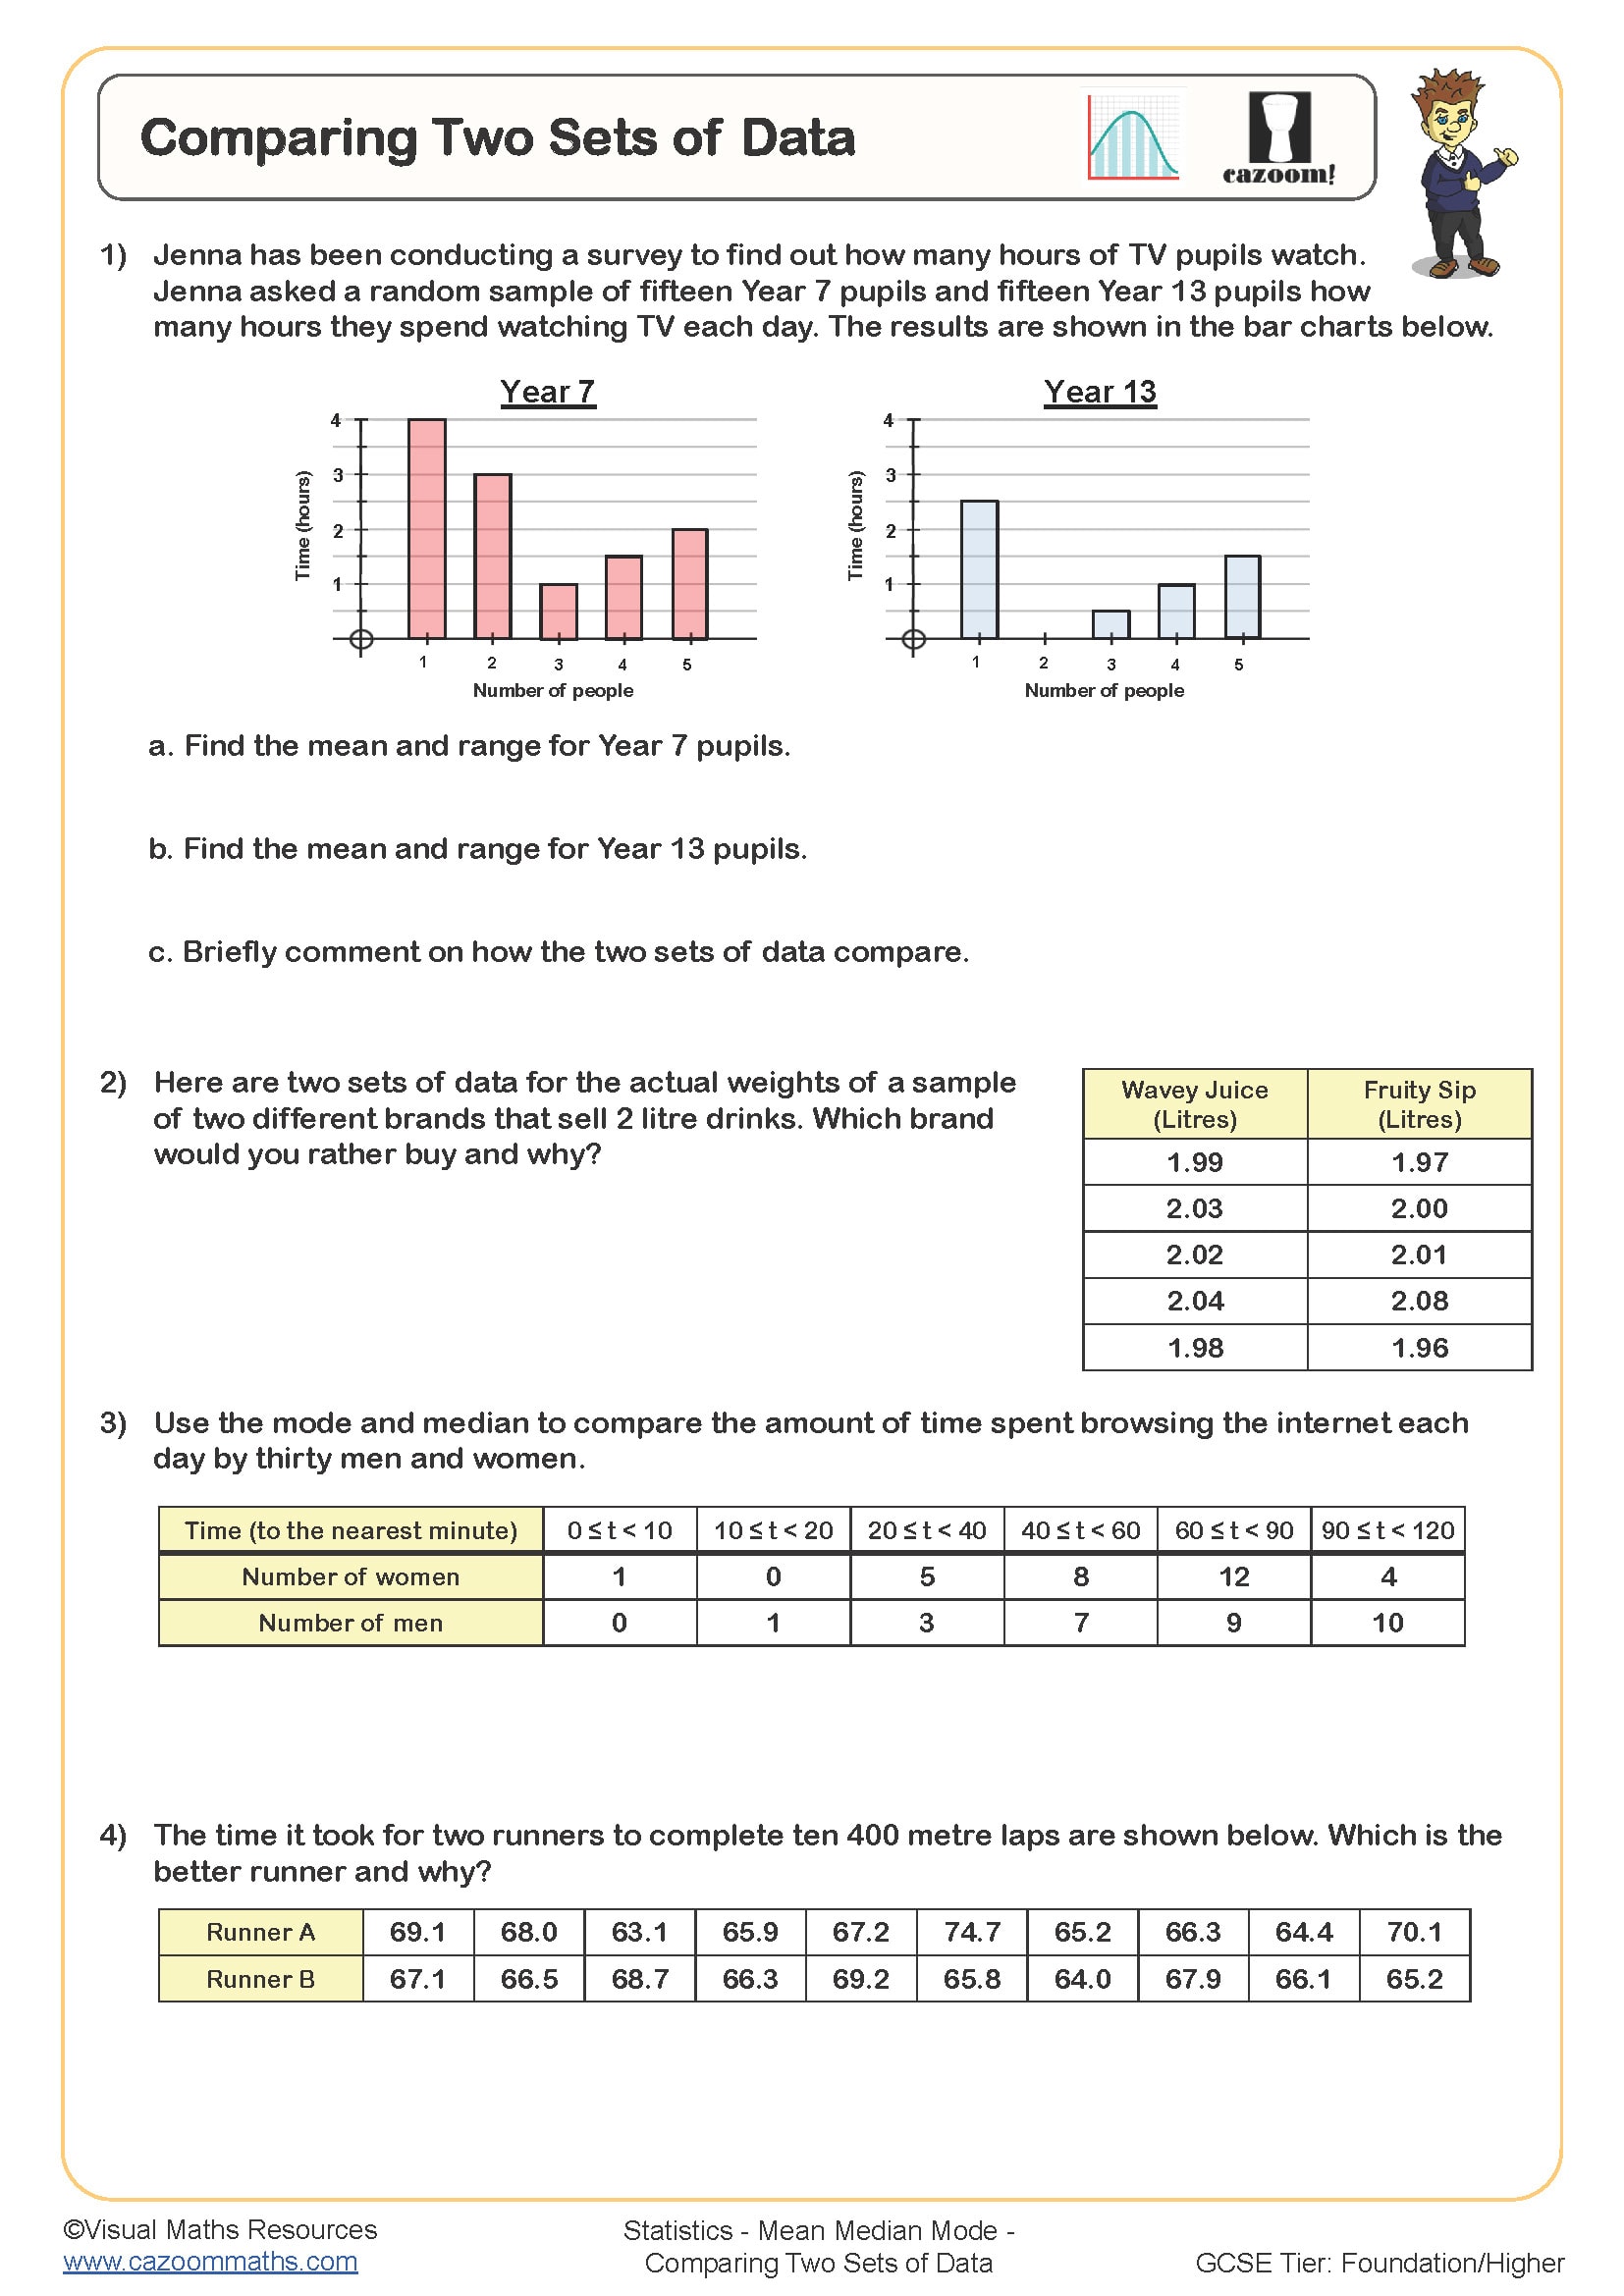
Comparing Two Sets of Data
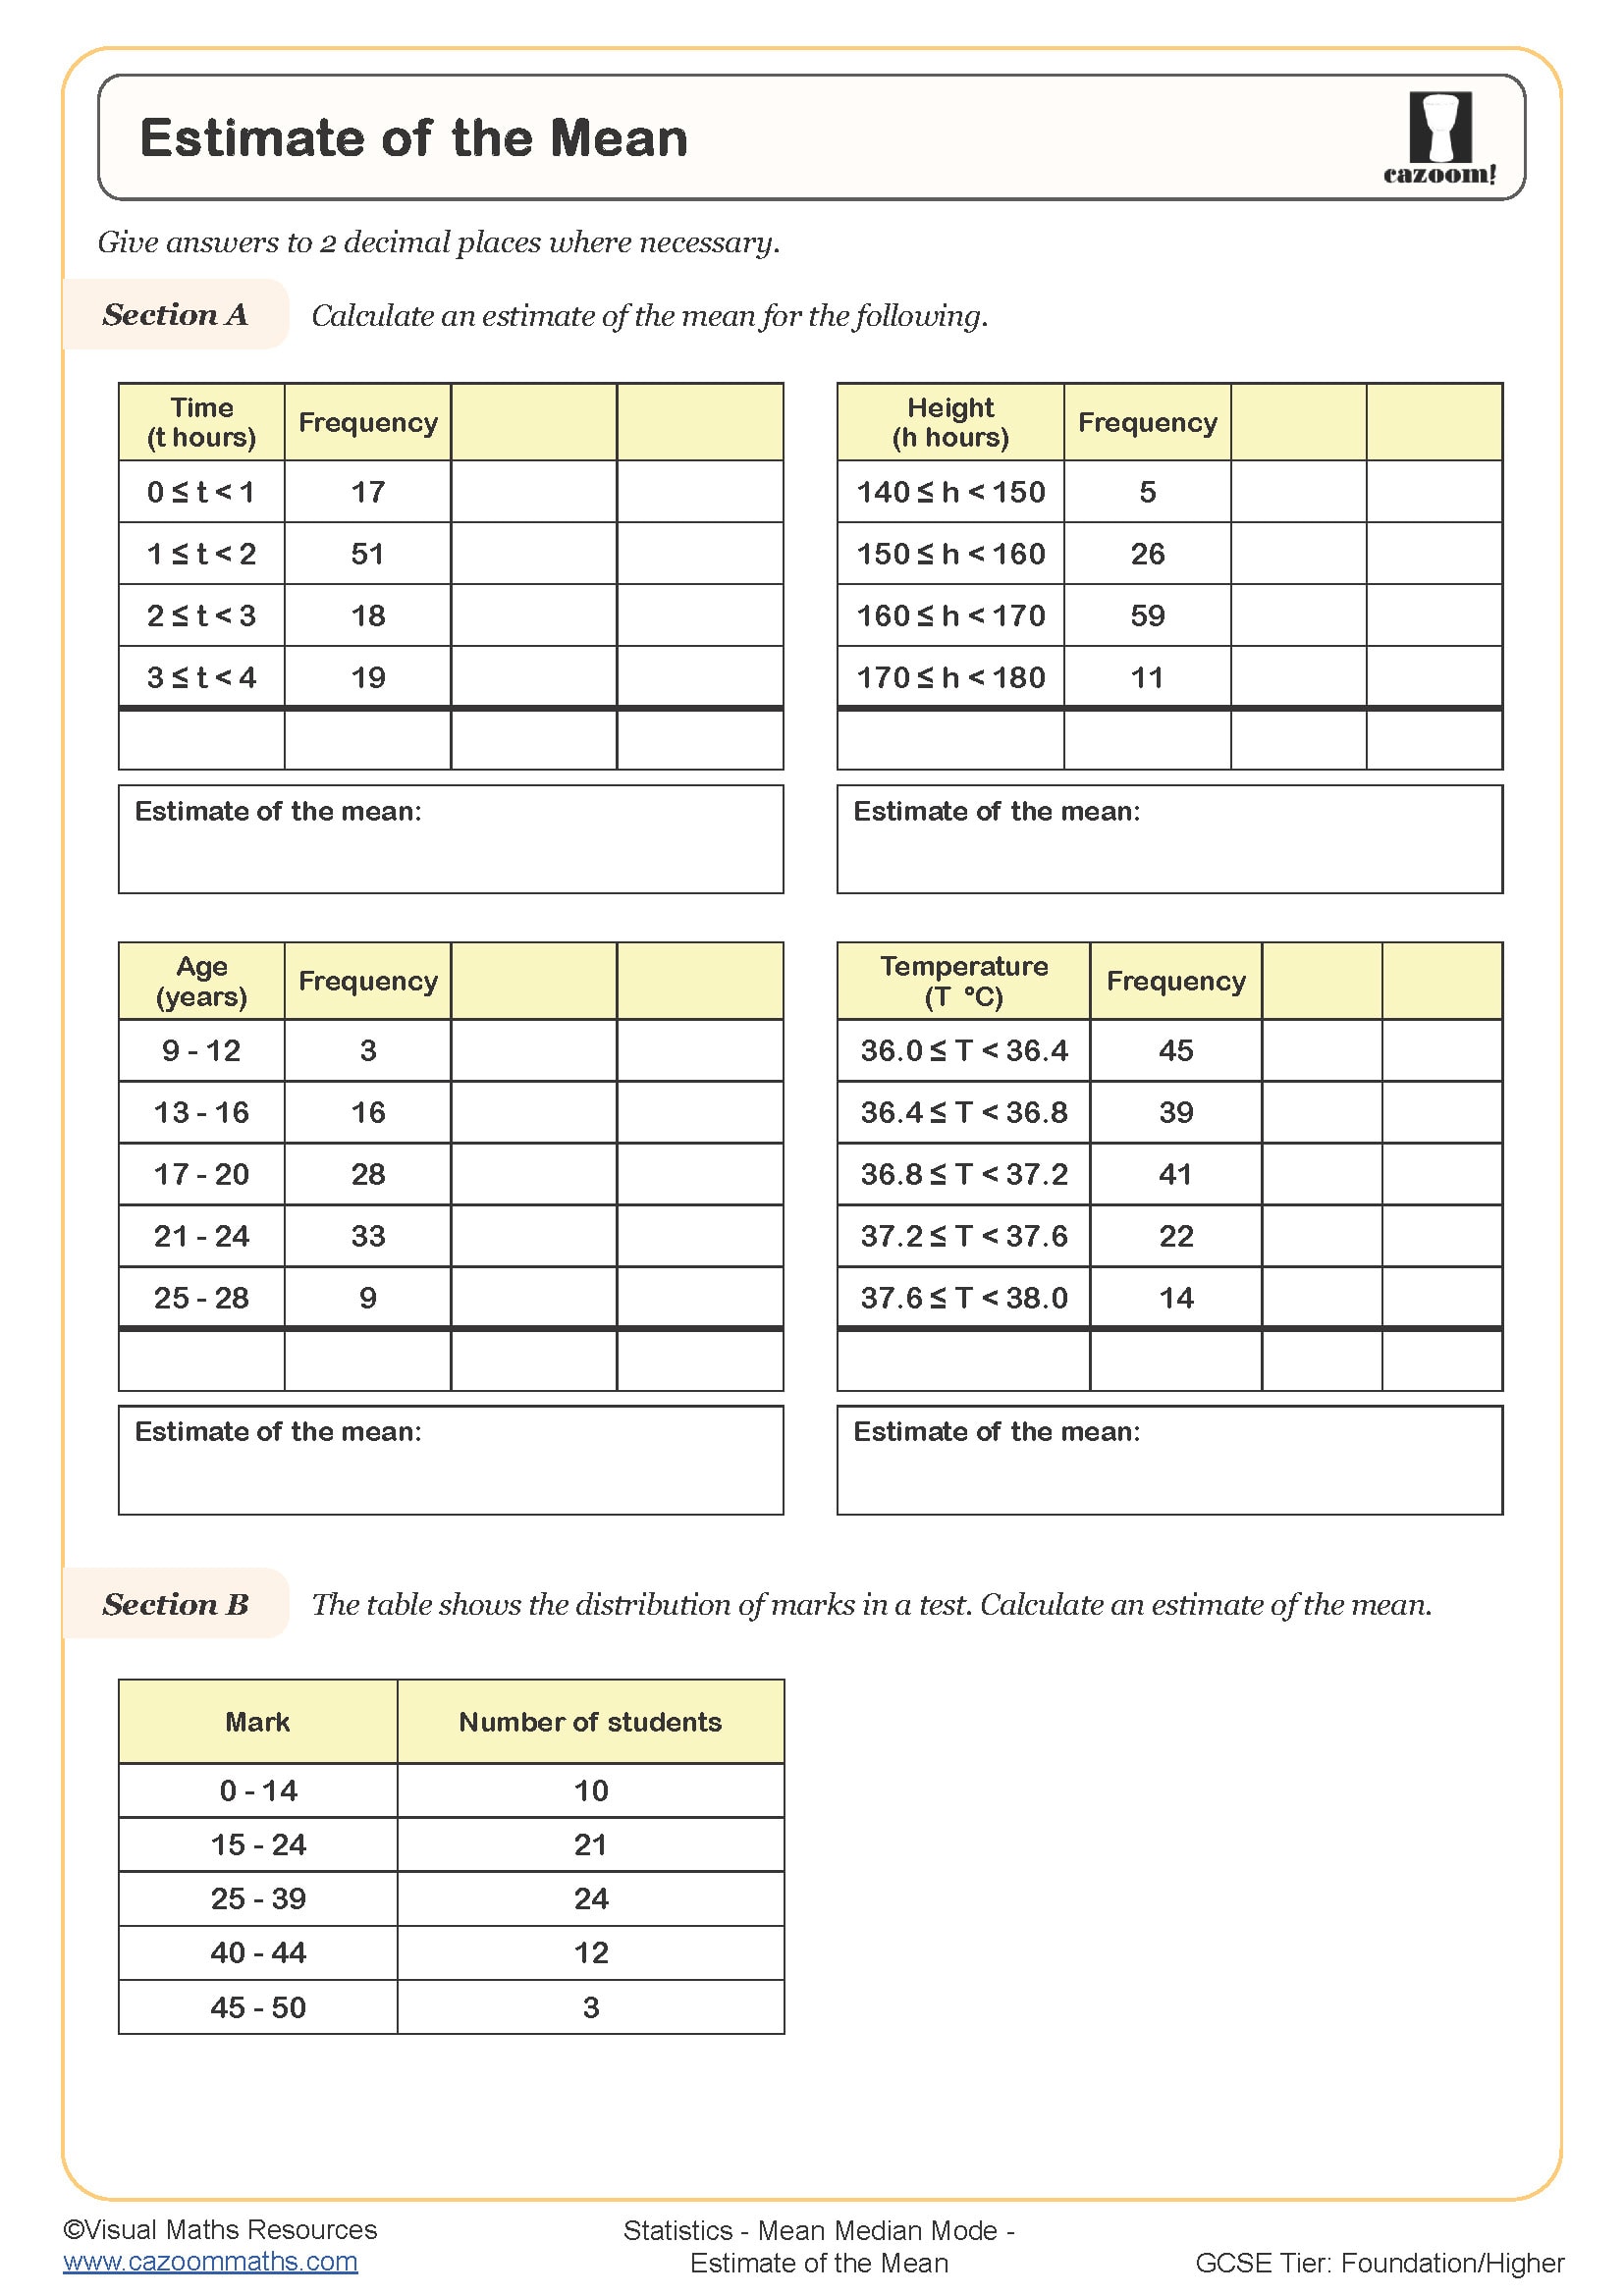
Estimate of the Mean
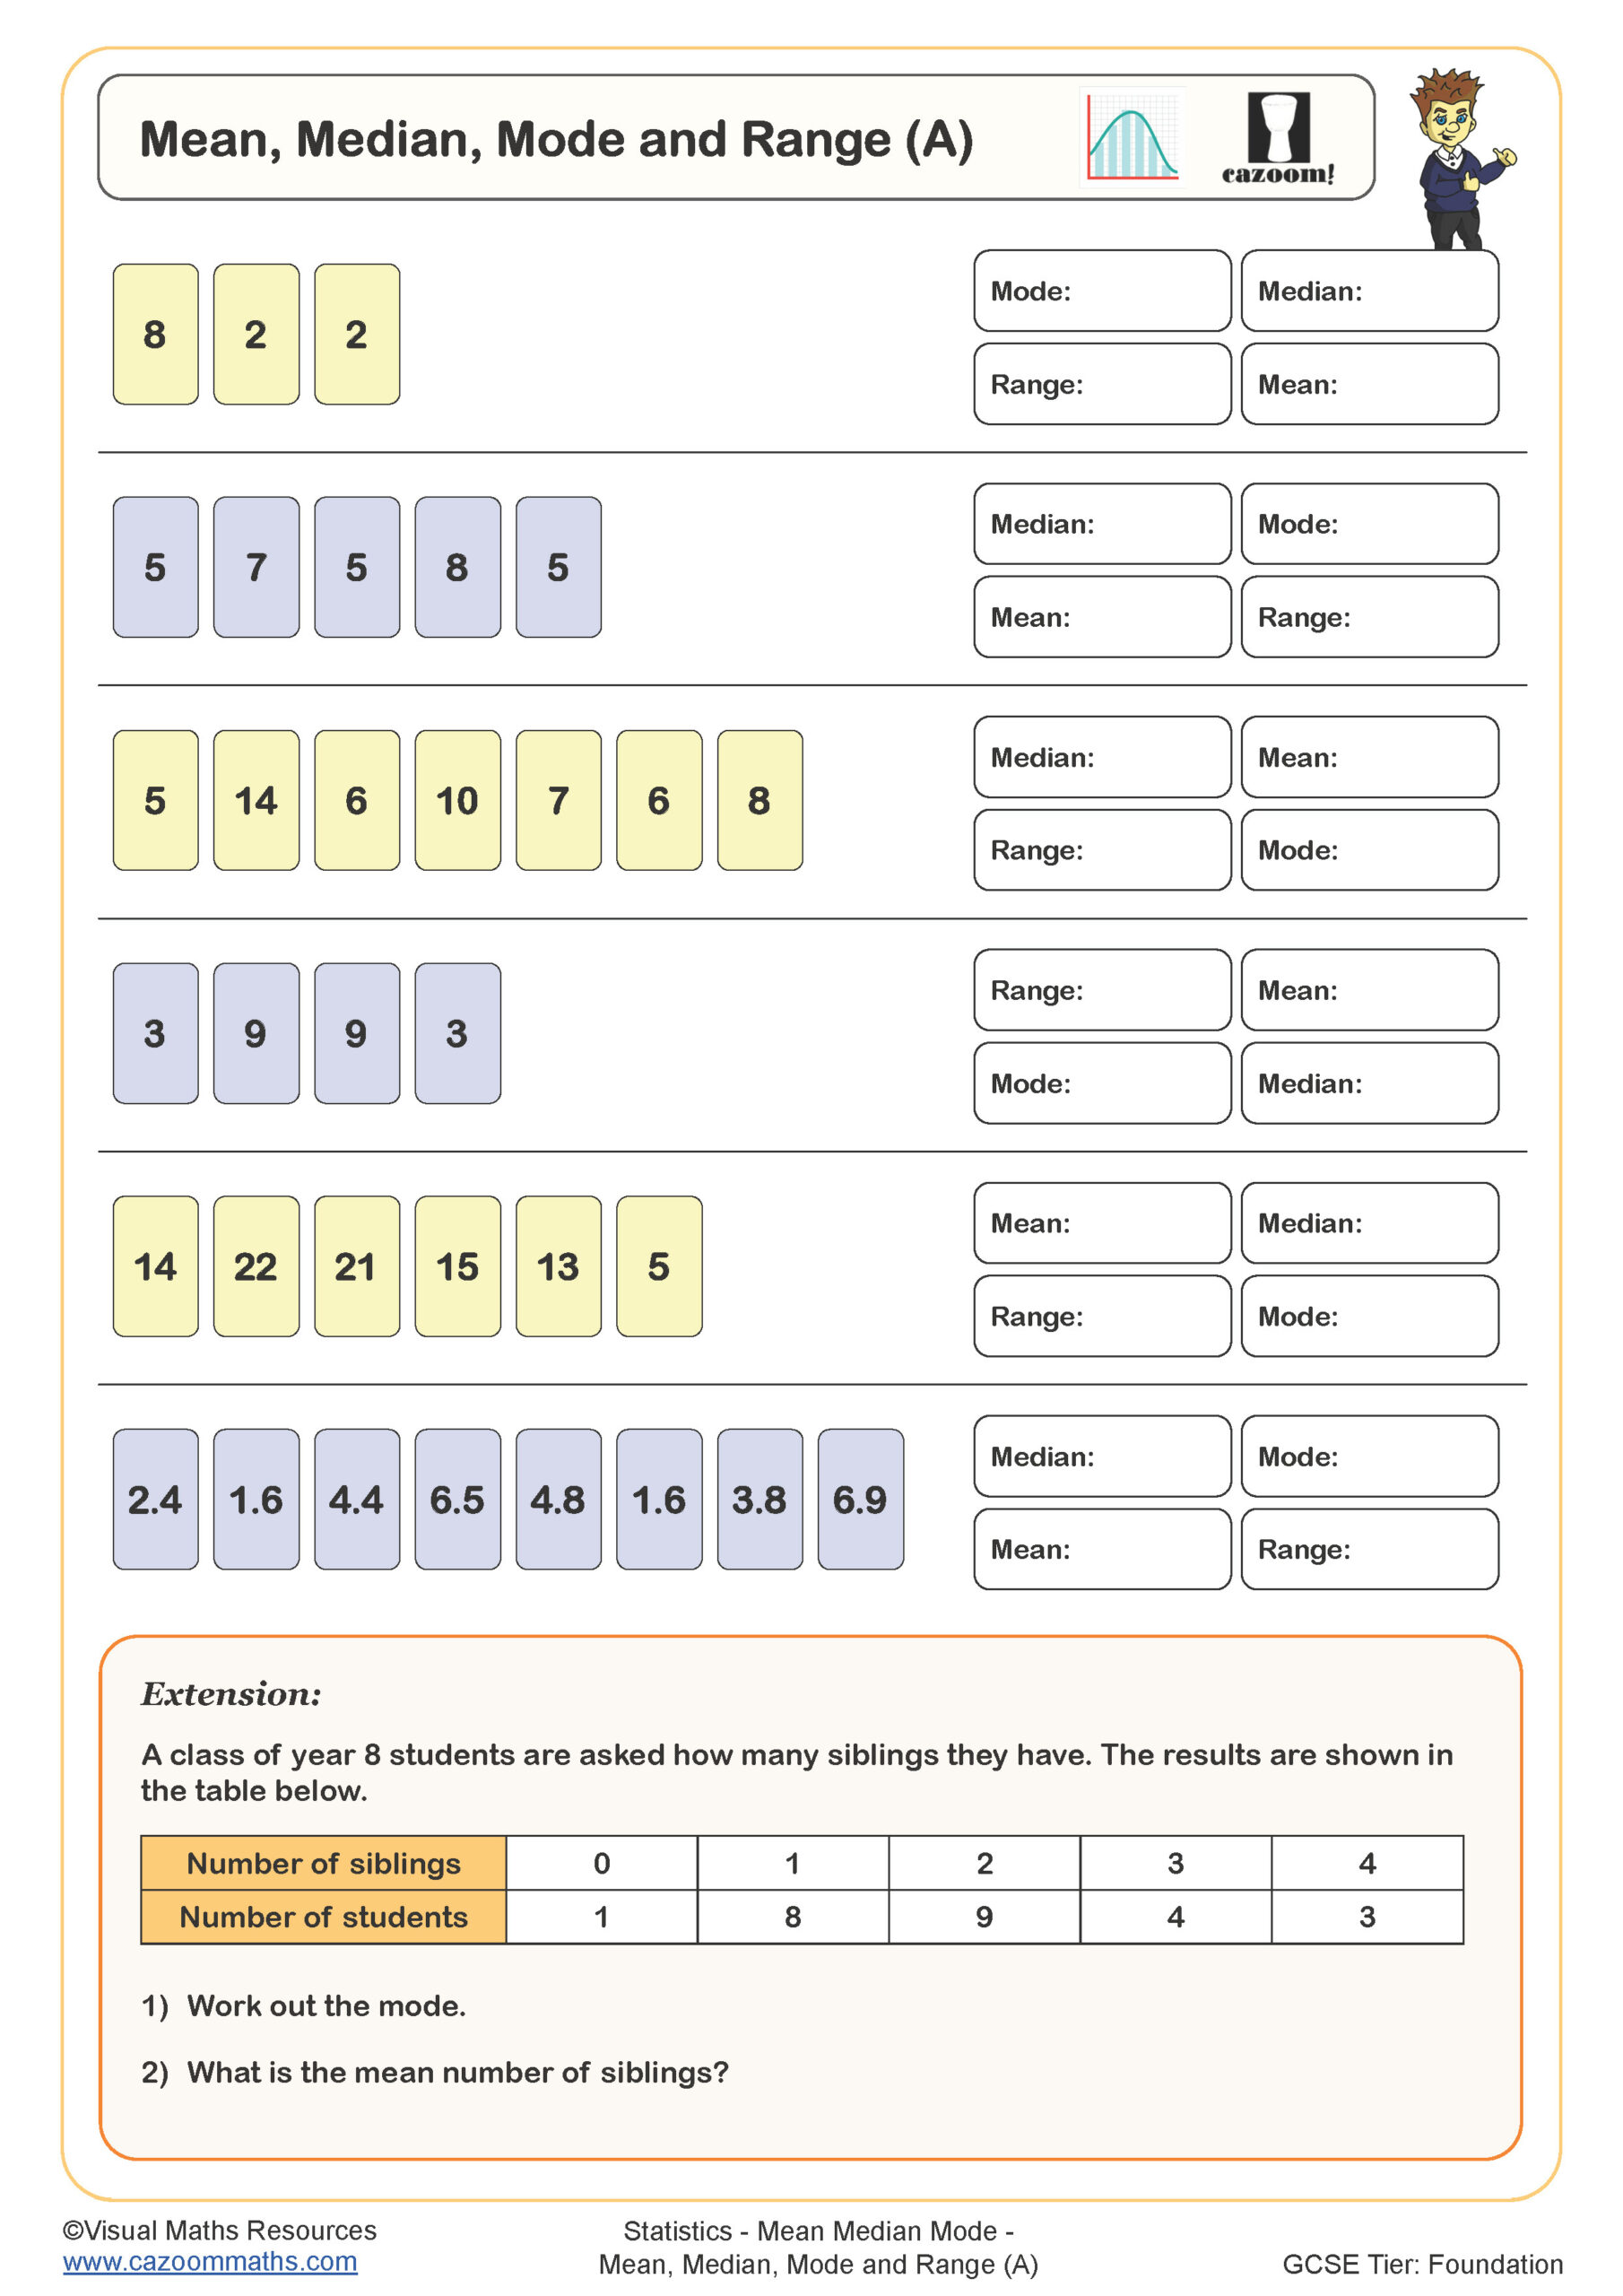
Mean, Median, Mode and Range (A)
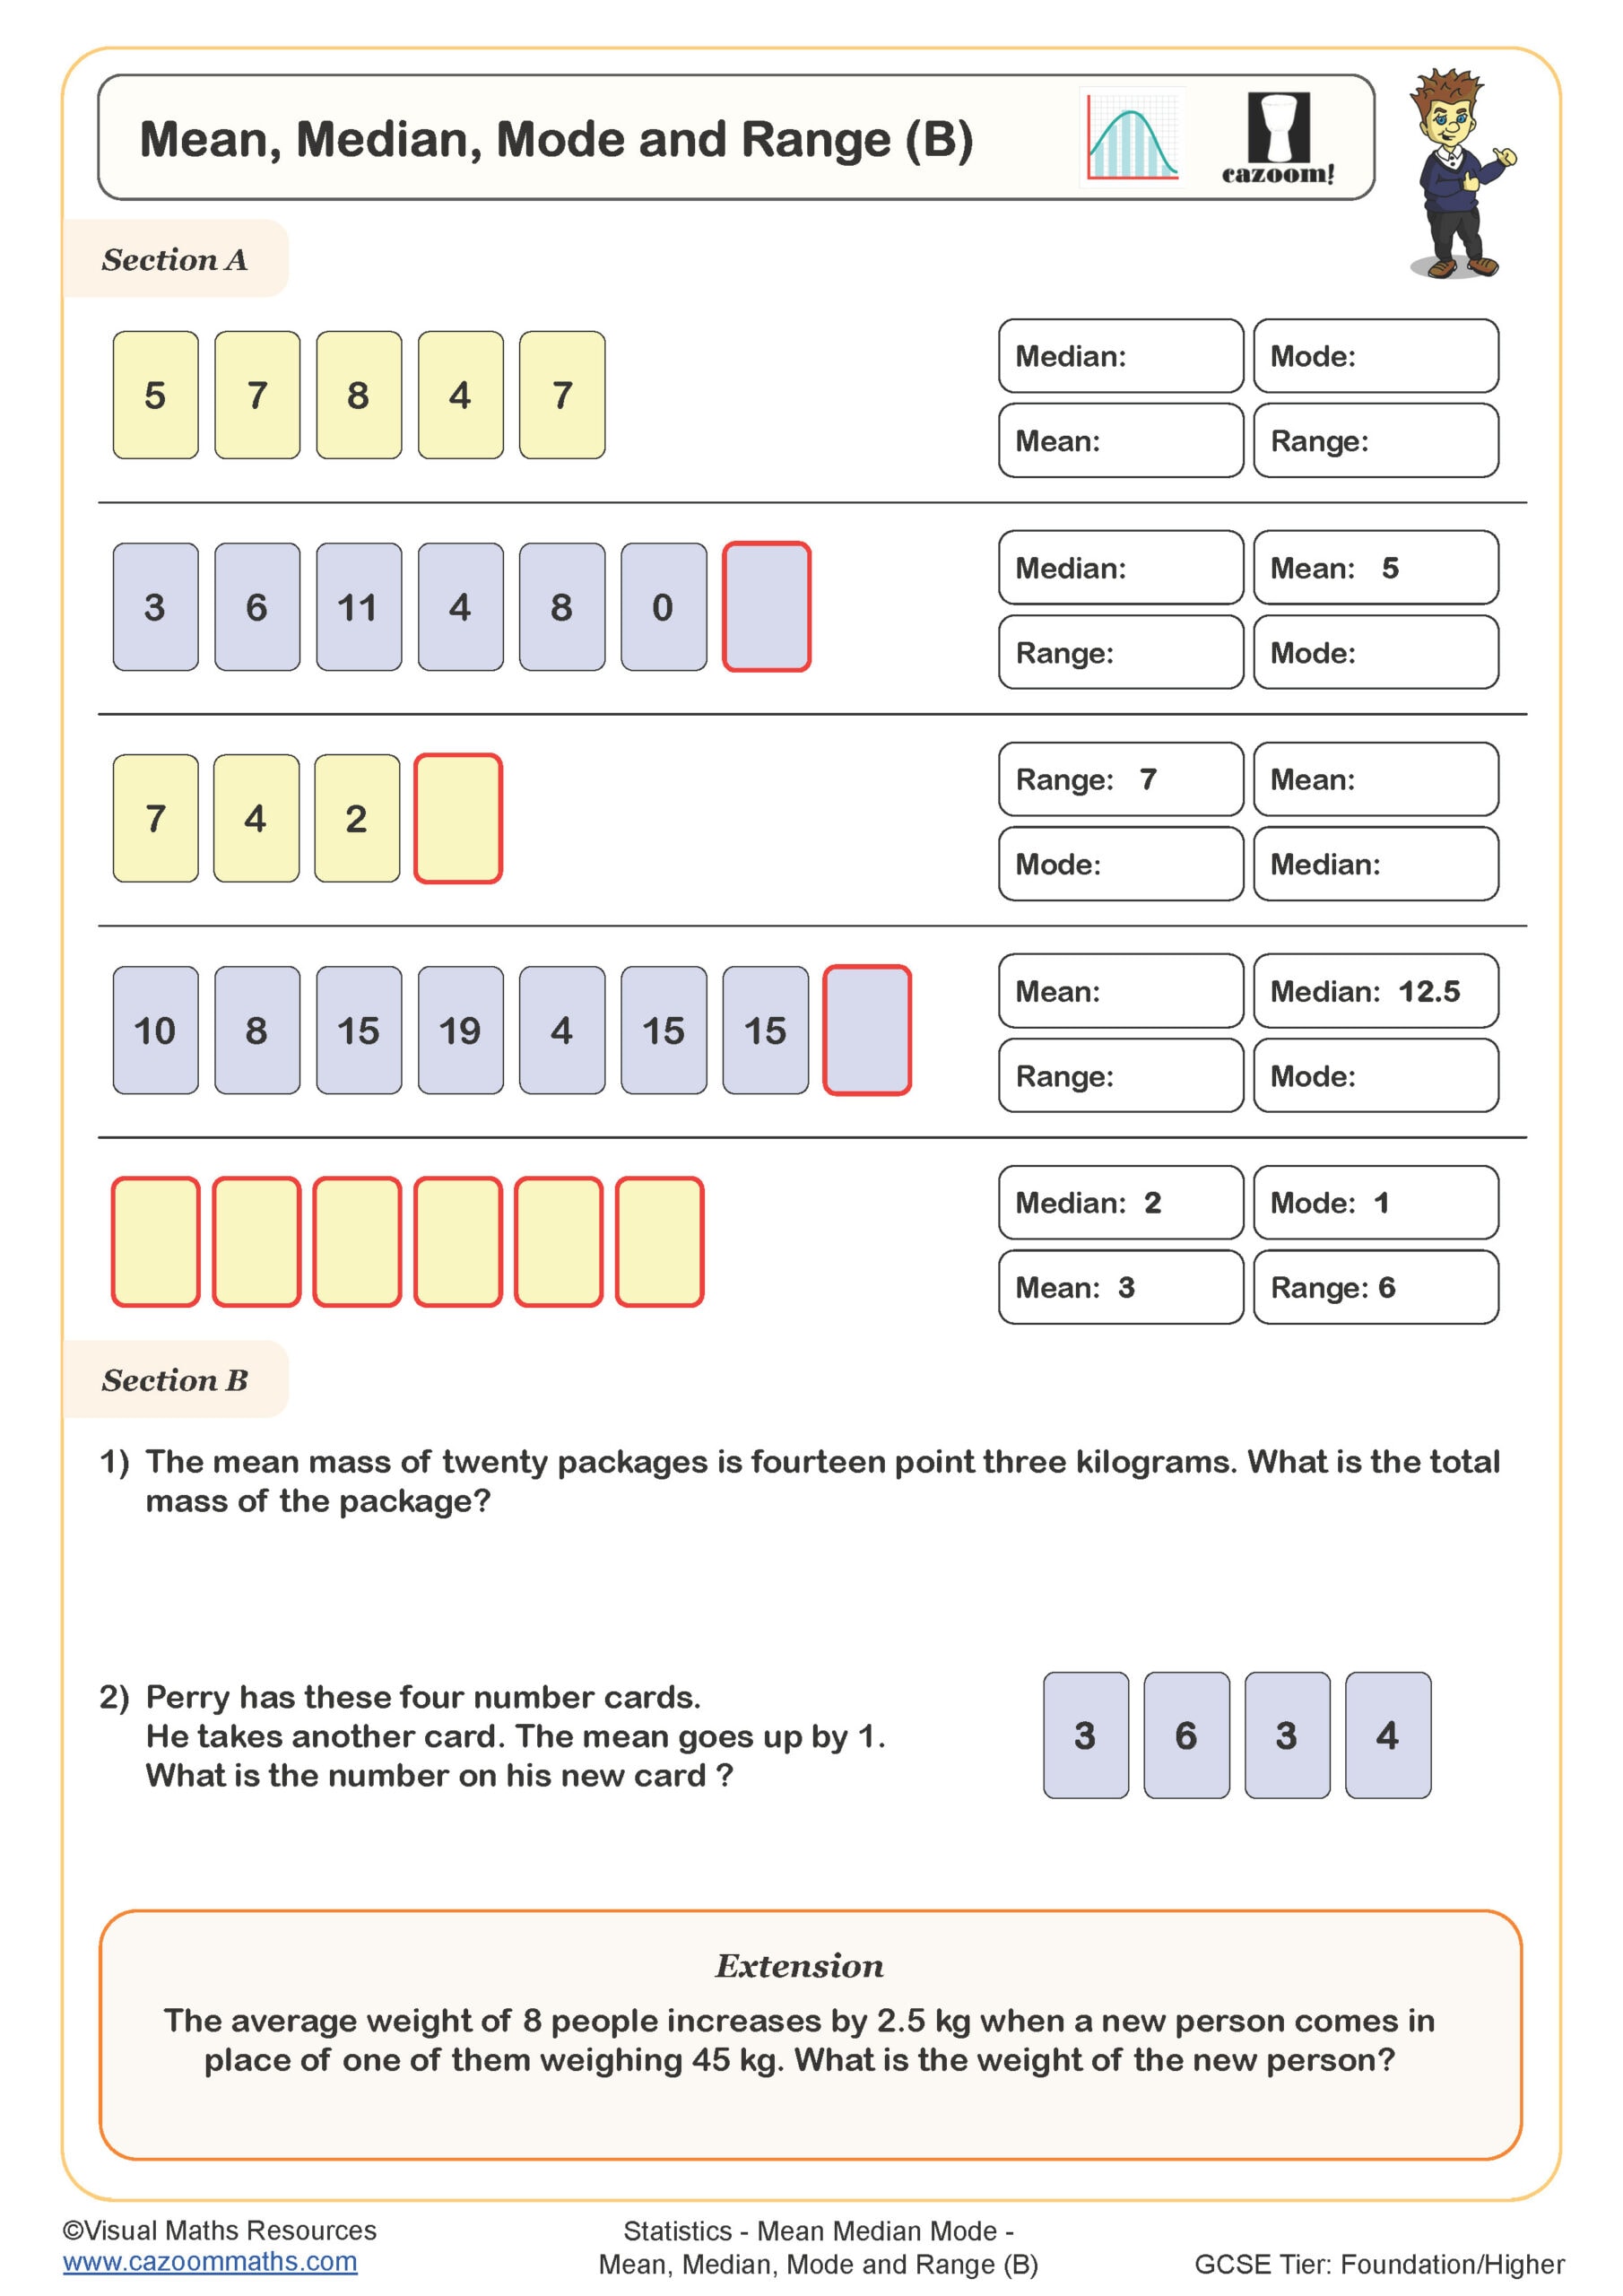
Mean, Median, Mode and Range (B)
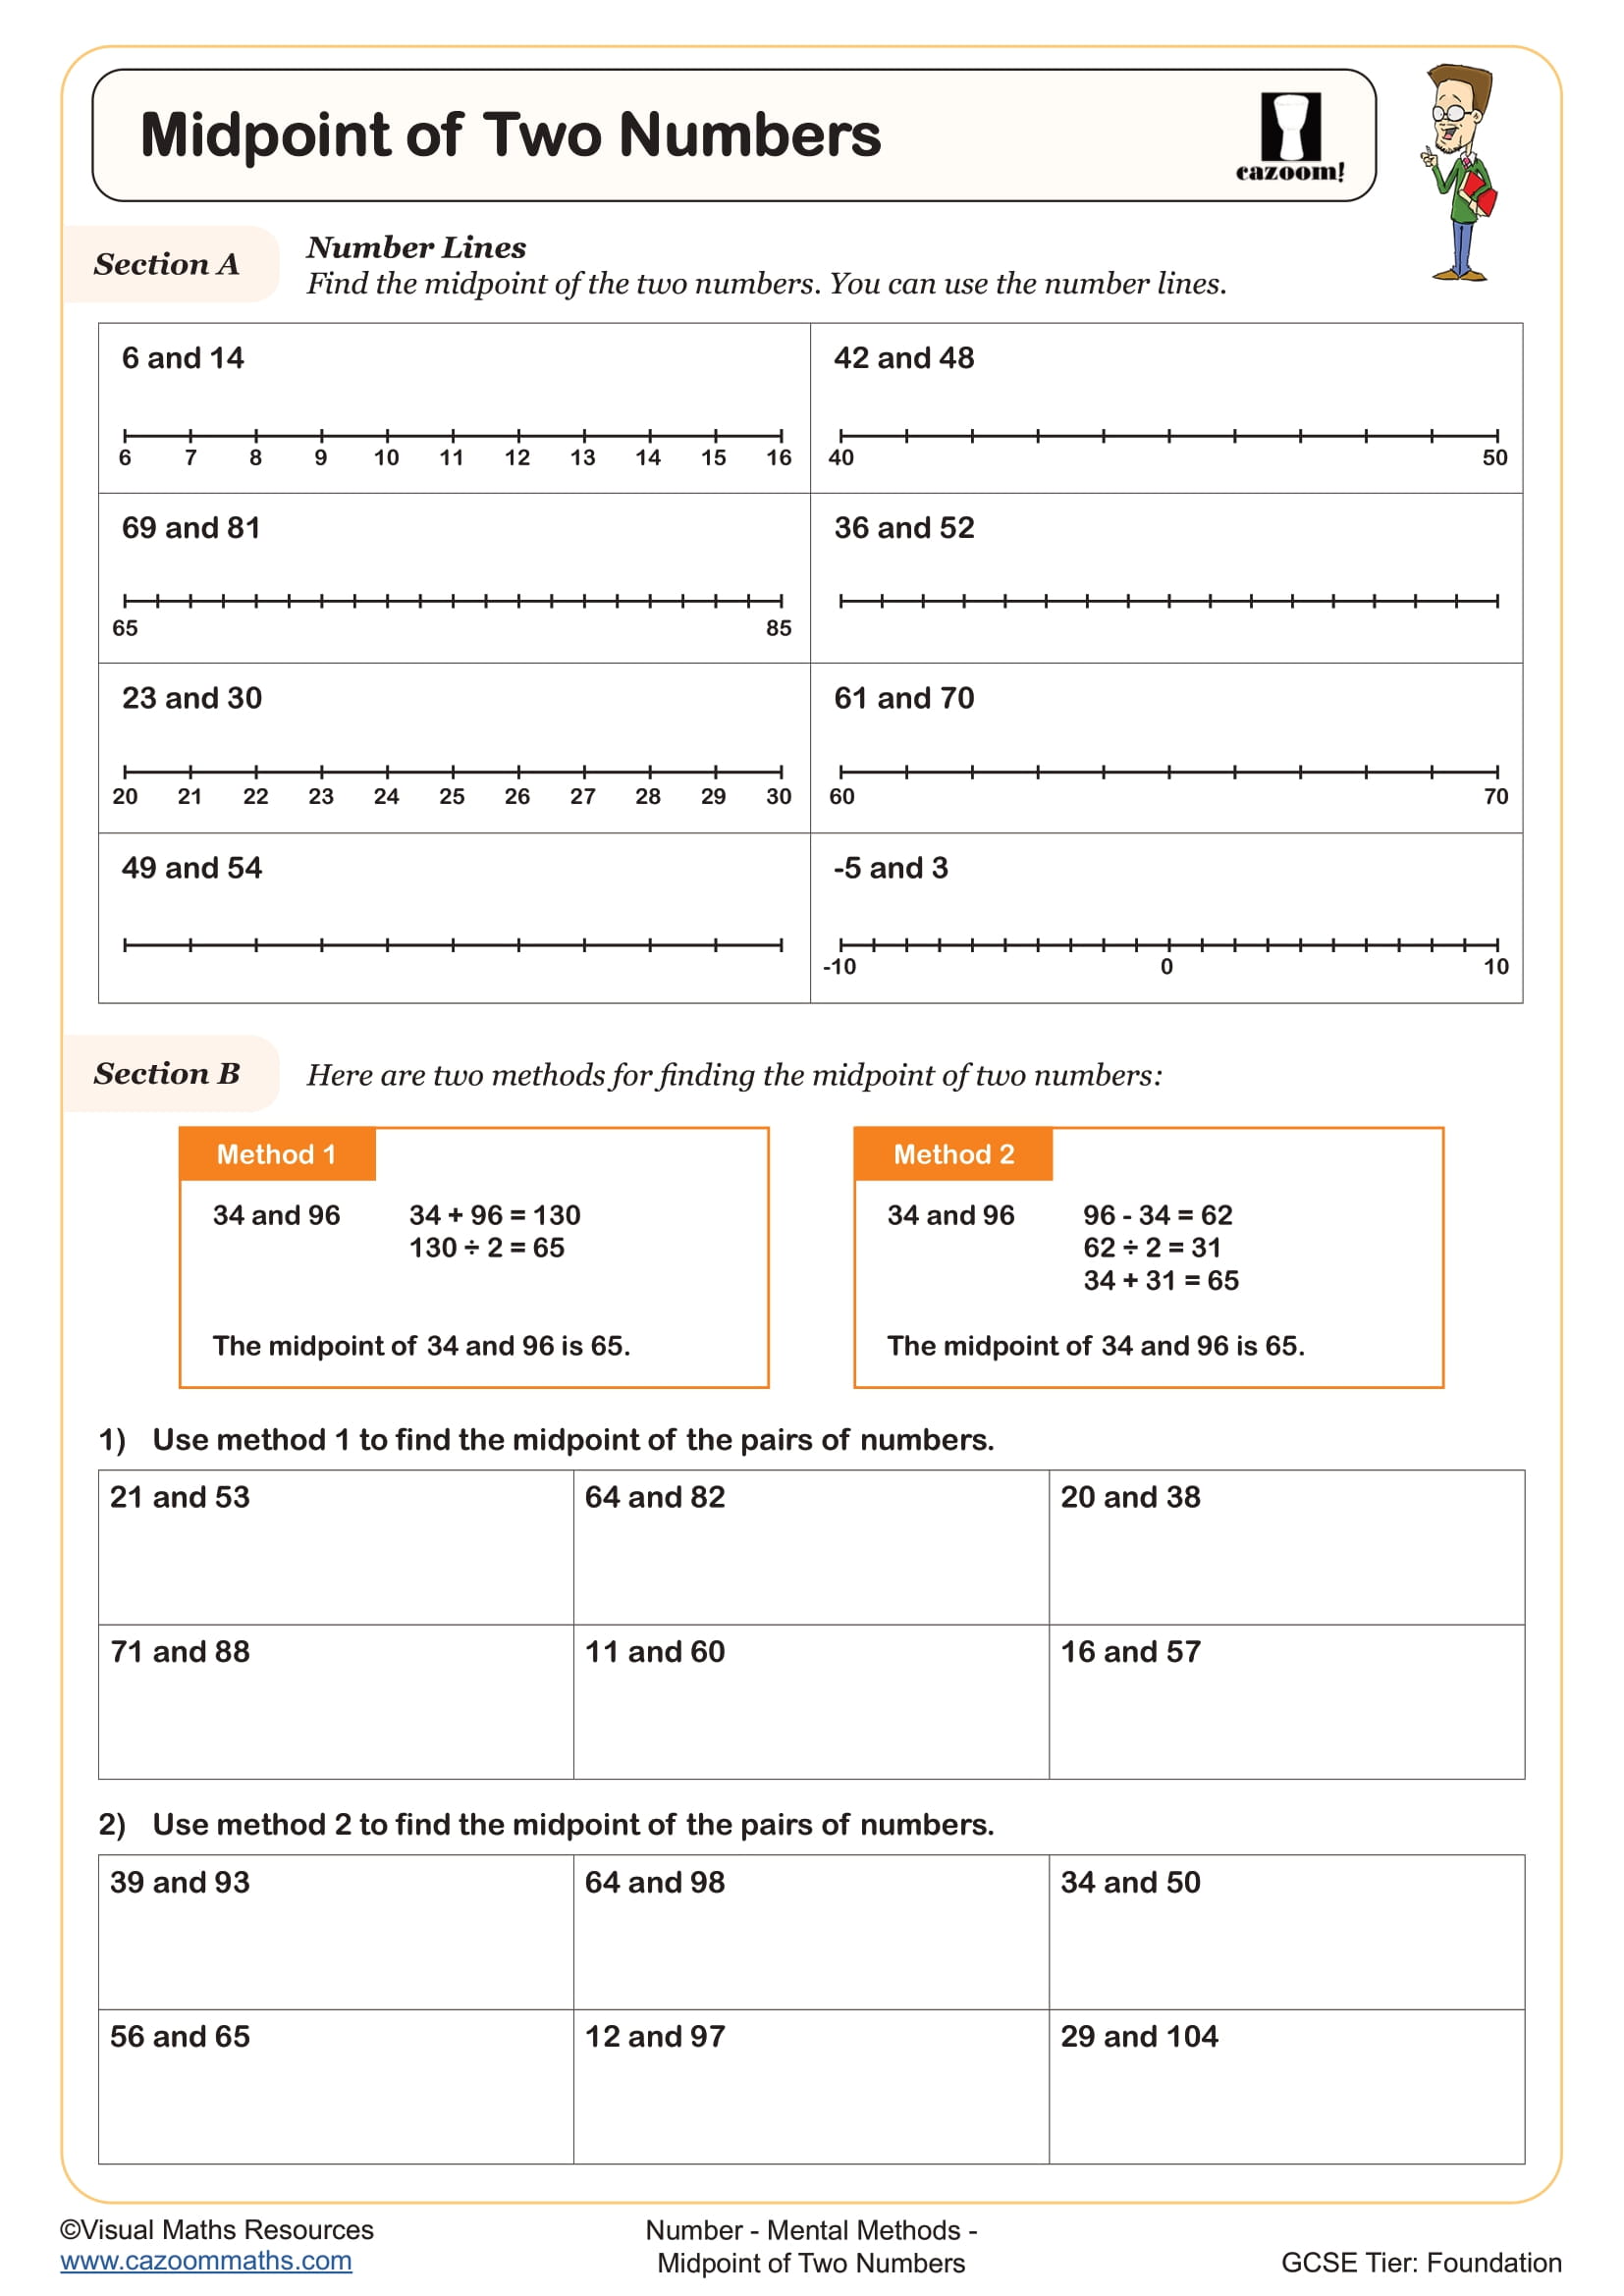
Midpoint of Two Numbers
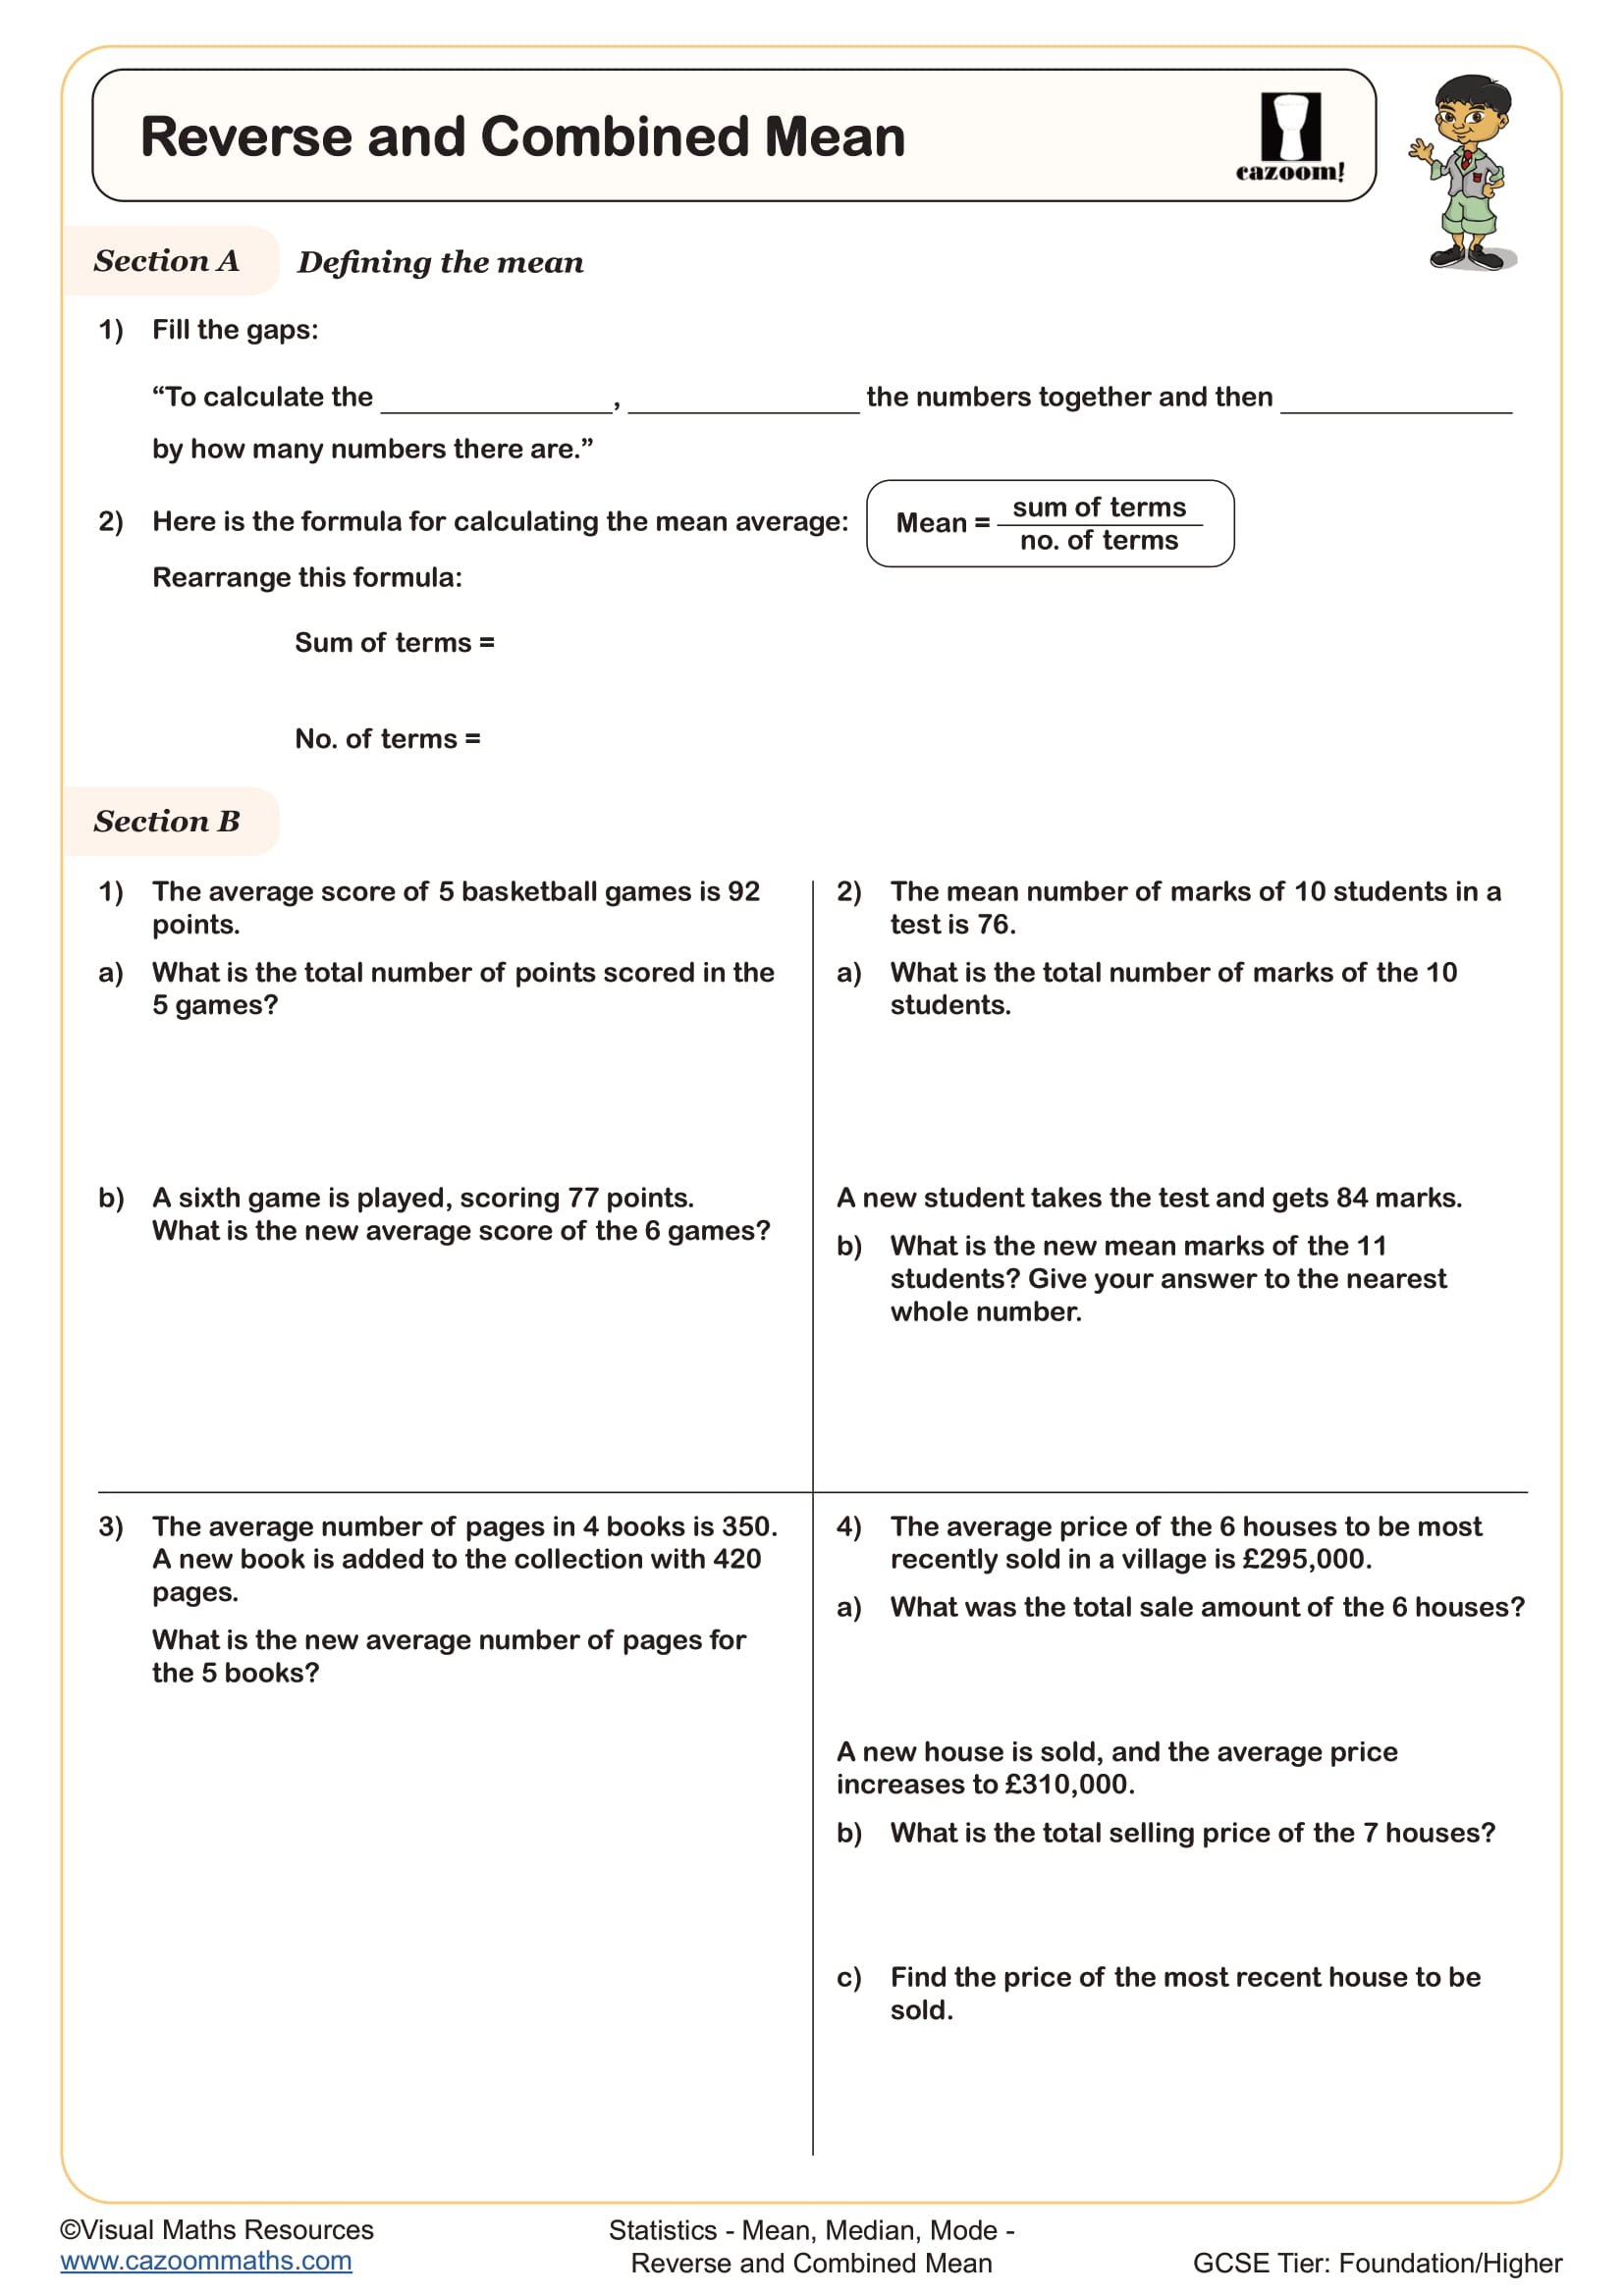
Reverse and Combined Mean
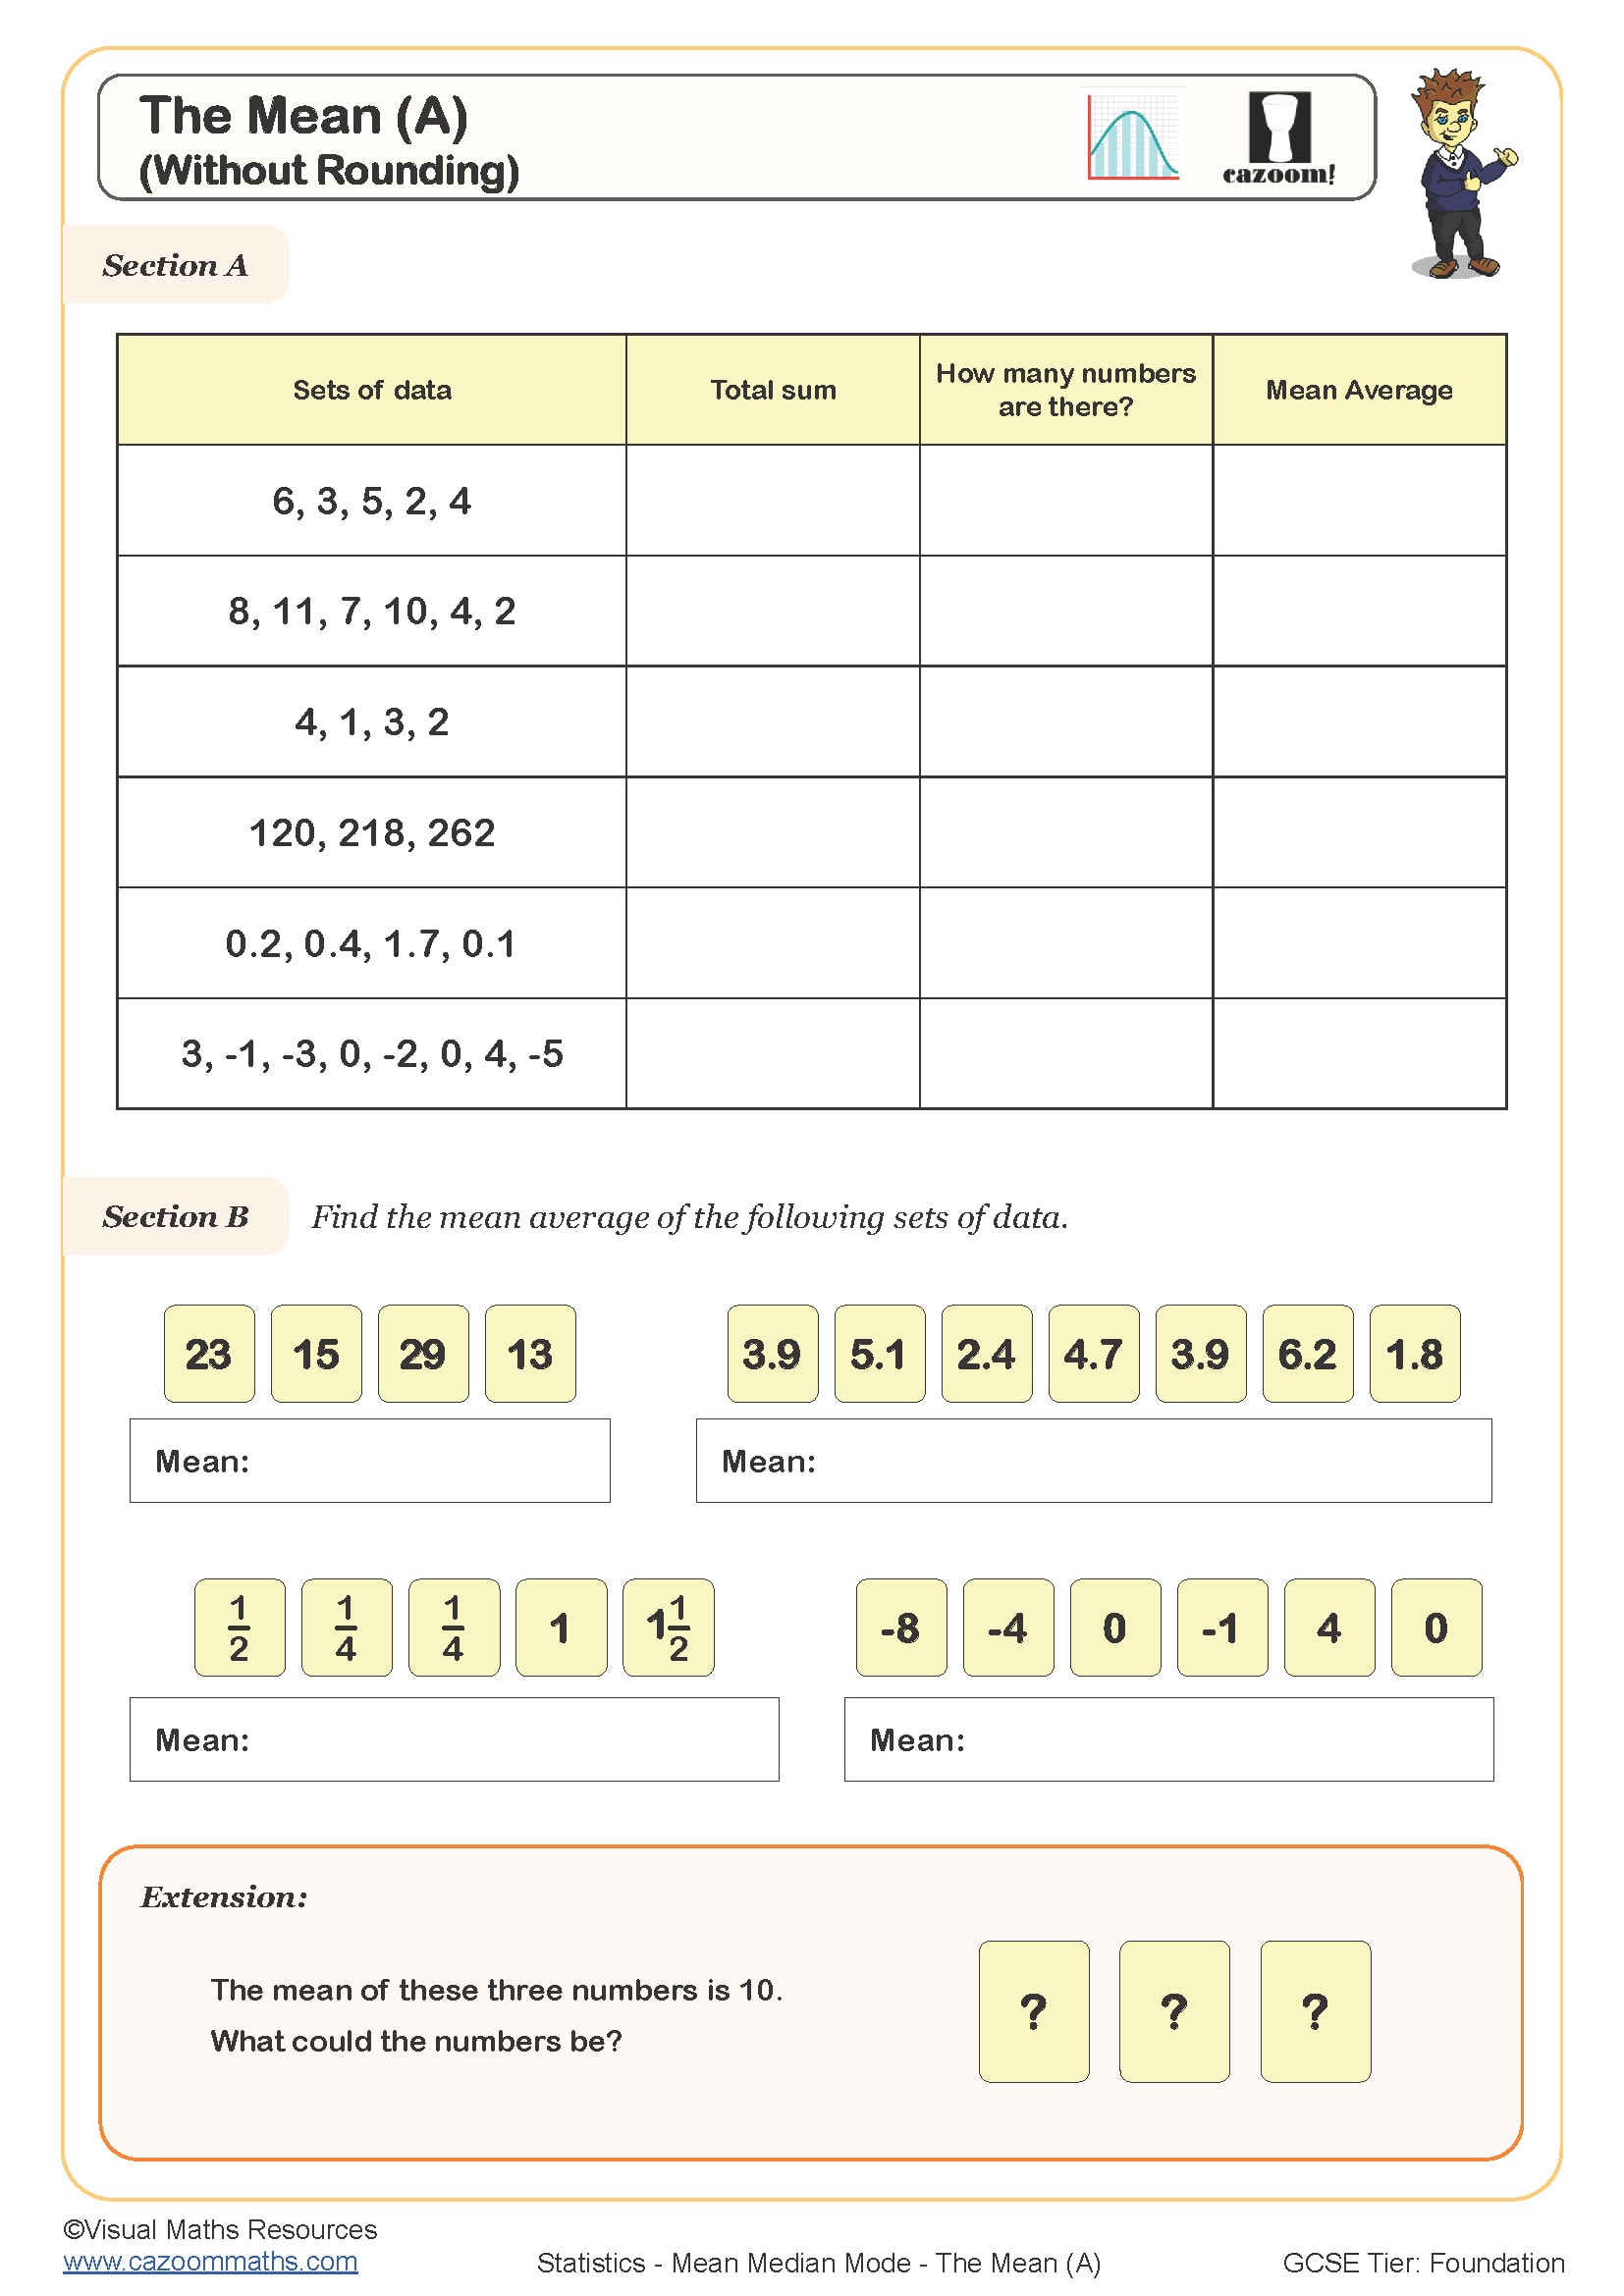
The Mean (A)
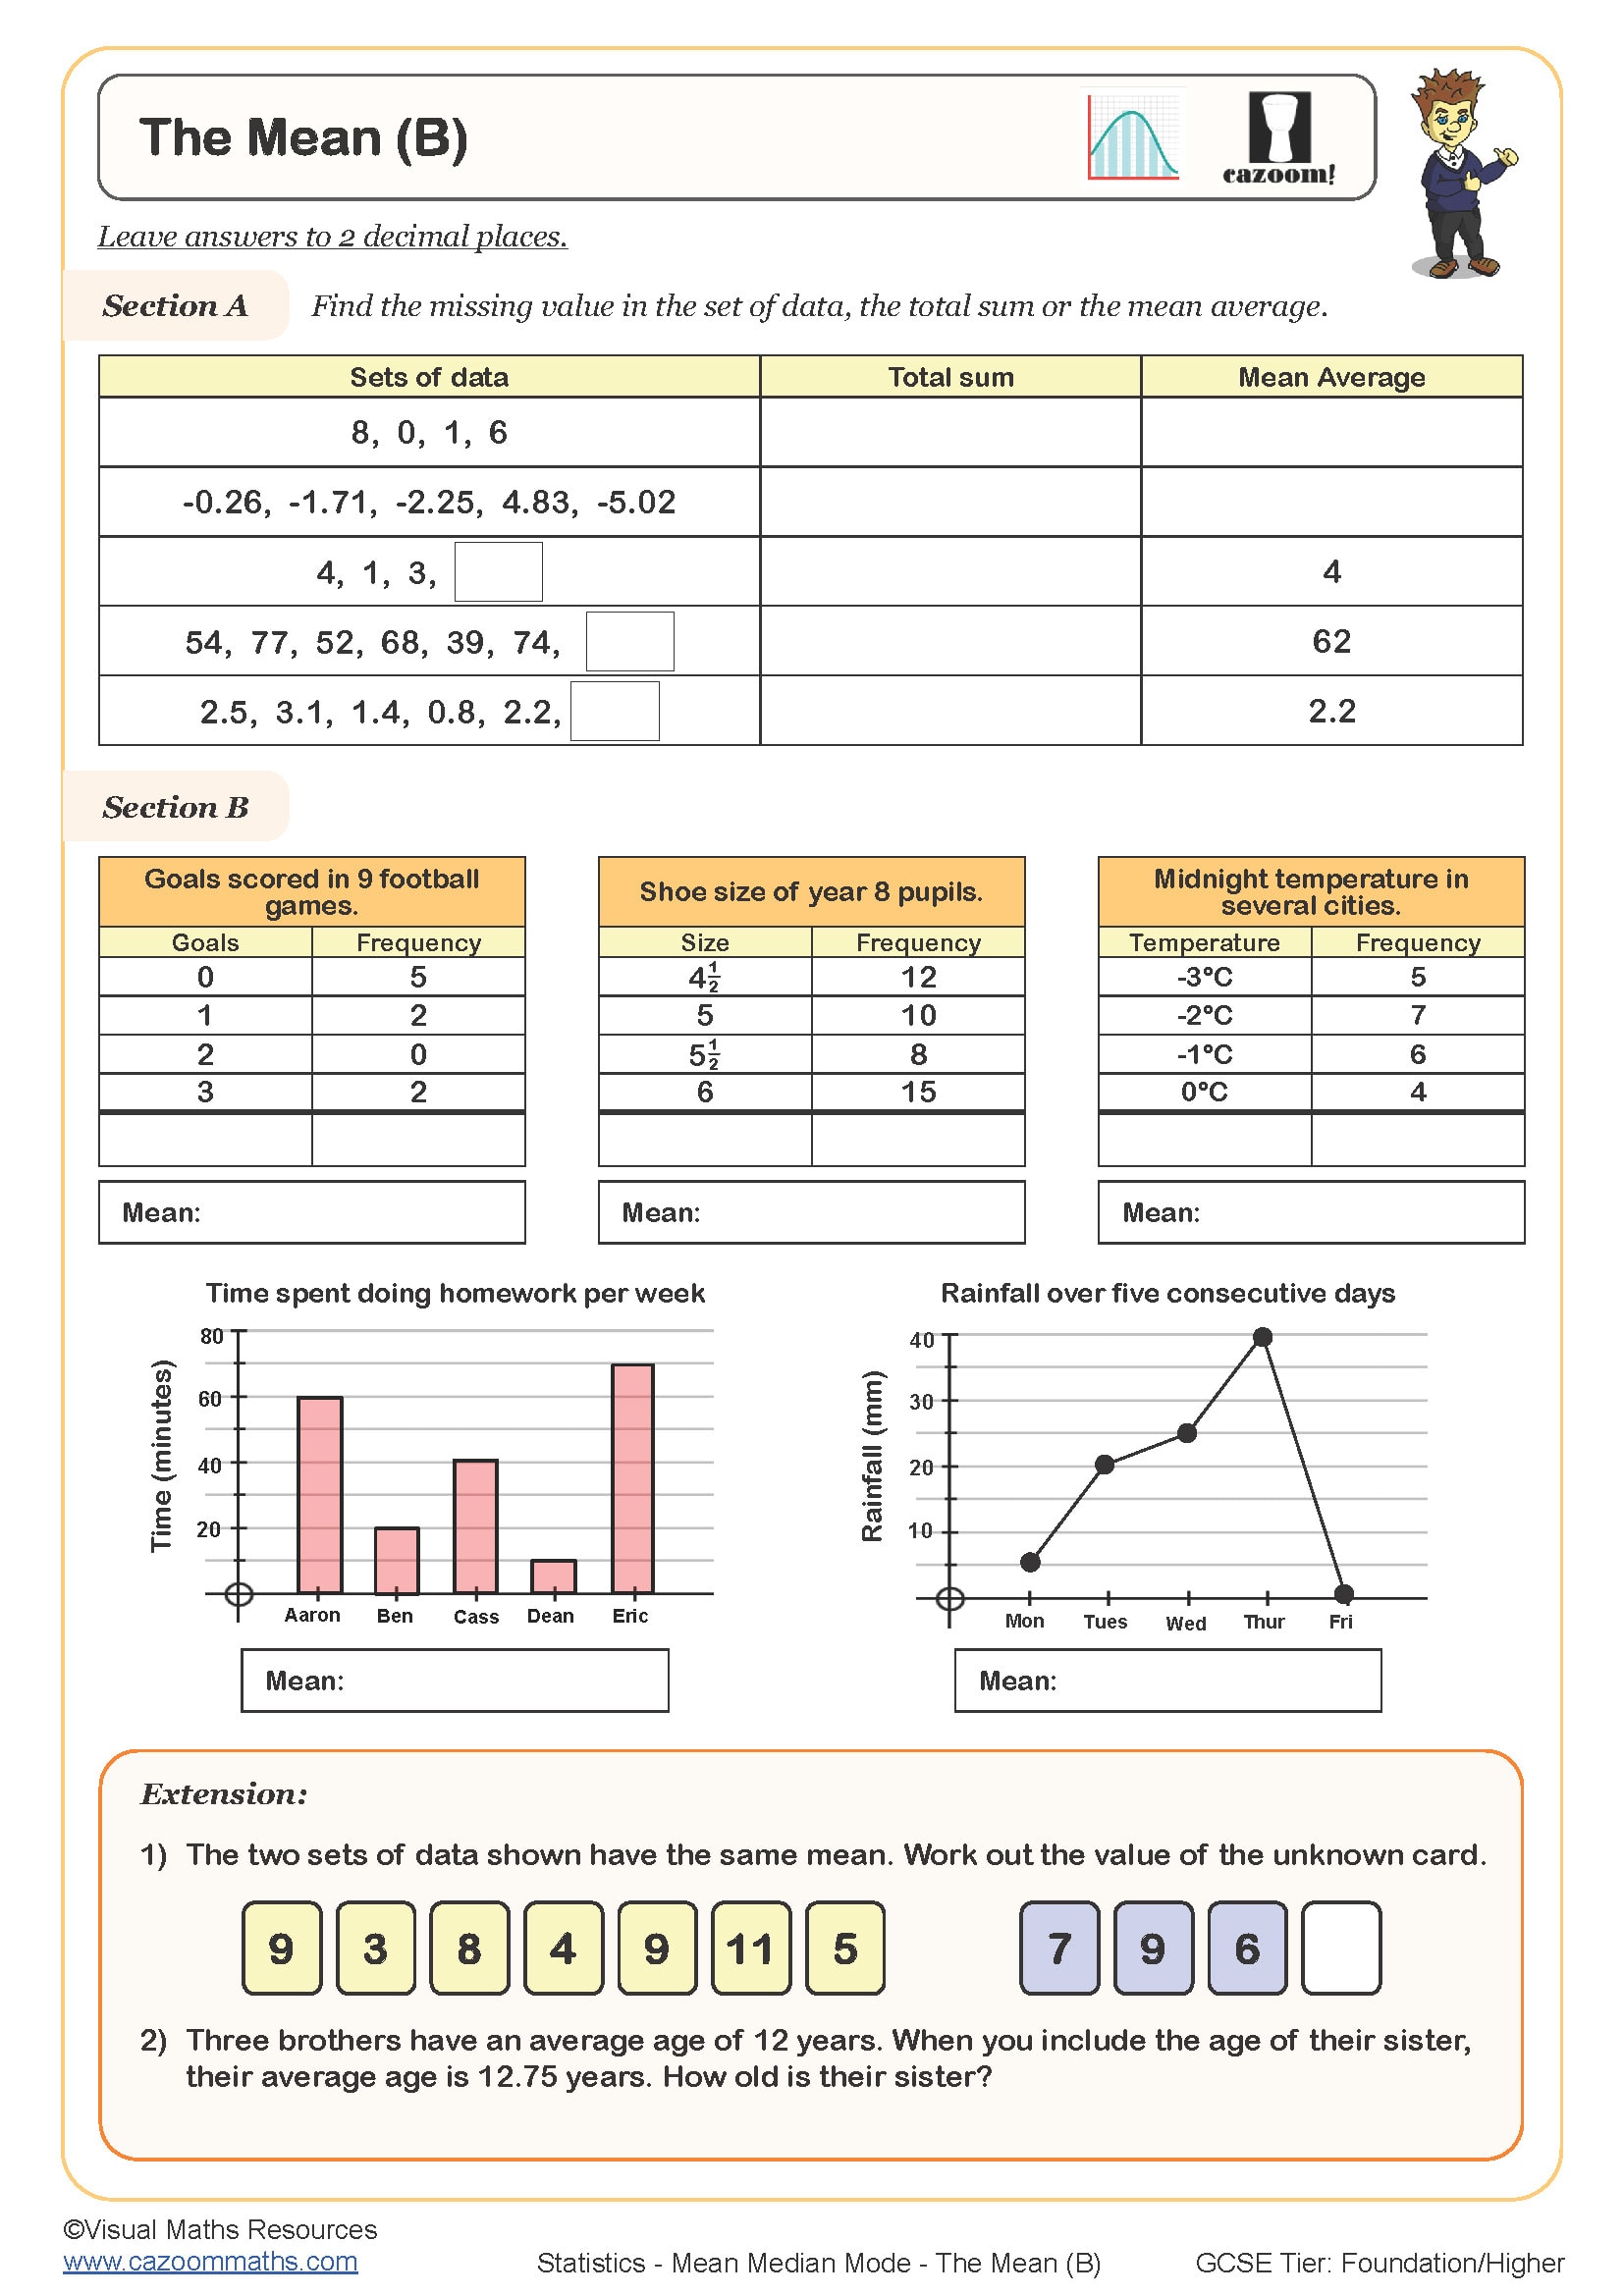
The Mean (B)
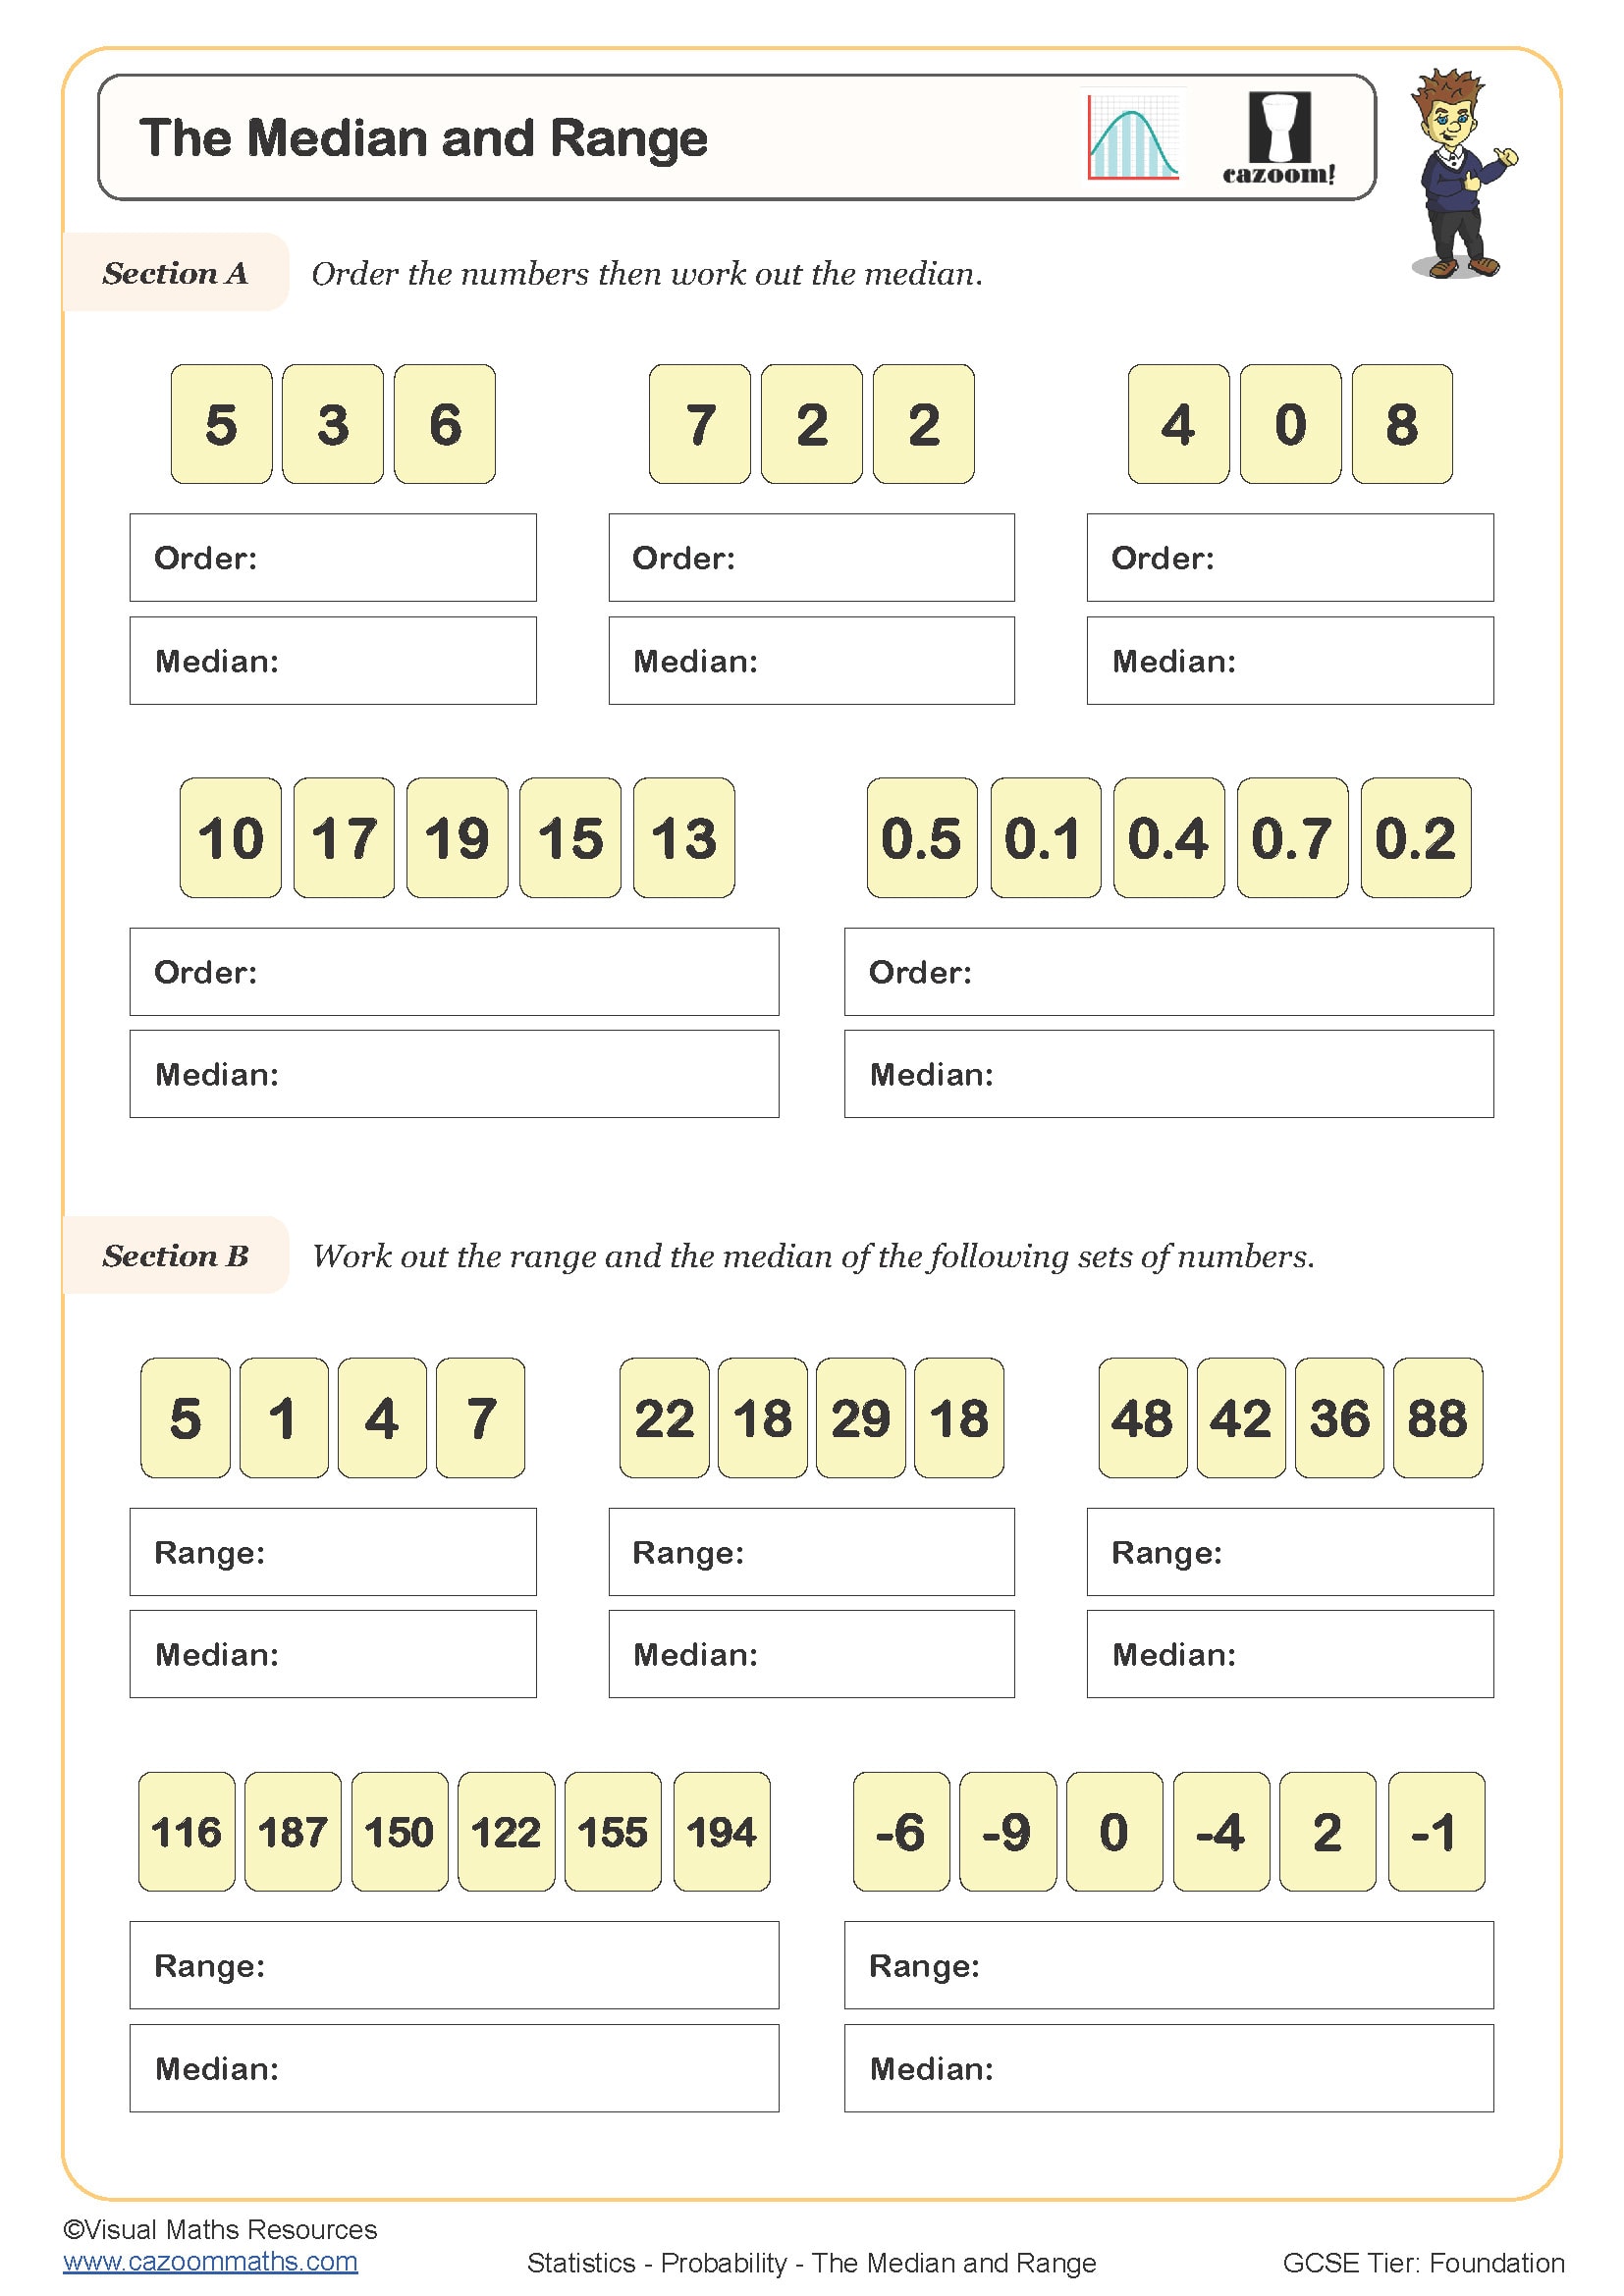
The Median and Range
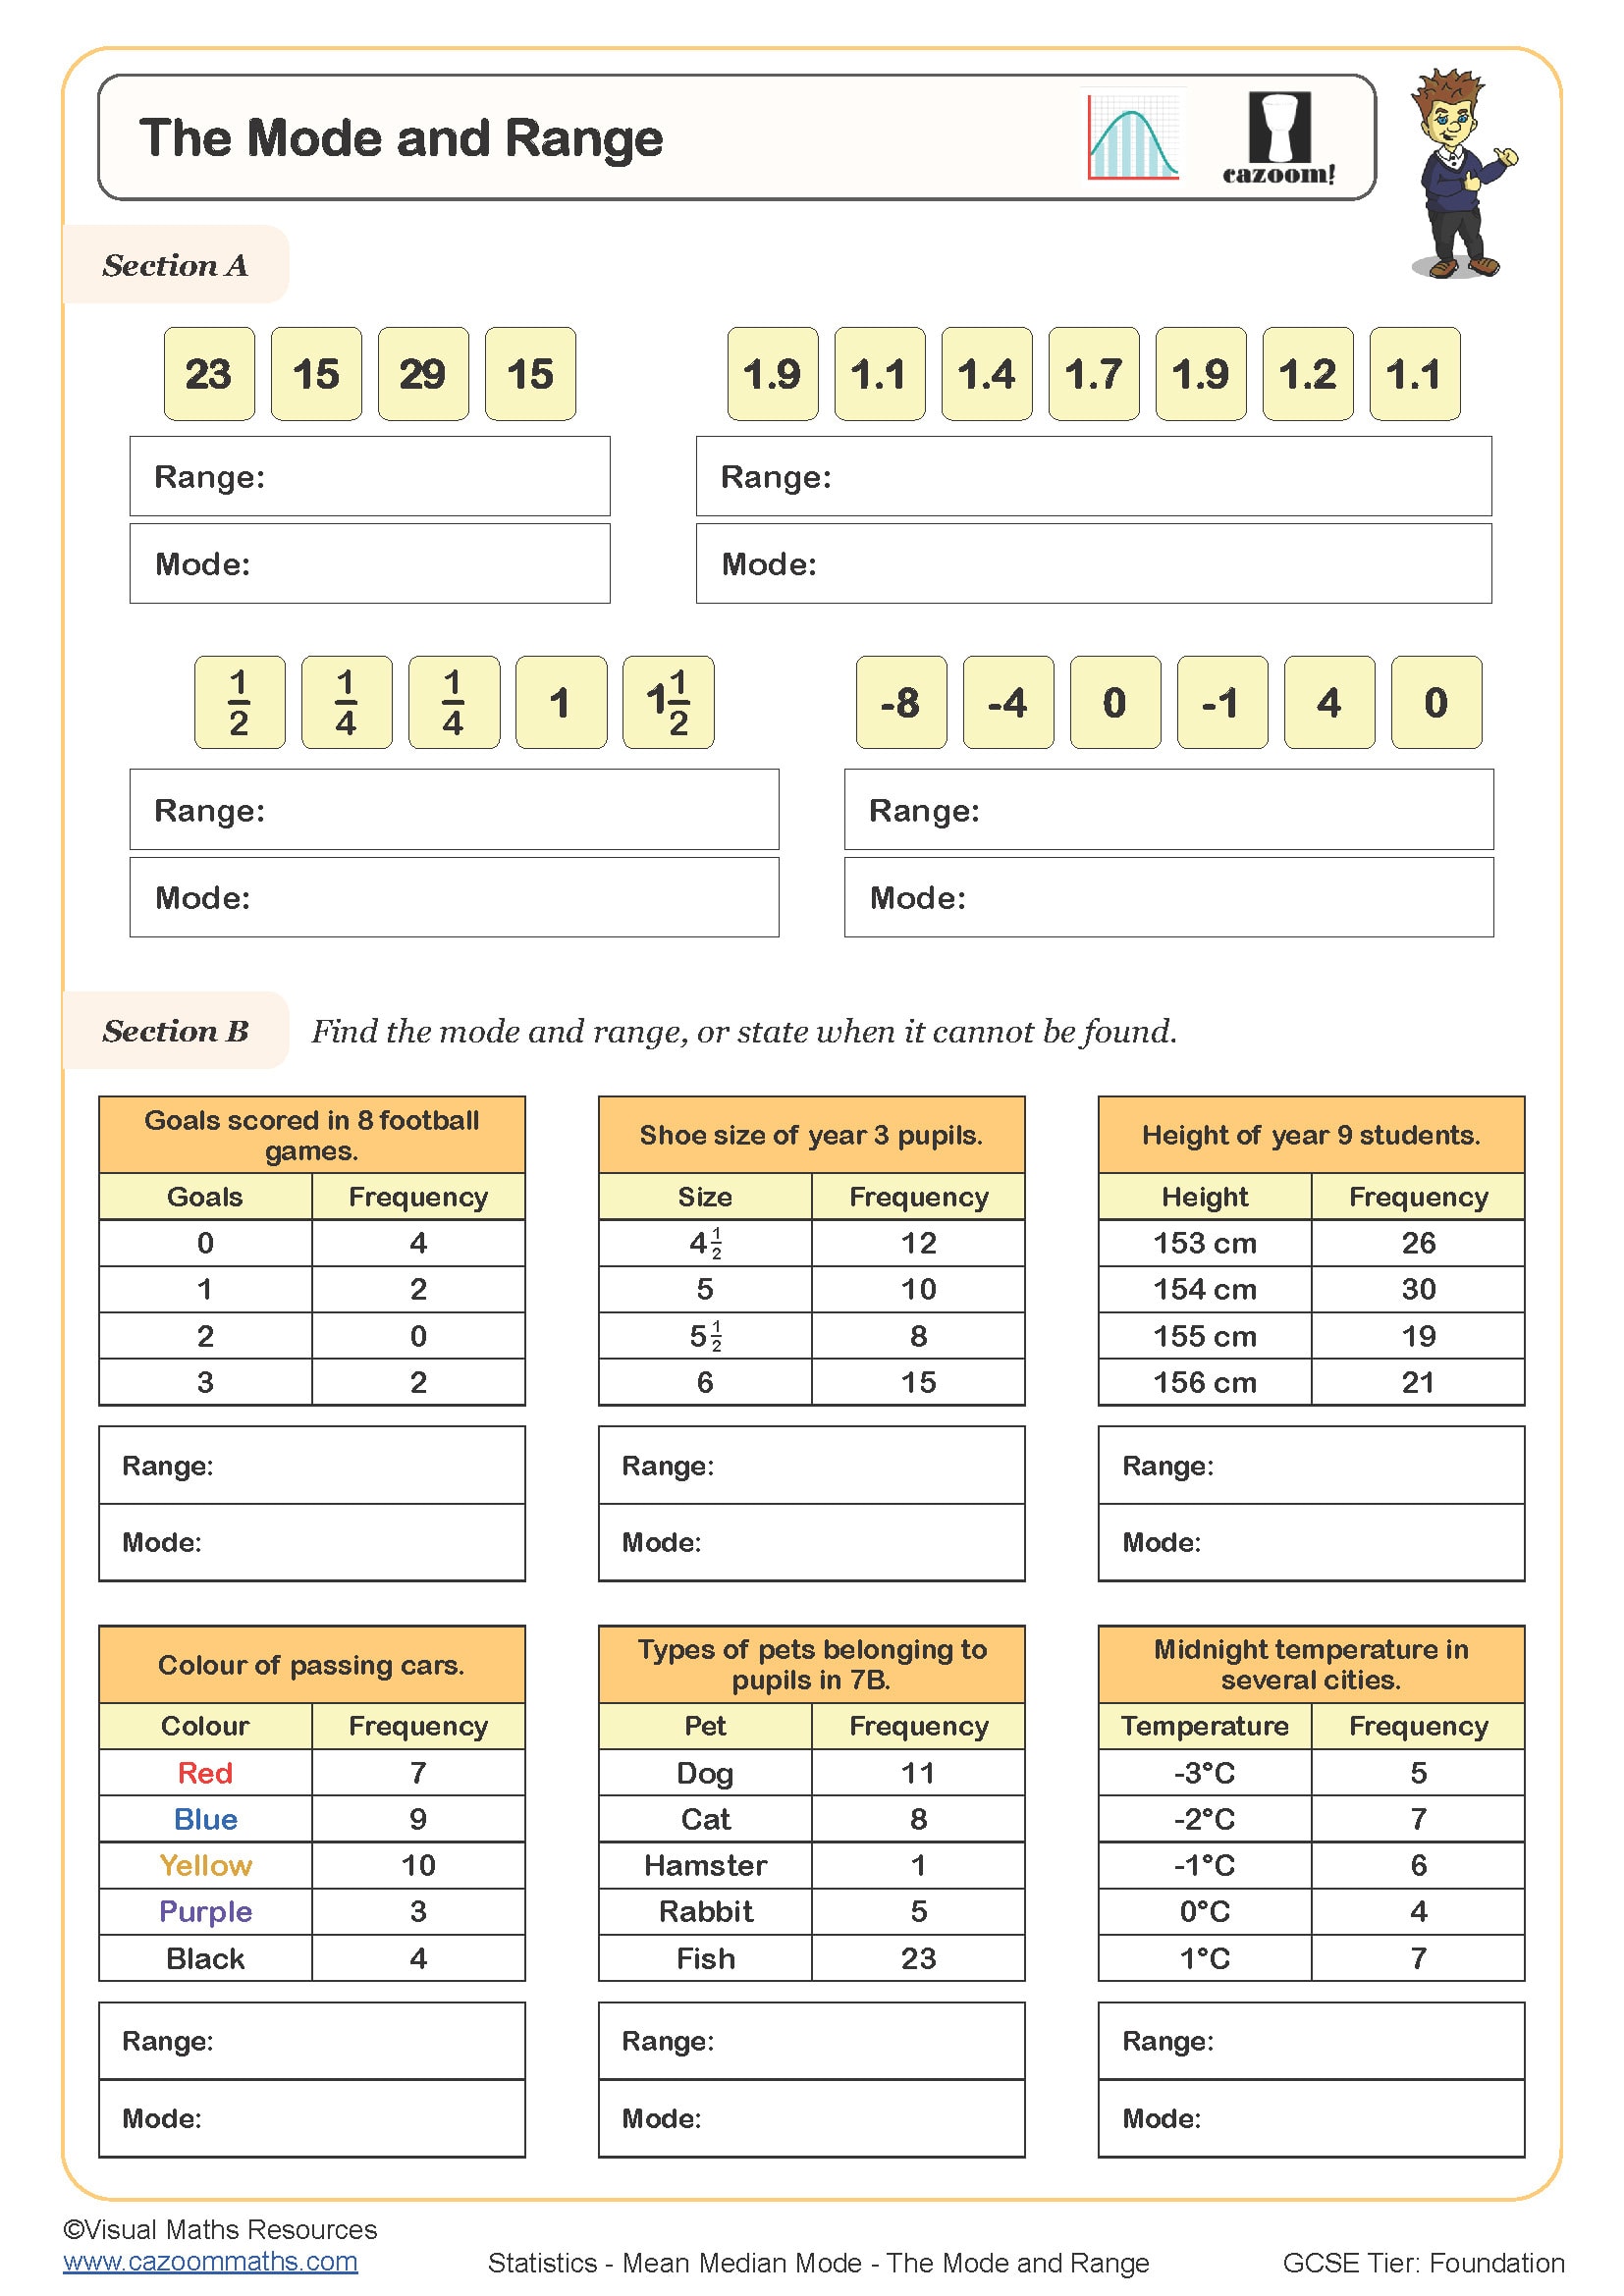
The Mode and Range
All worksheets are created by the team of experienced teachers at Cazoom Maths.
What makes a good mean median mode worksheet?
A quality mean median mode worksheet should progress systematically through each measure of average, starting with simple datasets before introducing more complex scenarios. The best median worksheet activities include both odd and even numbers of values, while mode worksheet questions cover datasets with no mode, one mode, or multiple modes to build thorough understanding.
Teachers notice that effective worksheets include real-world contexts like sports statistics or survey results, as these help students understand when each average is most appropriate. Common errors include confusing the median position with the median value, so quality resources explicitly address this through varied question types and clear worked examples.
Which year groups should use mean median mode worksheets?
Year 7 mean median mode worksheets typically introduce each concept separately using whole numbers and simple datasets, building foundational understanding of how to calculate and interpret each average. This aligns with the KS3 National Curriculum requirement to collect, organise and interpret data using appropriate statistical measures.
Year 8 mean median mode worksheets advance to more complex scenarios including decimal values, frequency tables, and comparative analysis of different averages. By Year 9, students tackle grouped data and estimated means, preparing for GCSE Statistics requirements where they must demonstrate fluency across all measures of central tendency in varied contexts.
How do students find the mean from frequency tables?
Finding the mean from frequency tables requires multiplying each value by its frequency, then dividing the total by the sum of all frequencies. This method often confuses students initially because they forget to multiply before adding, leading to incorrect calculations that teachers regularly encounter during marking.
The key insight teachers share is emphasising that frequency represents 'how many times' each value appears, so students must account for repeated values. Effective practice includes checking answers by listing out all individual values when possible, helping students verify their frequency table method produces the same result as the standard mean calculation.
How should teachers use these mean median mode worksheets effectively?
Teachers find success by introducing each average separately before combining them, allowing students to master individual concepts before comparing measures. Starting with the mode often works well as it requires no calculation, building confidence before tackling the mean's arithmetic demands and the median's ordering requirements.
Classroom experience suggests spacing practice across multiple lessons rather than intensive single sessions, as students need time to distinguish between the three measures. Using the answer sheets for immediate feedback helps students identify errors quickly, while peer marking activities encourage discussion about which average best represents different datasets in various contexts.