KS3 Two-Way Tables and Pictograms Worksheets
All worksheets are created by the team of experienced teachers at Cazoom Maths.
What are two-way tables in KS3 maths?
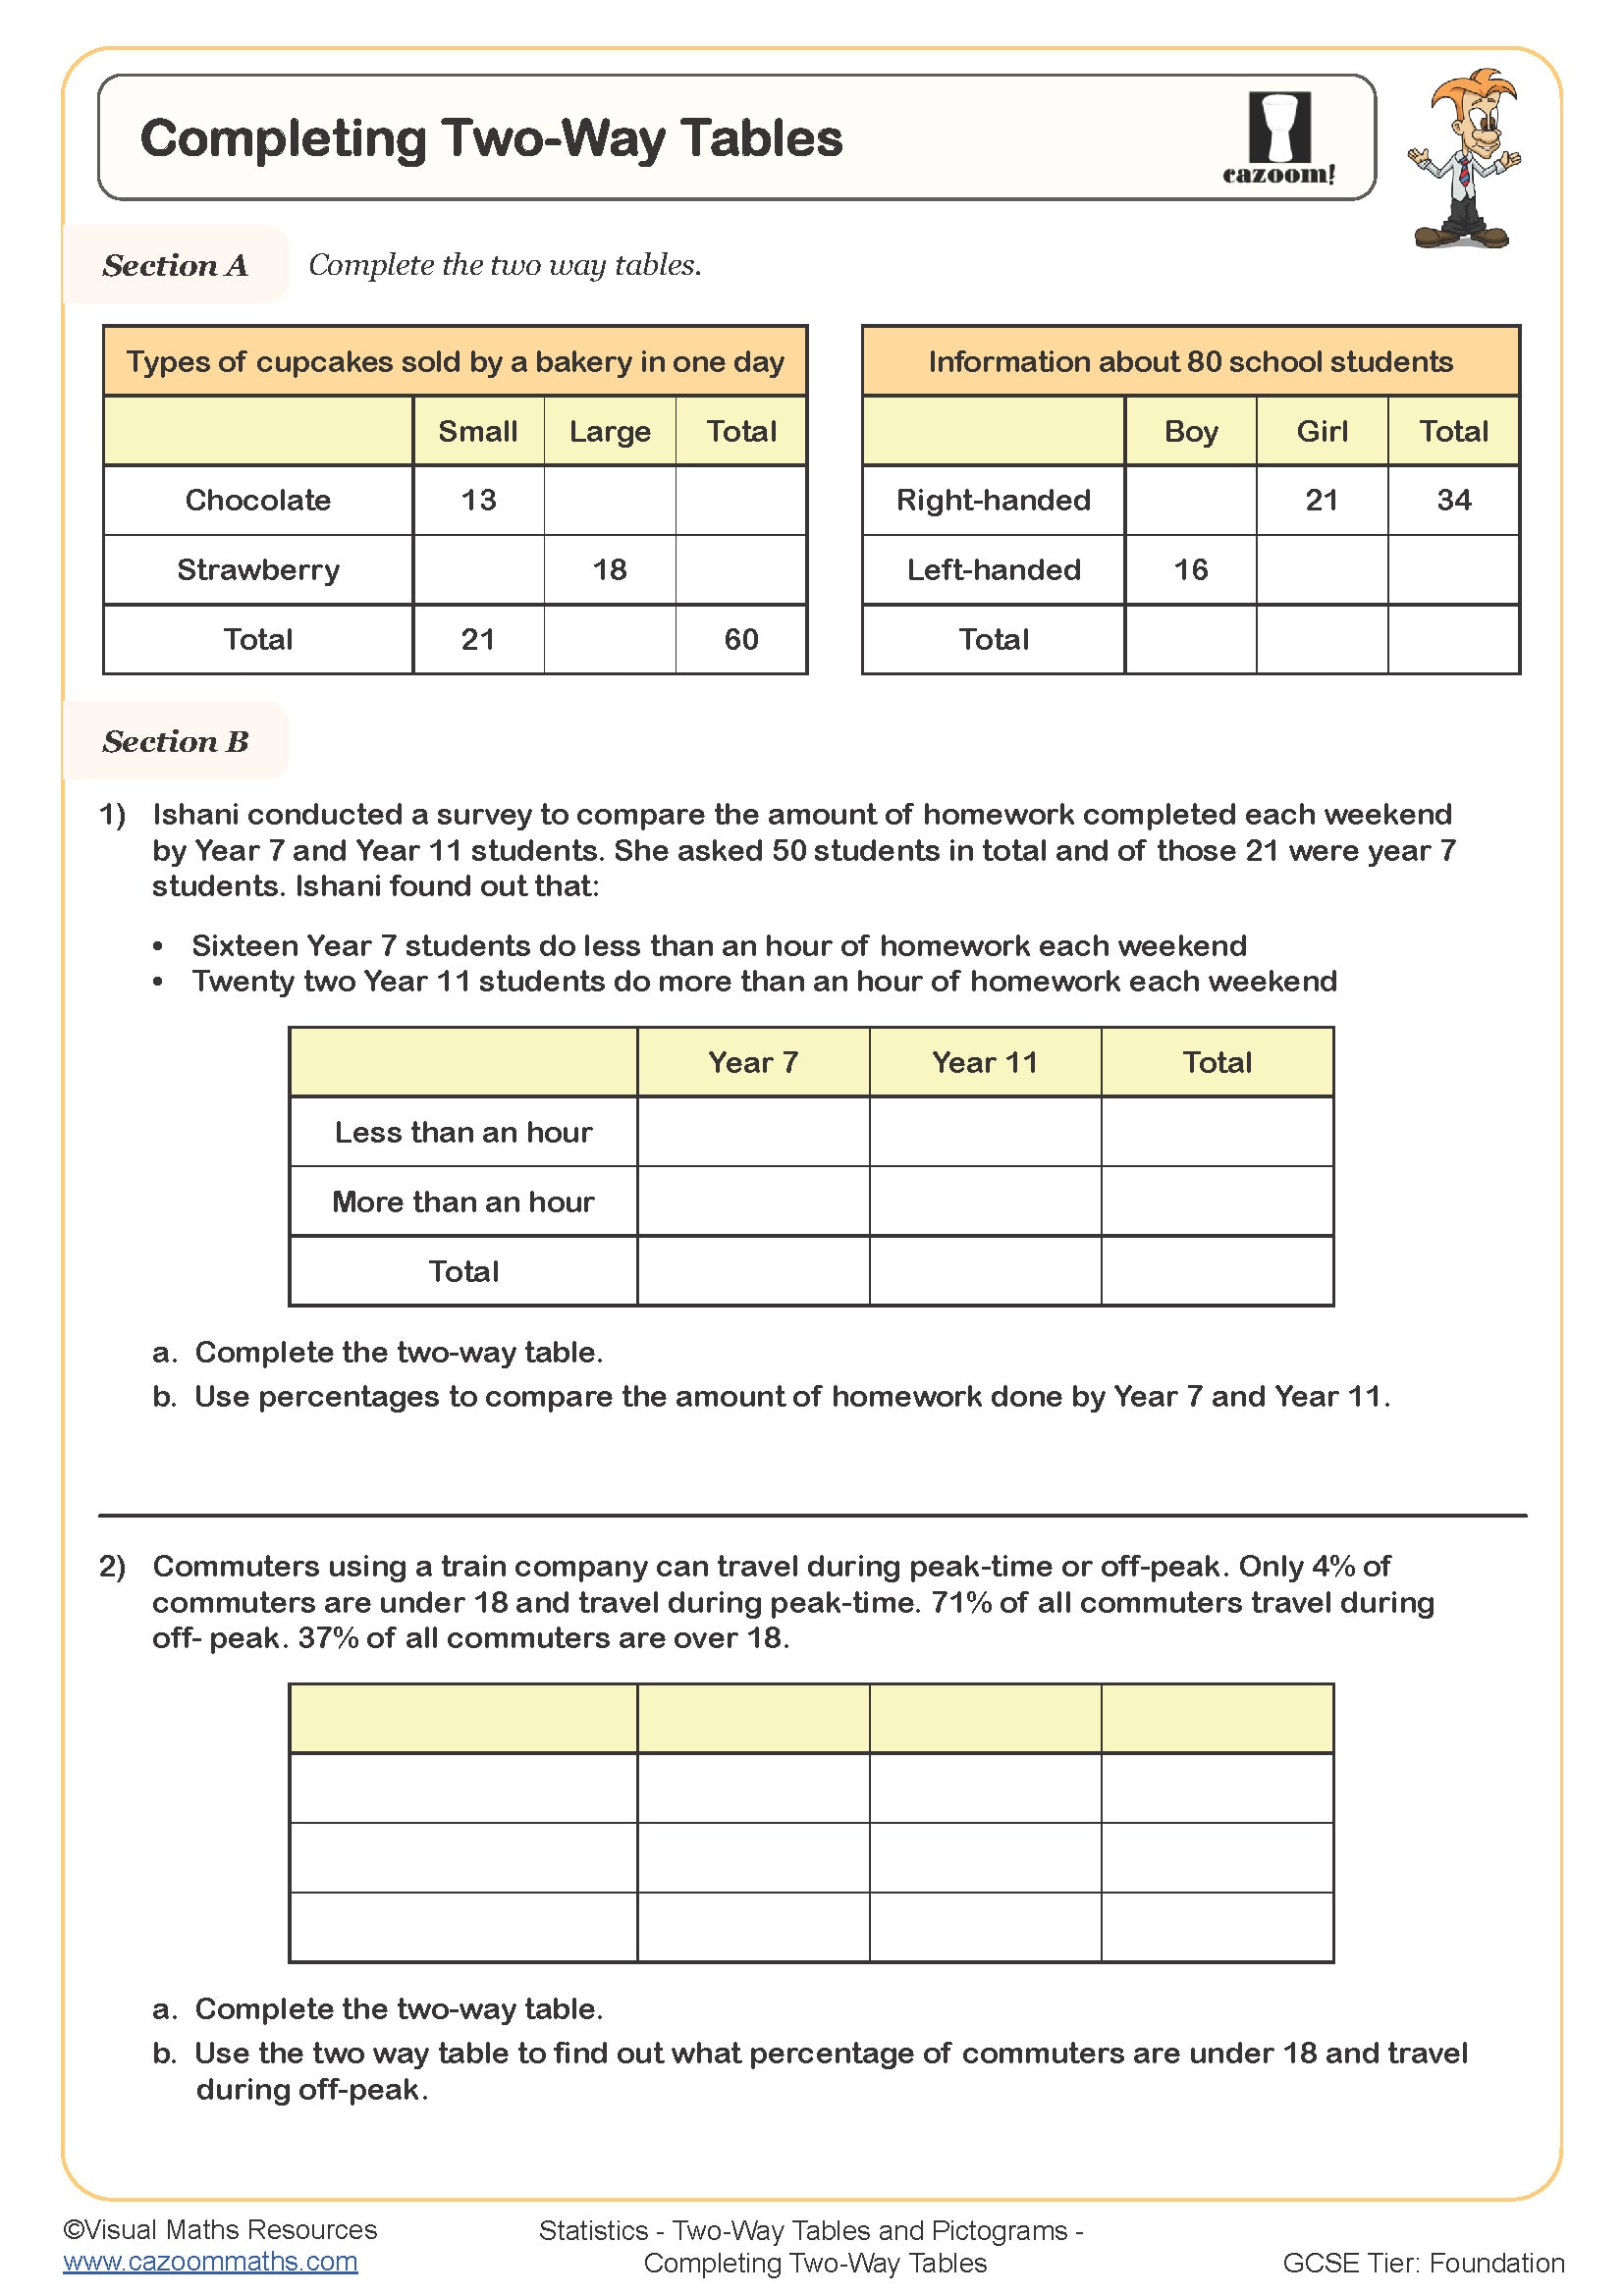
Two-way tables are grids that organise data using two different categories, allowing students to see relationships between variables at a glance. In the National Curriculum for KS3, two-way tables appear within the statistics strand as a method for recording and analysing frequency data. Students use rows and columns to categorise information, then calculate totals and identify patterns.
A common error occurs when students fail to account for all the data when completing missing values in two-way tables. Teachers frequently notice students forgetting to check that row and column totals match the overall total, which is a quick verification method. This skill connects directly to GCSE Foundation and Higher tier questions where two-way tables appear alongside probability and relative frequency problems.
Which year groups study two-way tables and pictograms?
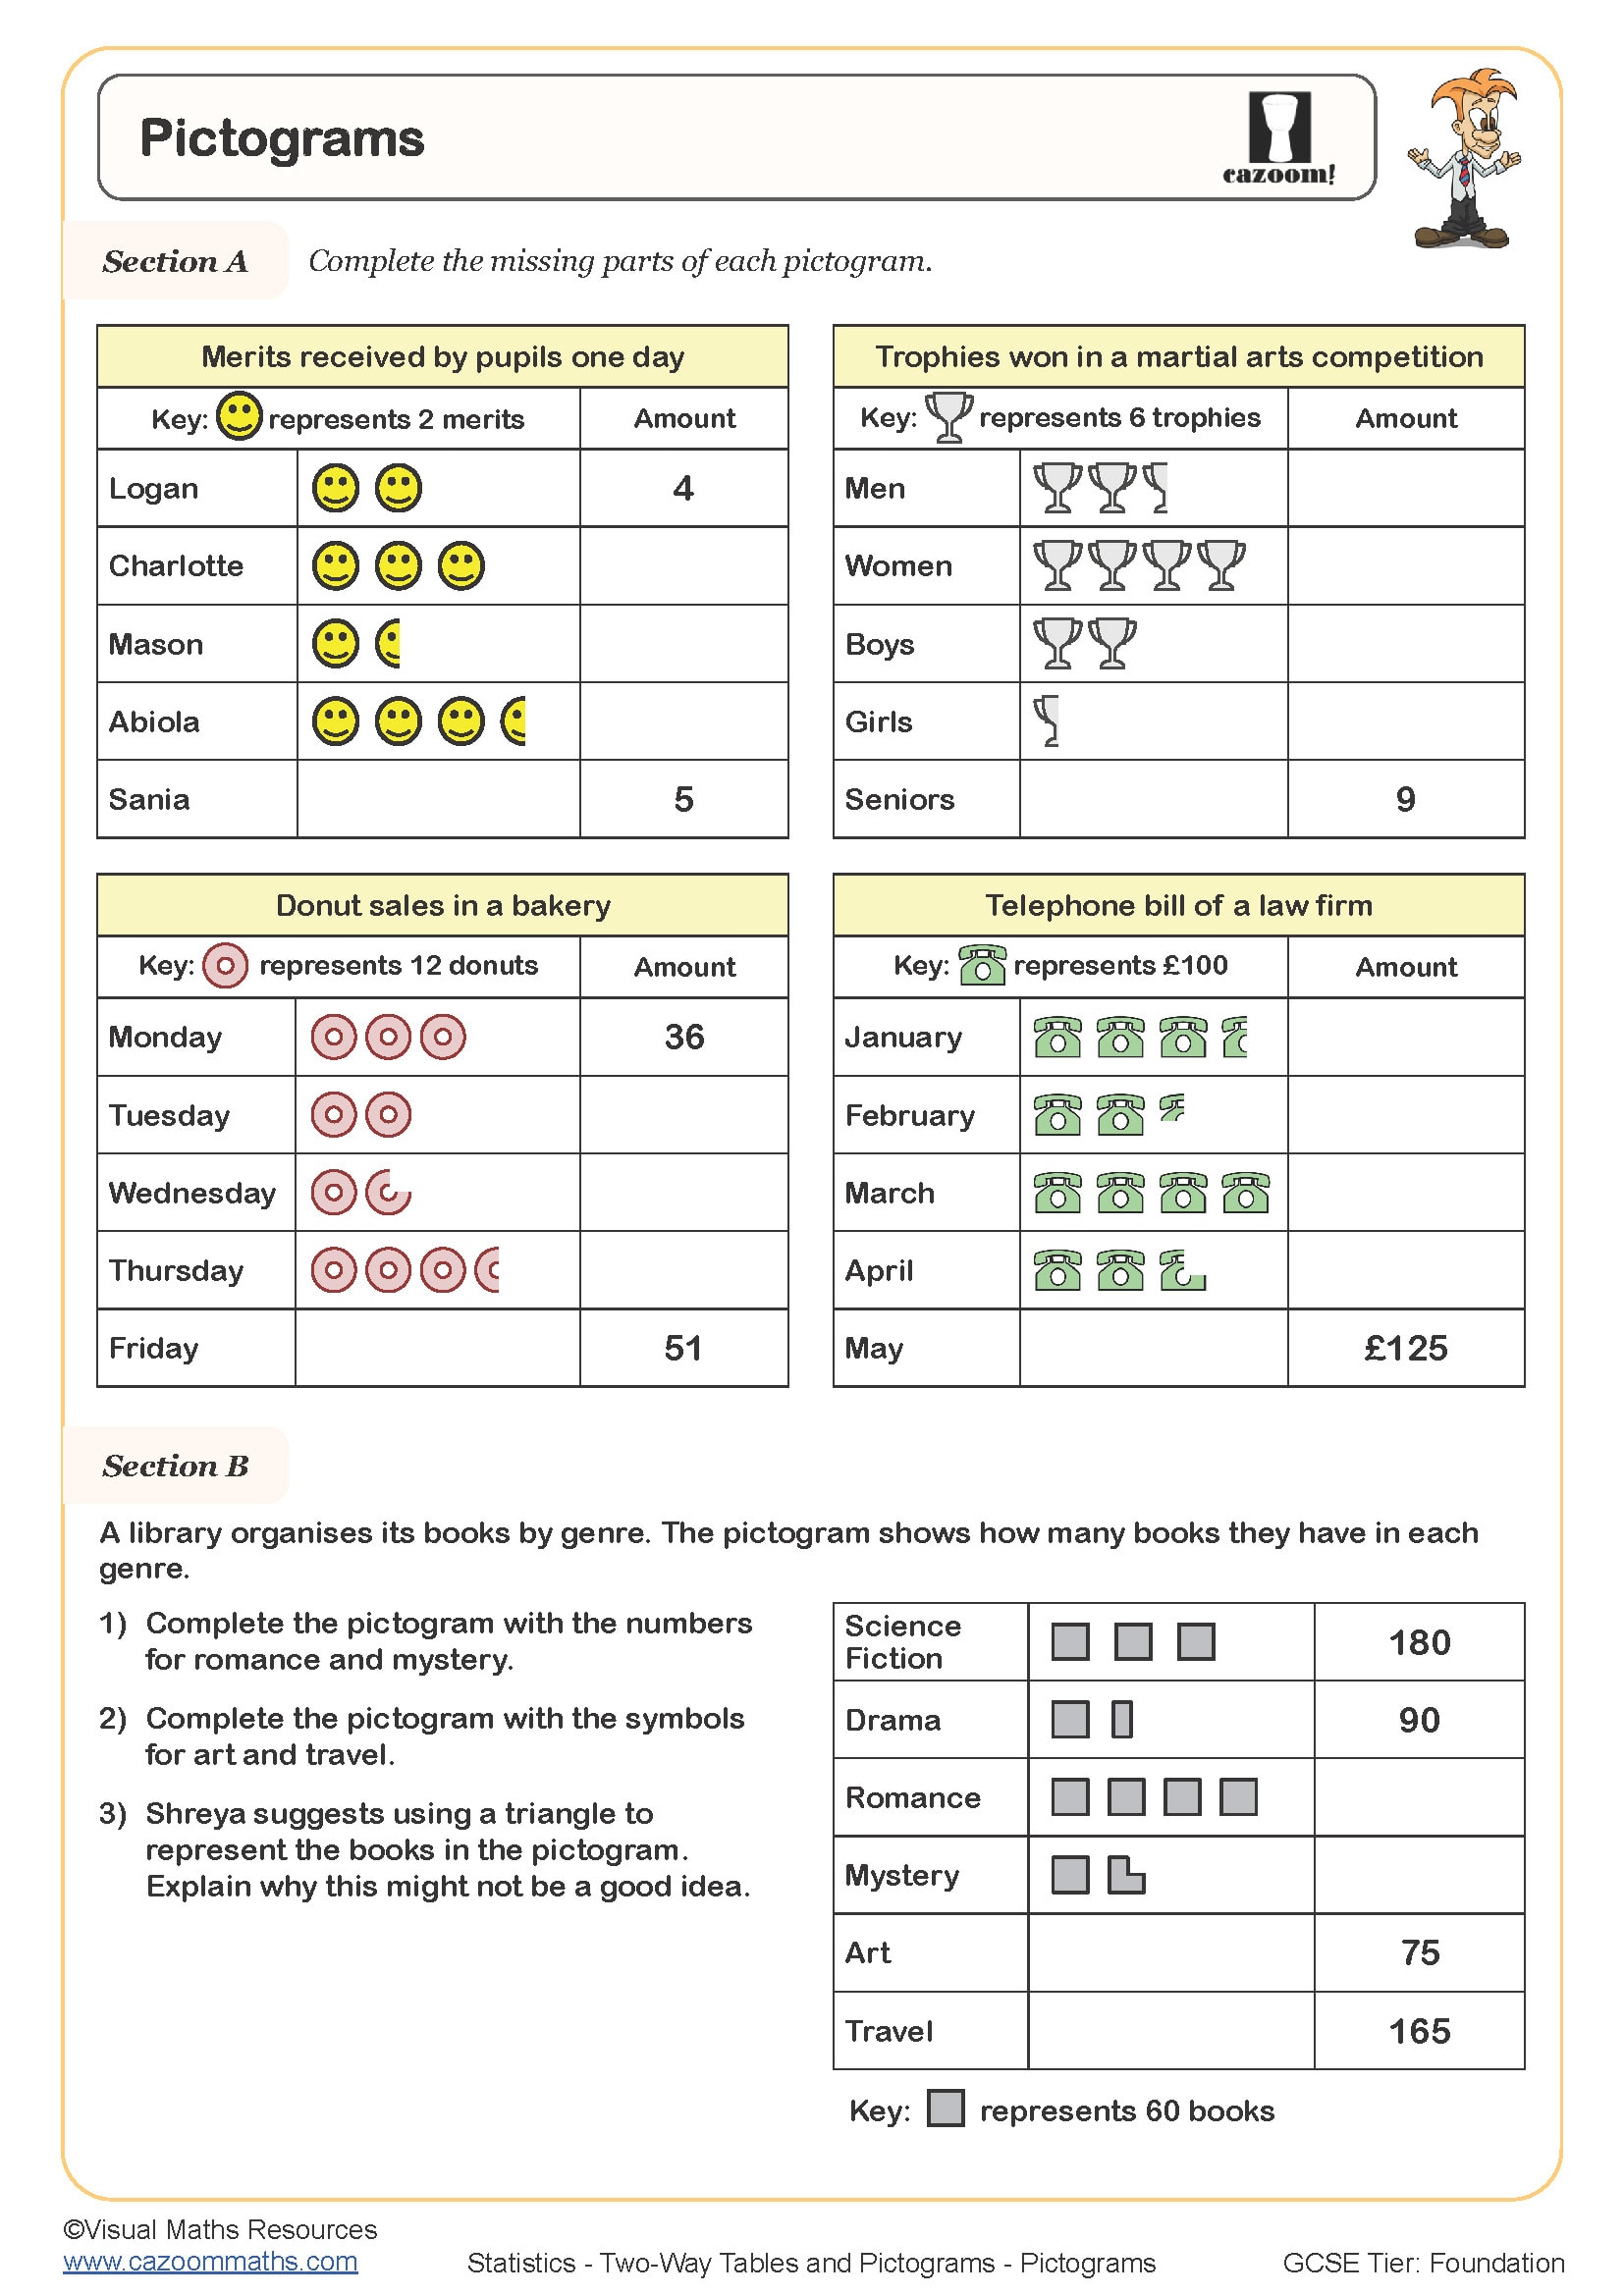
These worksheets cover Year 7, Year 8, and Year 9, spanning the full KS3 programme. Two-way tables and pictograms are typically introduced in Year 7 as foundational data representation methods, building on the pictograms and tally charts from KS2. Students learn to construct simple tables and interpret basic pictograms with straightforward scales.
The progression across KS3 sees increasing complexity in both the data sets and the questions asked. Year 8 students work with more categories and fractional symbols in pictograms, whilst Year 9 tasks involve missing information, reverse problems, and combining two-way tables with other statistical concepts like averages. By the end of KS3, students should confidently handle multi-step problems that require extracting and manipulating data from these visual formats.
How do you calculate totals in two-way tables?
Calculating totals in two-way tables involves systematically adding values across rows and down columns, then verifying that the row totals sum to match the column totals. Students work horizontally to find row totals, vertically for column totals, and check their work by confirming the grand total appears in the bottom-right cell. This cross-checking method helps identify calculation errors quickly.
This skill has direct applications in business and healthcare settings where data categorisation is essential. Shops use two-way tables to track product sales across different locations and time periods, whilst medical researchers organise patient data by age groups and treatment types. Understanding how to construct and verify these tables prepares students for handling real datasets in science investigations and geography fieldwork, where accurate data recording underpins valid conclusions.
How can these worksheets support classroom learning?
The worksheets provide structured practice with carefully sequenced questions that build from basic interpretation to multi-step problems requiring students to complete missing entries. Each worksheet includes worked examples or clear instructions that model the expected method, allowing students to tackle increasingly complex scenarios independently. The inclusion of both two-way tables and pictograms on the same resource helps students compare different data representation methods.
Teachers find these resources particularly effective for differentiated homework tasks, where different year groups can work on appropriately pitched problems. The answer sheets make them valuable for intervention sessions, as students can self-check their work and identify specific areas needing support. Many teachers use individual questions as lesson starters or set paired activities where students create their own two-way tables for classmates to complete, reinforcing both construction and interpretation skills simultaneously.