KS4 Cumulative Frequency and Box Plots Worksheets
All worksheets are created by the team of experienced teachers at Cazoom Maths.
What are the common mistakes students make with cumulative frequency and box plots?
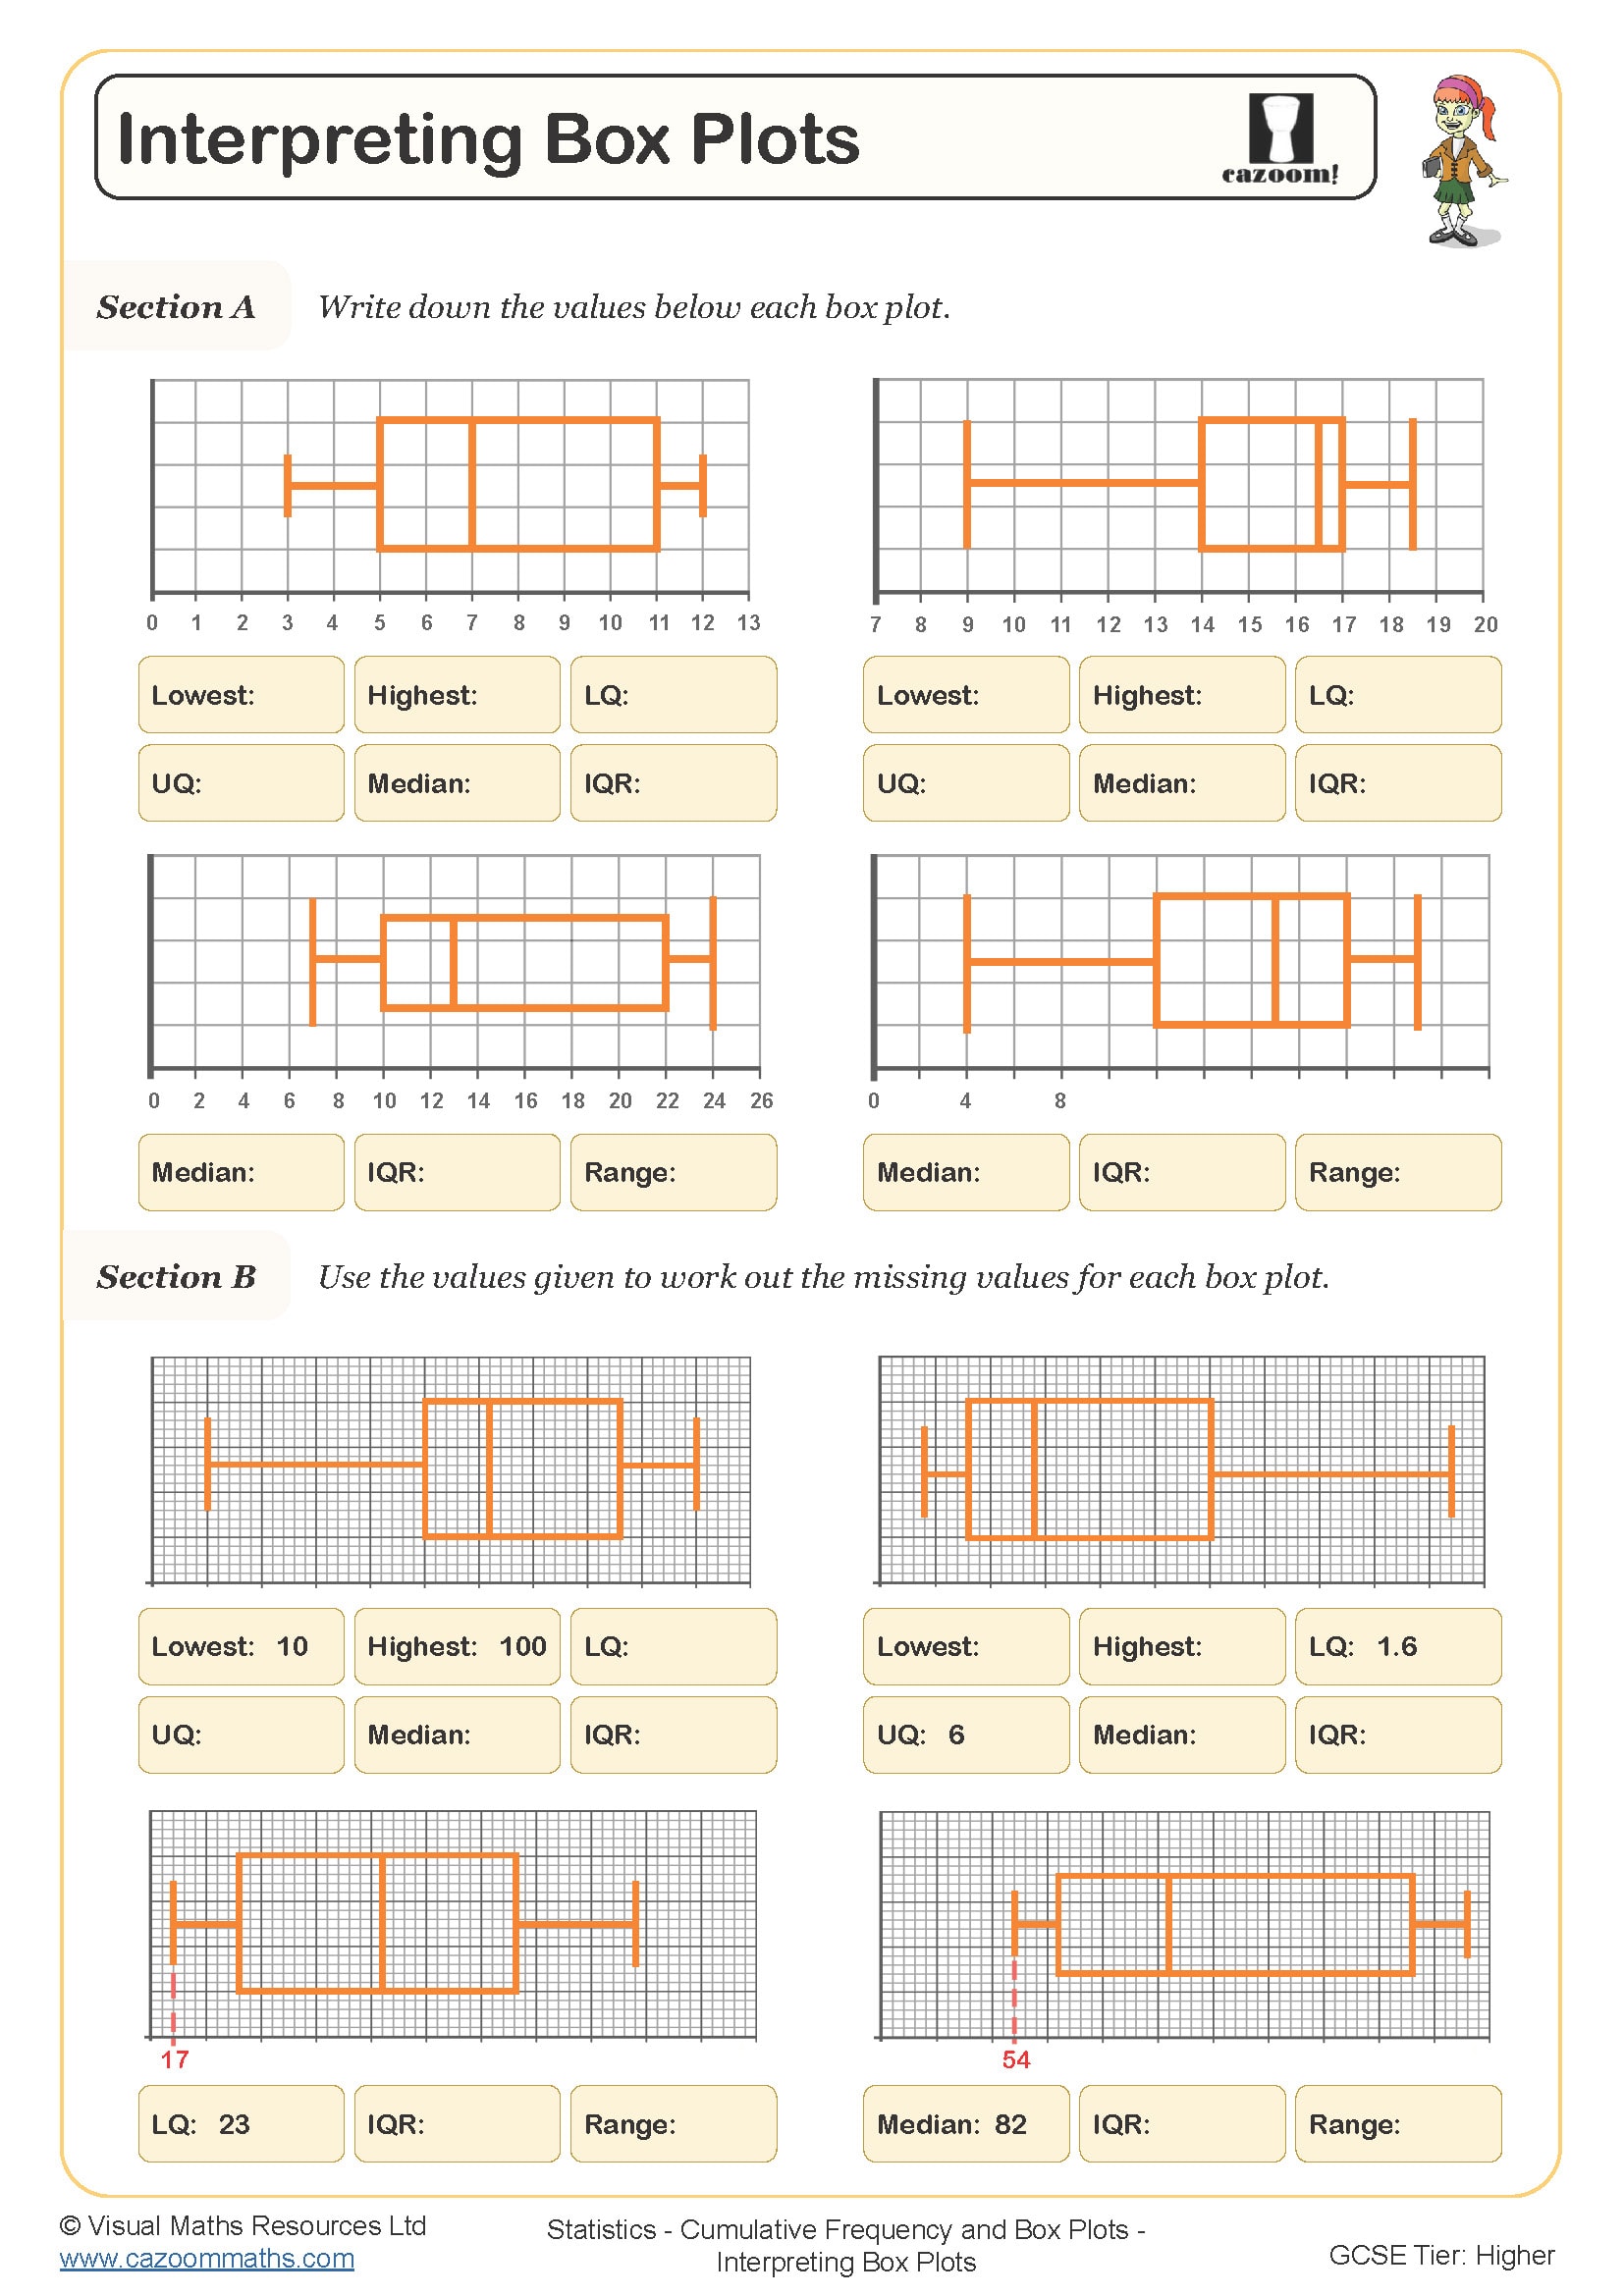
Students often plot cumulative frequency values at the lower class boundary rather than the upper boundary, creating an incorrect curve shape. Another frequent error involves calculating the position of quartiles: many students forget to divide n by 4 and instead just divide the y-axis scale into quarters, which only works by coincidence when the total frequency is a multiple of the axis divisions. Teachers also observe students mixing up the quartile positions when constructing box plots, particularly placing Q1 and Q3 the wrong way round.
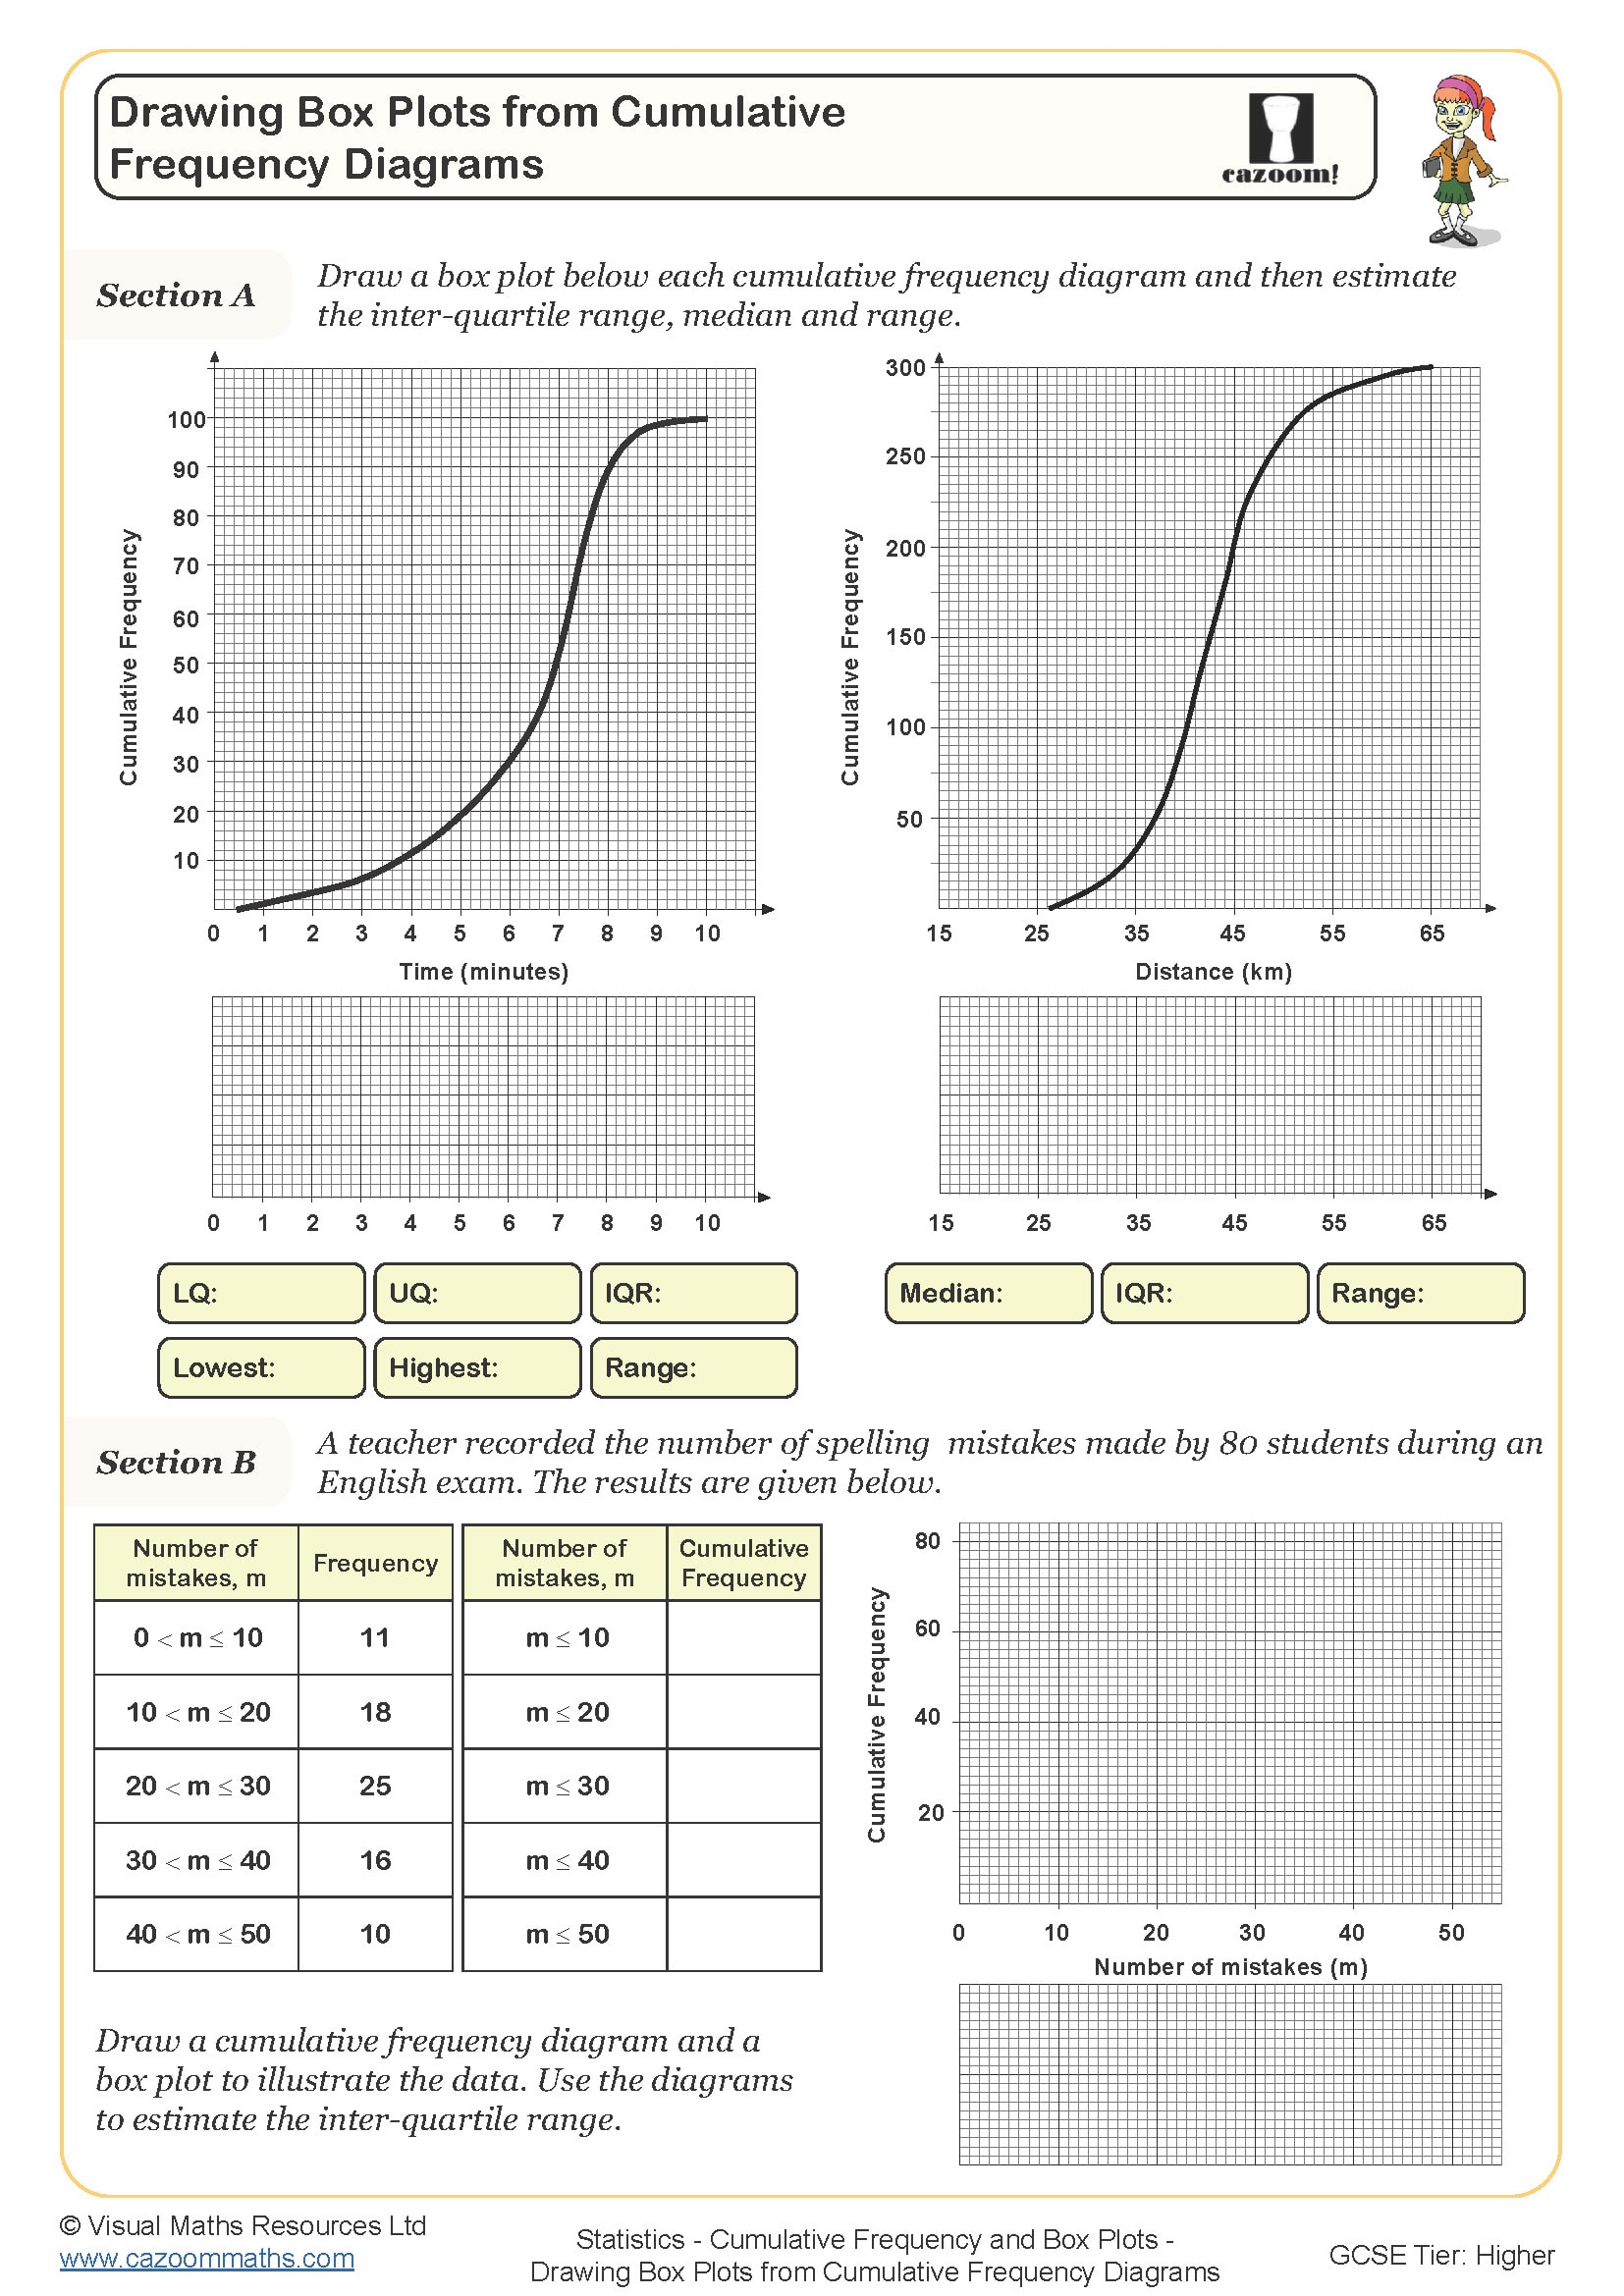
When reading median values from cumulative frequency graphs for grouped data, students regularly lose marks by not drawing a horizontal line from n÷2 on the y-axis to the curve, then dropping vertically to read the x-value. Exam mark schemes specifically require this method to be shown, and students who estimate by eye typically fall outside the acceptable tolerance range, even when their curve is correct.
Which year groups study cumulative frequency and box plots?
Cumulative frequency and box plots appear in the KS4 curriculum, typically introduced in Year 10 and revisited in Year 11 during GCSE revision. This topic sits within the statistics strand of the National Curriculum and builds on earlier work with averages and range from KS3. Students need secure understanding of grouped frequency tables and finding the median from lists before tackling cumulative frequency, as these form the foundation skills.
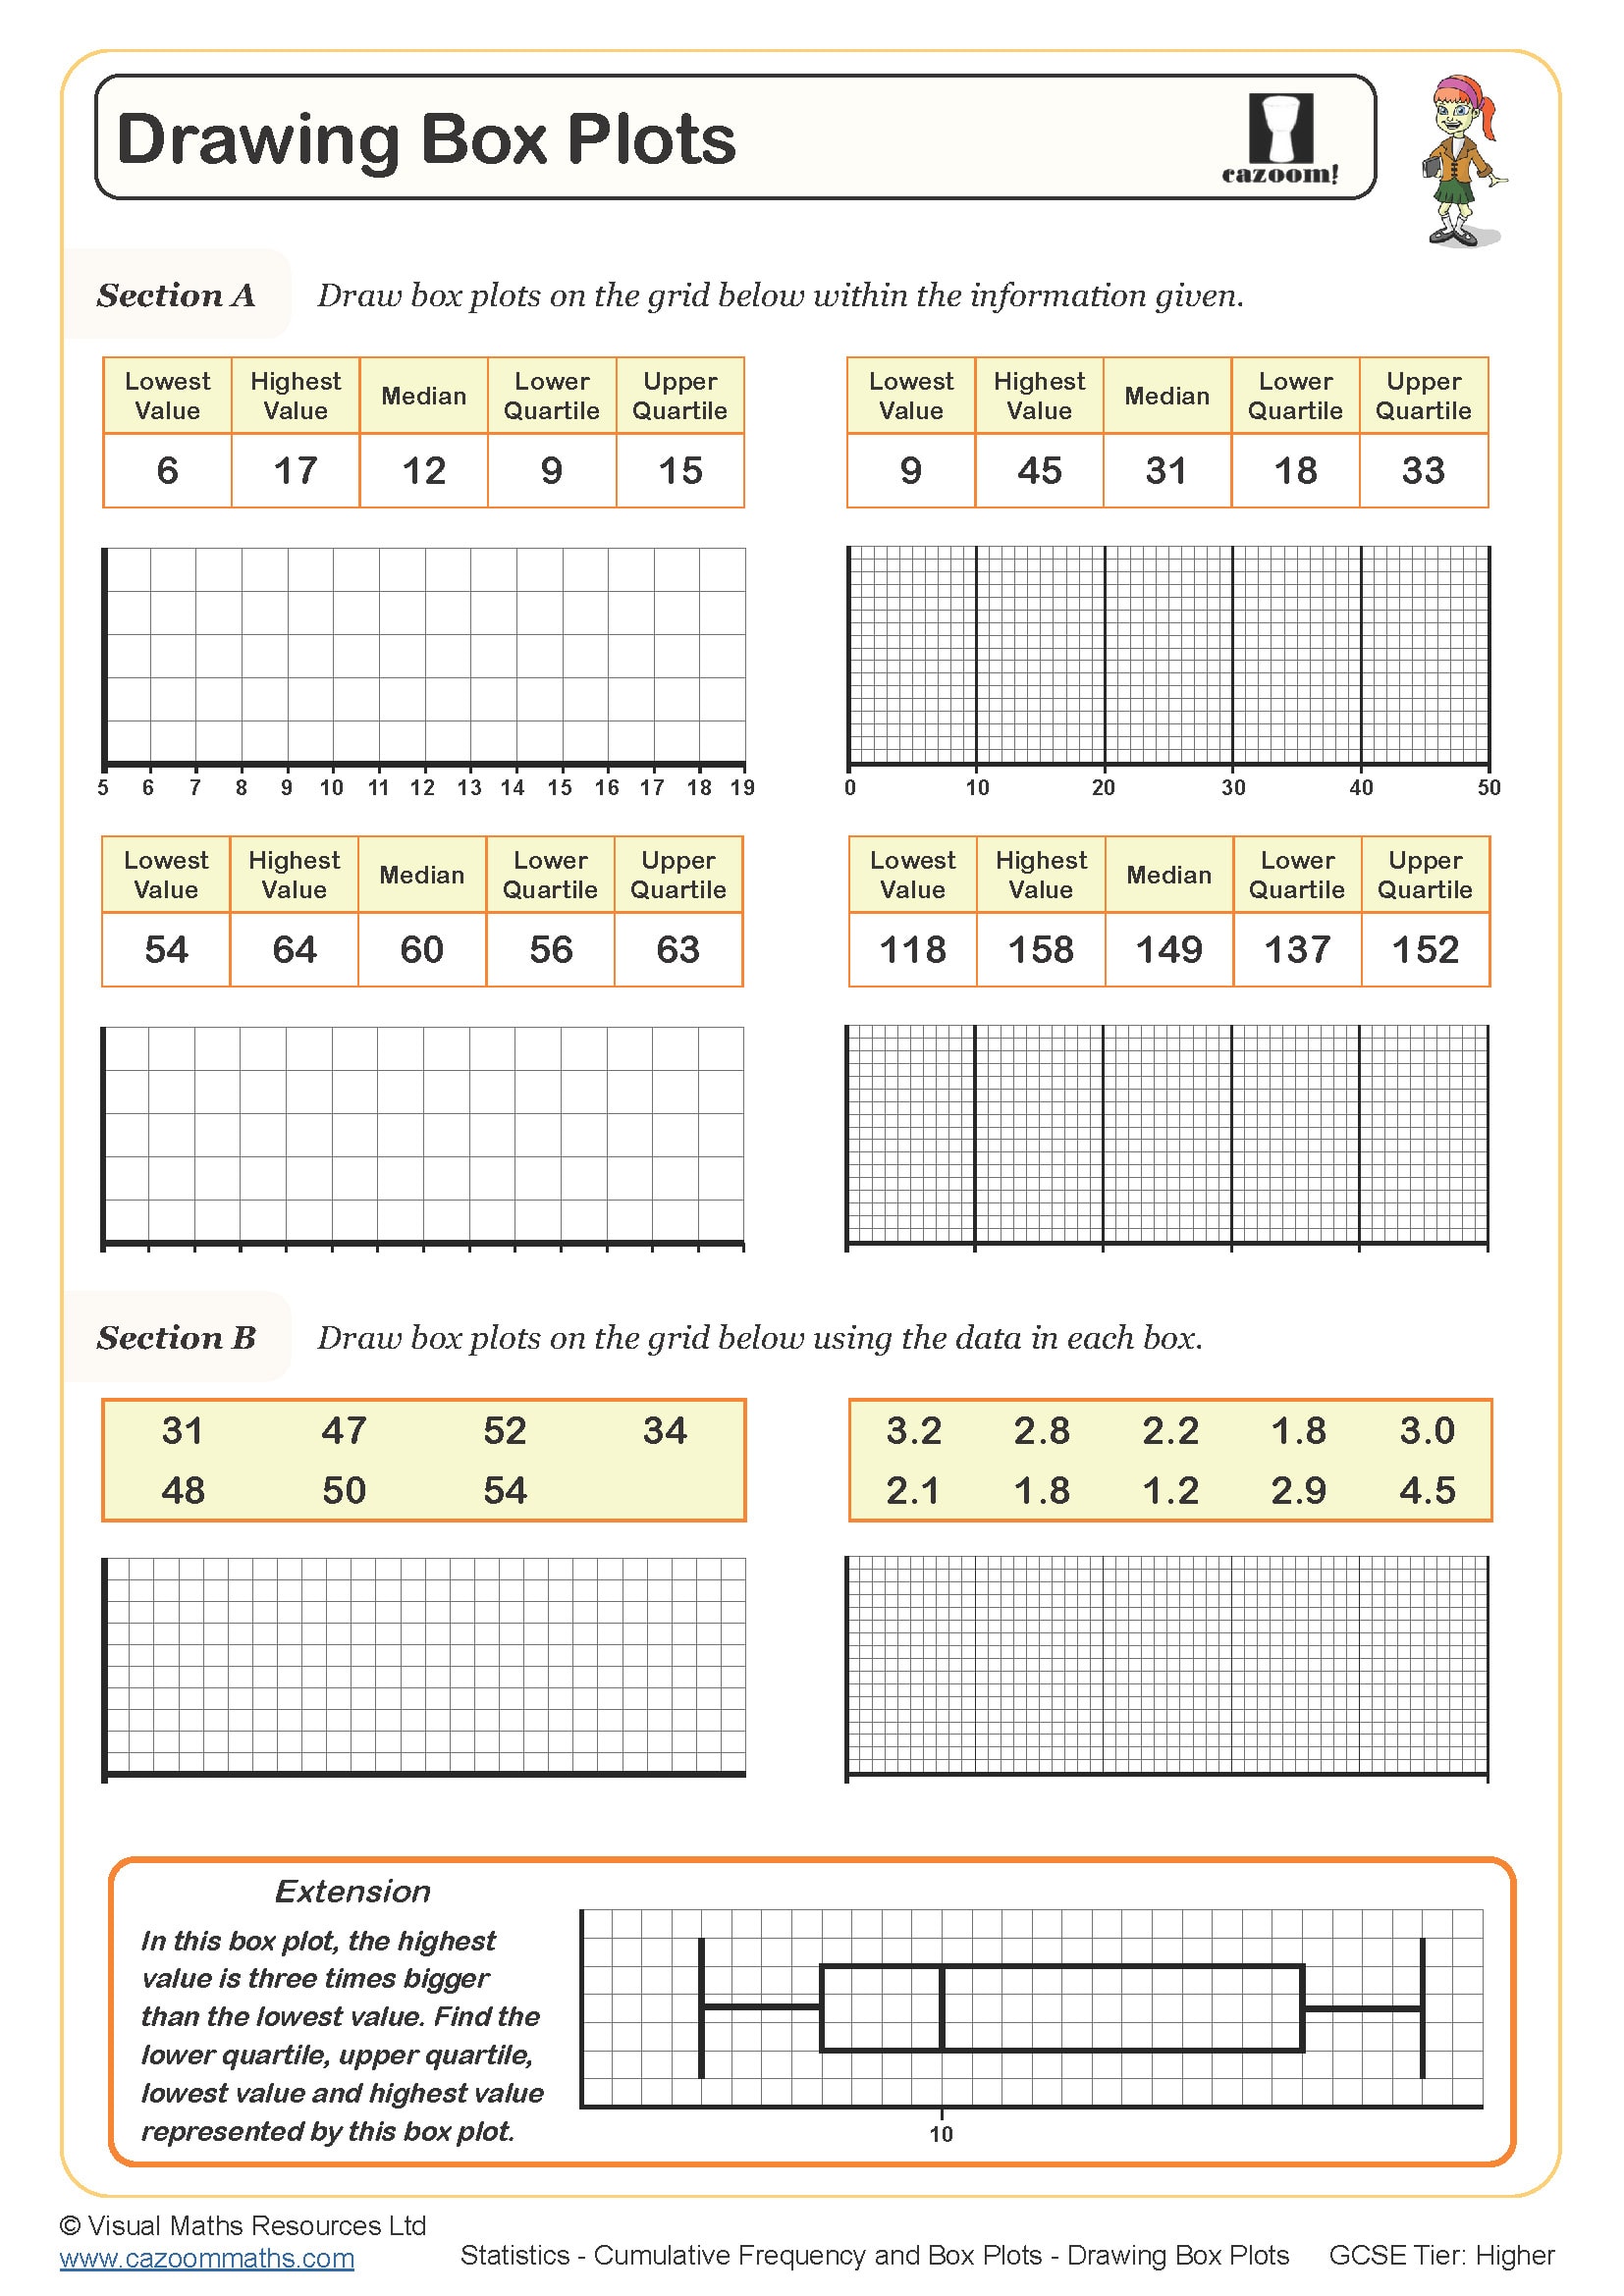
The progression across Year 10 and Year 11 involves increasing complexity in the data sets and question types. Initial worksheets focus on constructing cumulative frequency tables and curves from grouped data with straightforward class intervals. Year 11 materials typically combine multiple skills: comparing distributions using box plots, calculating interquartile range, identifying outliers, and interpreting what statistical measures reveal about real data sets. Higher tier students also encounter questions requiring reverse processes, such as finding missing frequencies when given quartile information.
Why is the interquartile range useful in statistics?
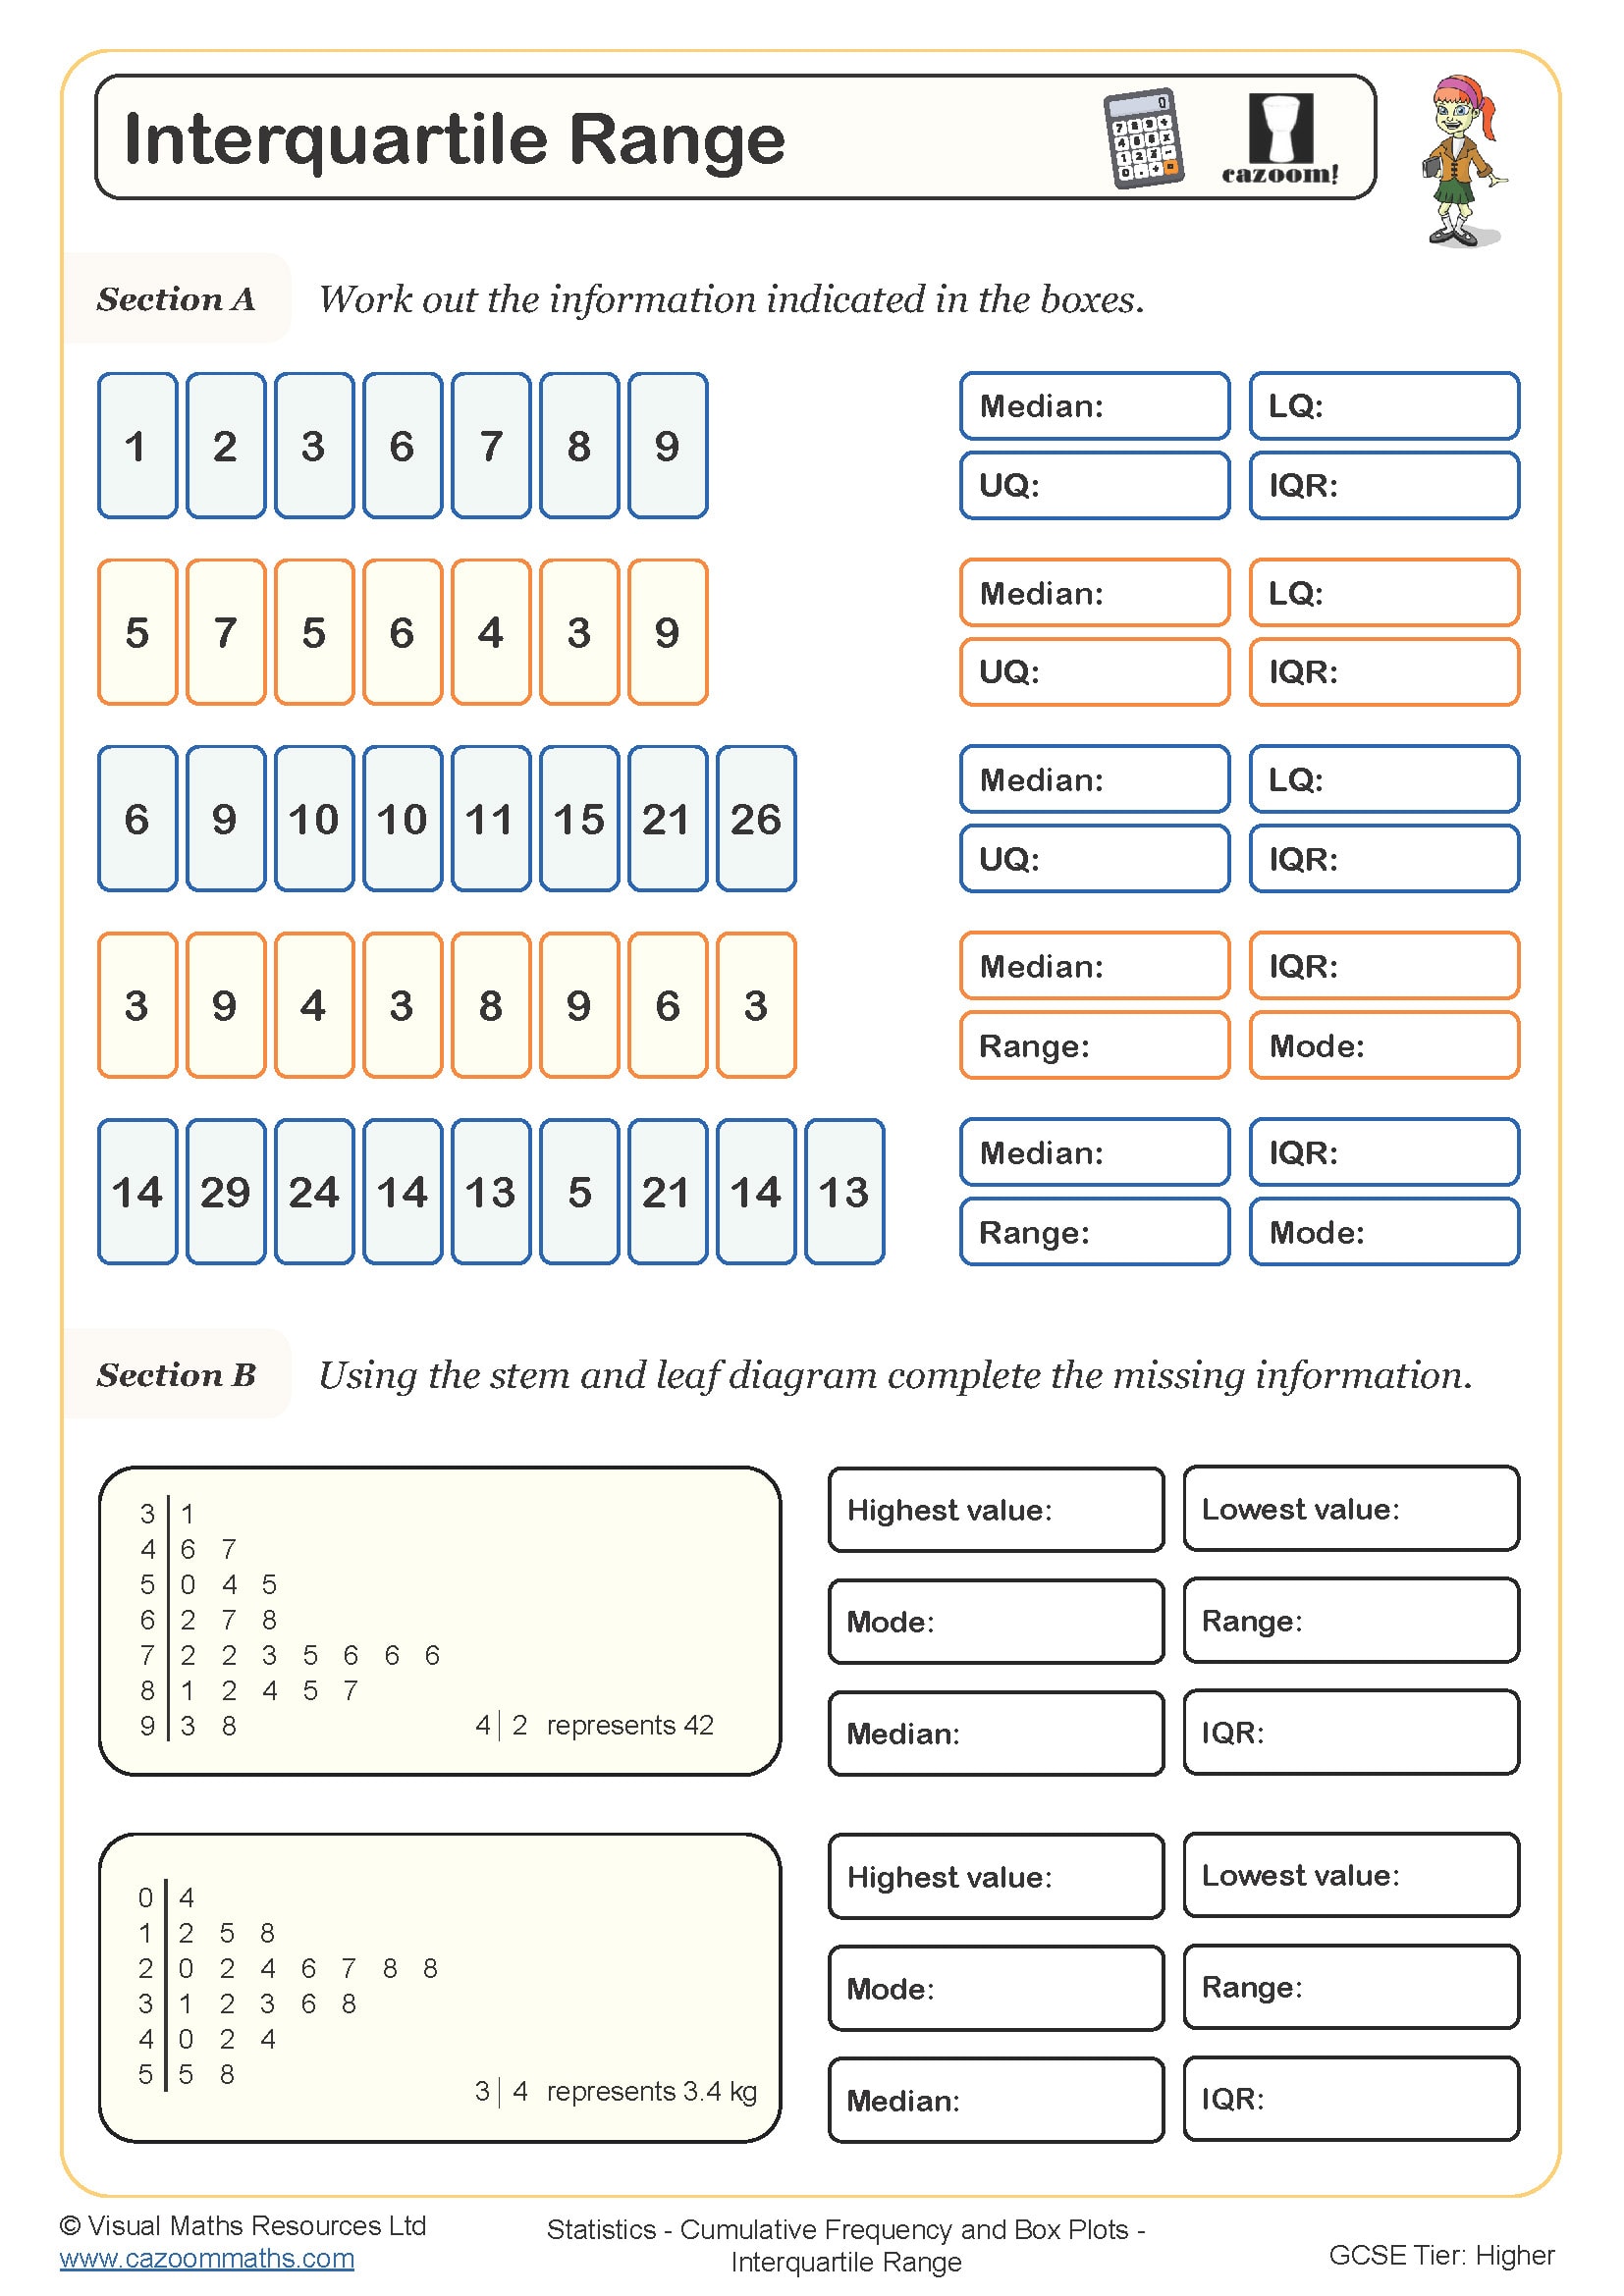
The interquartile range (IQR) measures the spread of the middle 50% of data, calculated as Q3 minus Q1. Unlike the range, the IQR isn't affected by extreme values or outliers, making it a more reliable measure of variability when data sets contain unusually high or low values. Students learn to read Q1 and Q3 from cumulative frequency curves by finding the positions at n÷4 and 3n÷4 respectively, then subtracting to find the IQR.
Weather forecasters use IQR when analysing temperature or rainfall data because it shows typical variation without distortion from occasional extreme weather events. In medical research, the IQR helps describe patient response times or dosage effectiveness by focusing on the central majority of results rather than rare extreme reactions. Manufacturing quality control relies on IQR to detect when product measurements show excessive variation, even when the occasional outlier is acceptable. This makes cumulative frequency techniques directly relevant to STEM careers requiring data interpretation skills.
How do these worksheets help students master cumulative frequency techniques?
The worksheets provide structured scaffolding that breaks down complex multi-step processes into manageable stages. Early questions focus on single skills like completing cumulative frequency tables or plotting points correctly, before progressing to questions requiring the full process from raw grouped data through to box plot construction. Answer sheets show the working-out for each stage, helping students identify exactly where their method differs if answers don't match.
Many teachers use these resources for targeted intervention with students who struggle during whole-class teaching, as the step-by-step approach allows students to work at their own pace. The worksheets work effectively as homework following initial teaching, giving students necessary repetition with this procedural topic. Some teachers set cumulative frequency worksheets as paired activities where students check each other's curves before proceeding to read quartiles, as this catches plotting errors before they cascade through subsequent calculations. The variety of contexts across questions also provides useful revision material in Year 11 when students need to recall methods learned months earlier.