Averages and Range from Lists Worksheets
All worksheets are created by the team of experienced teachers at Cazoom Maths.
What are the four averages in maths?
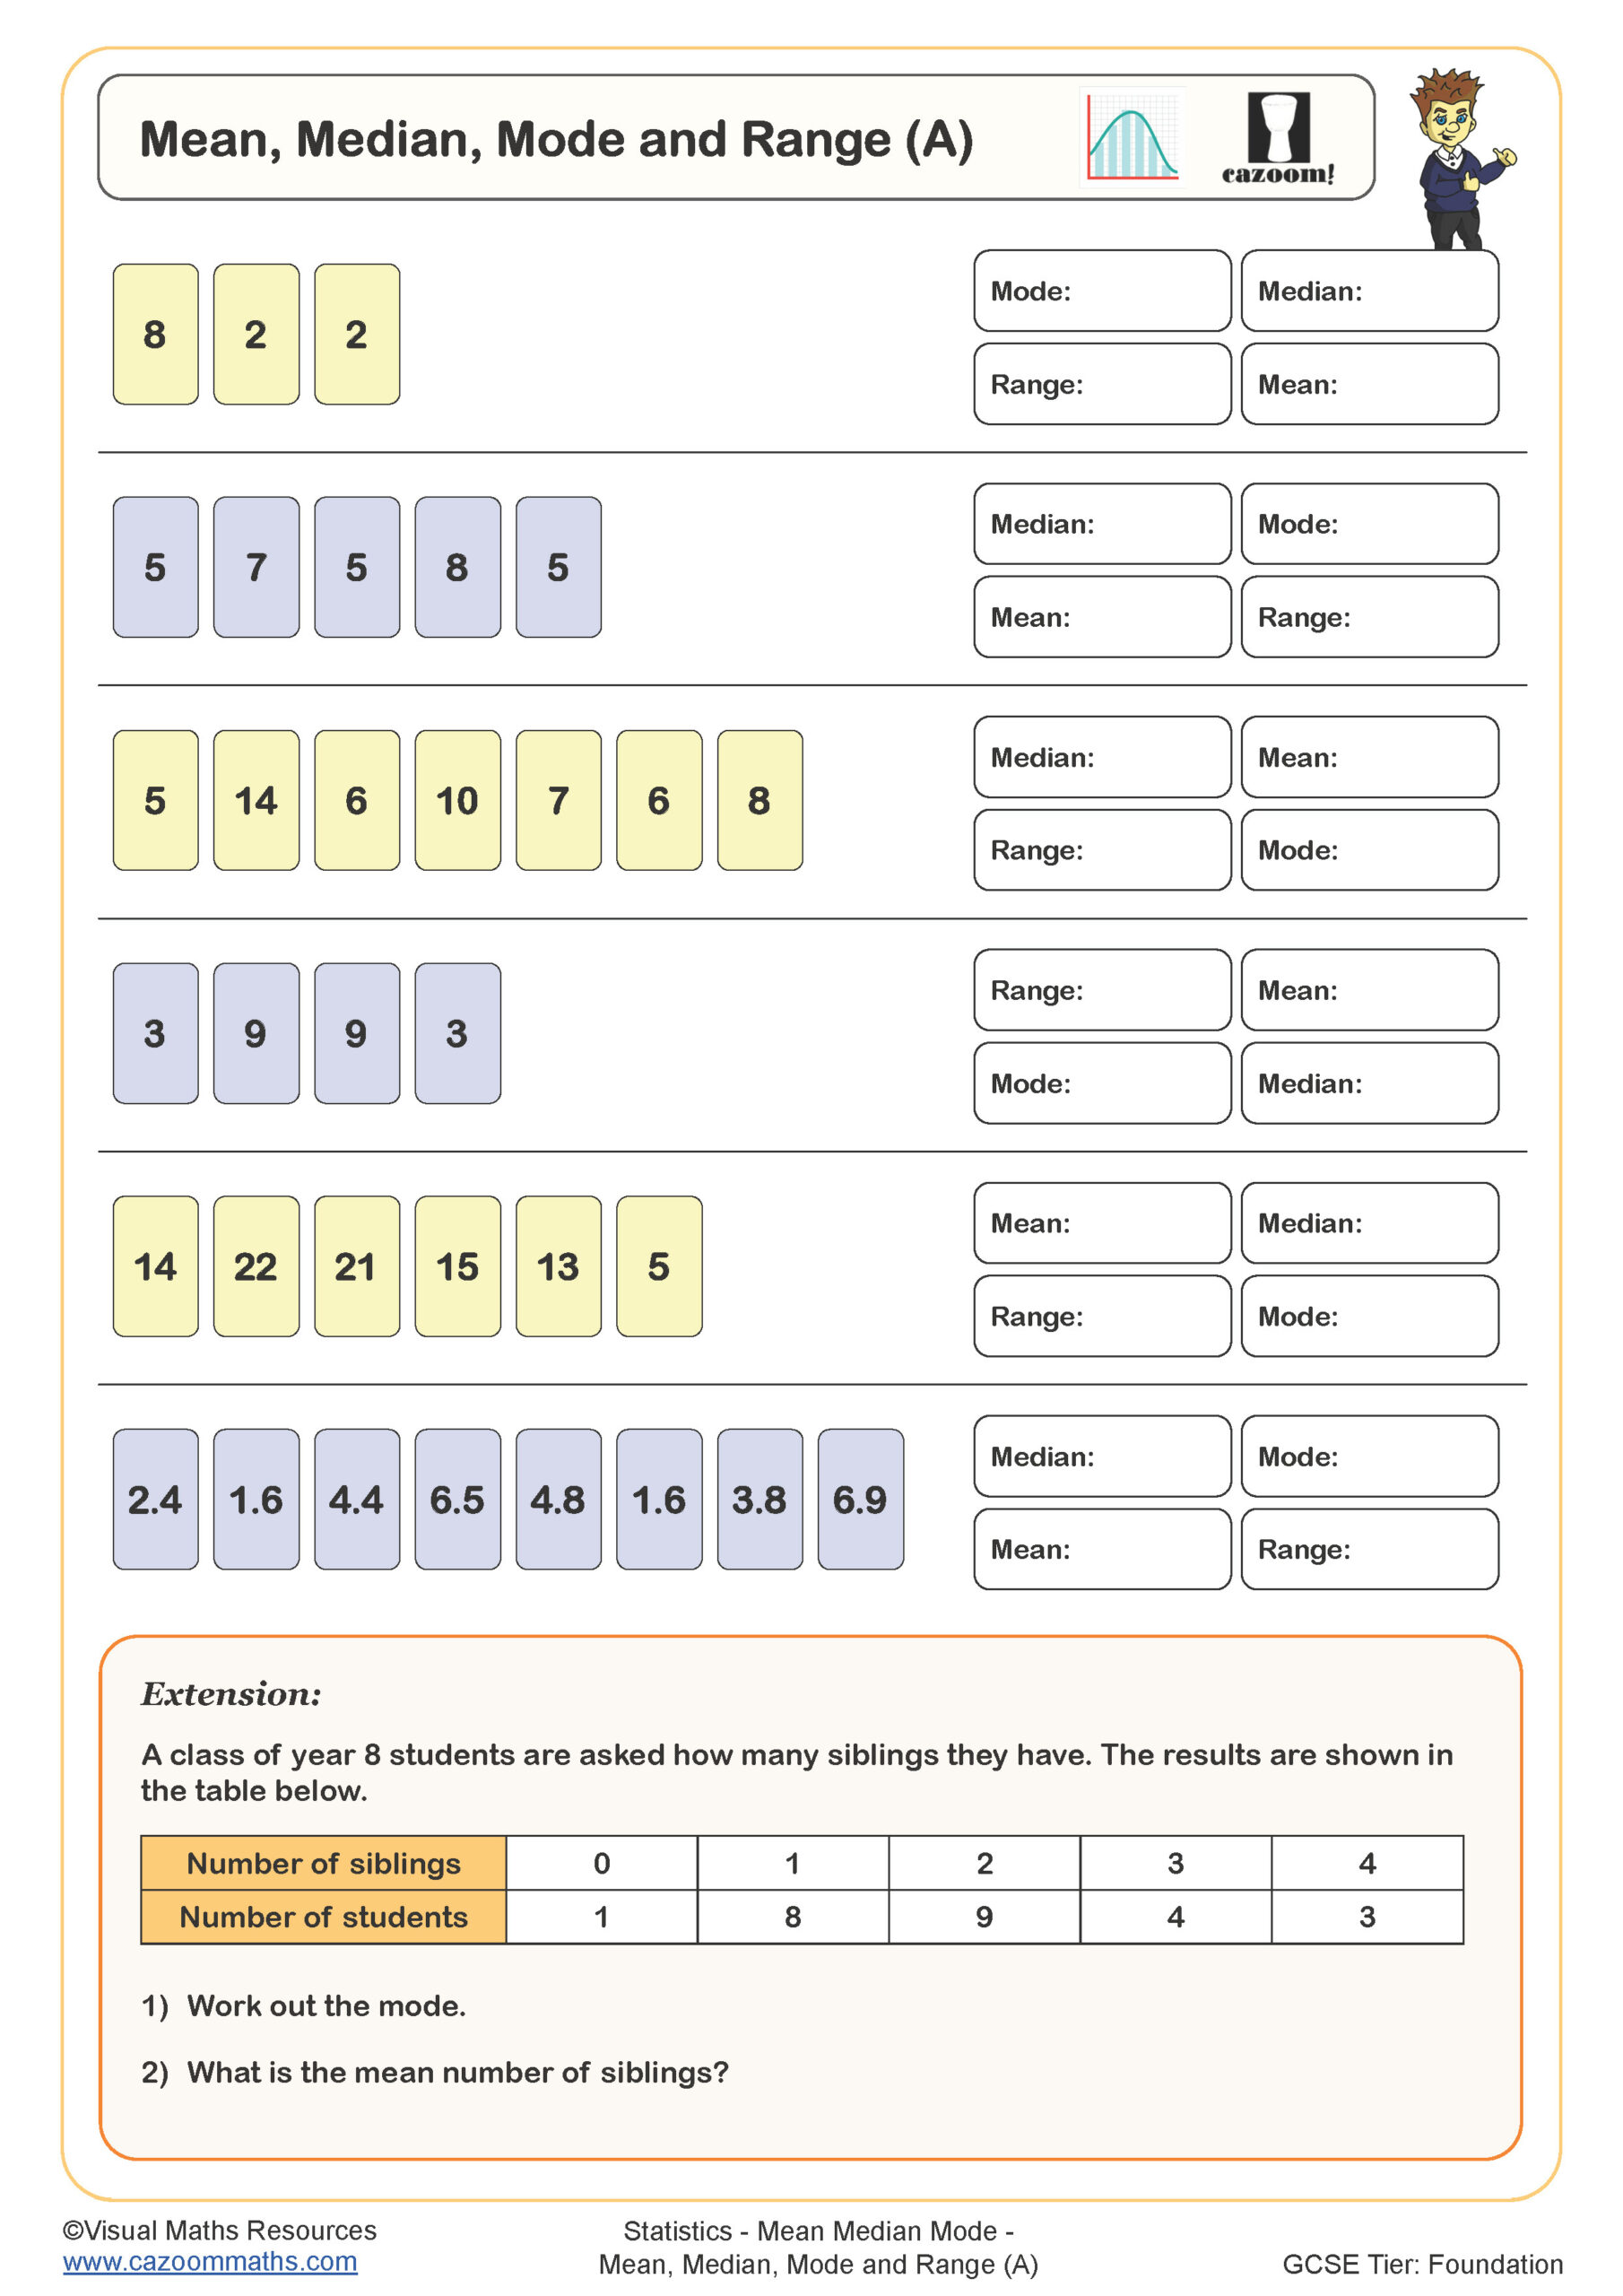
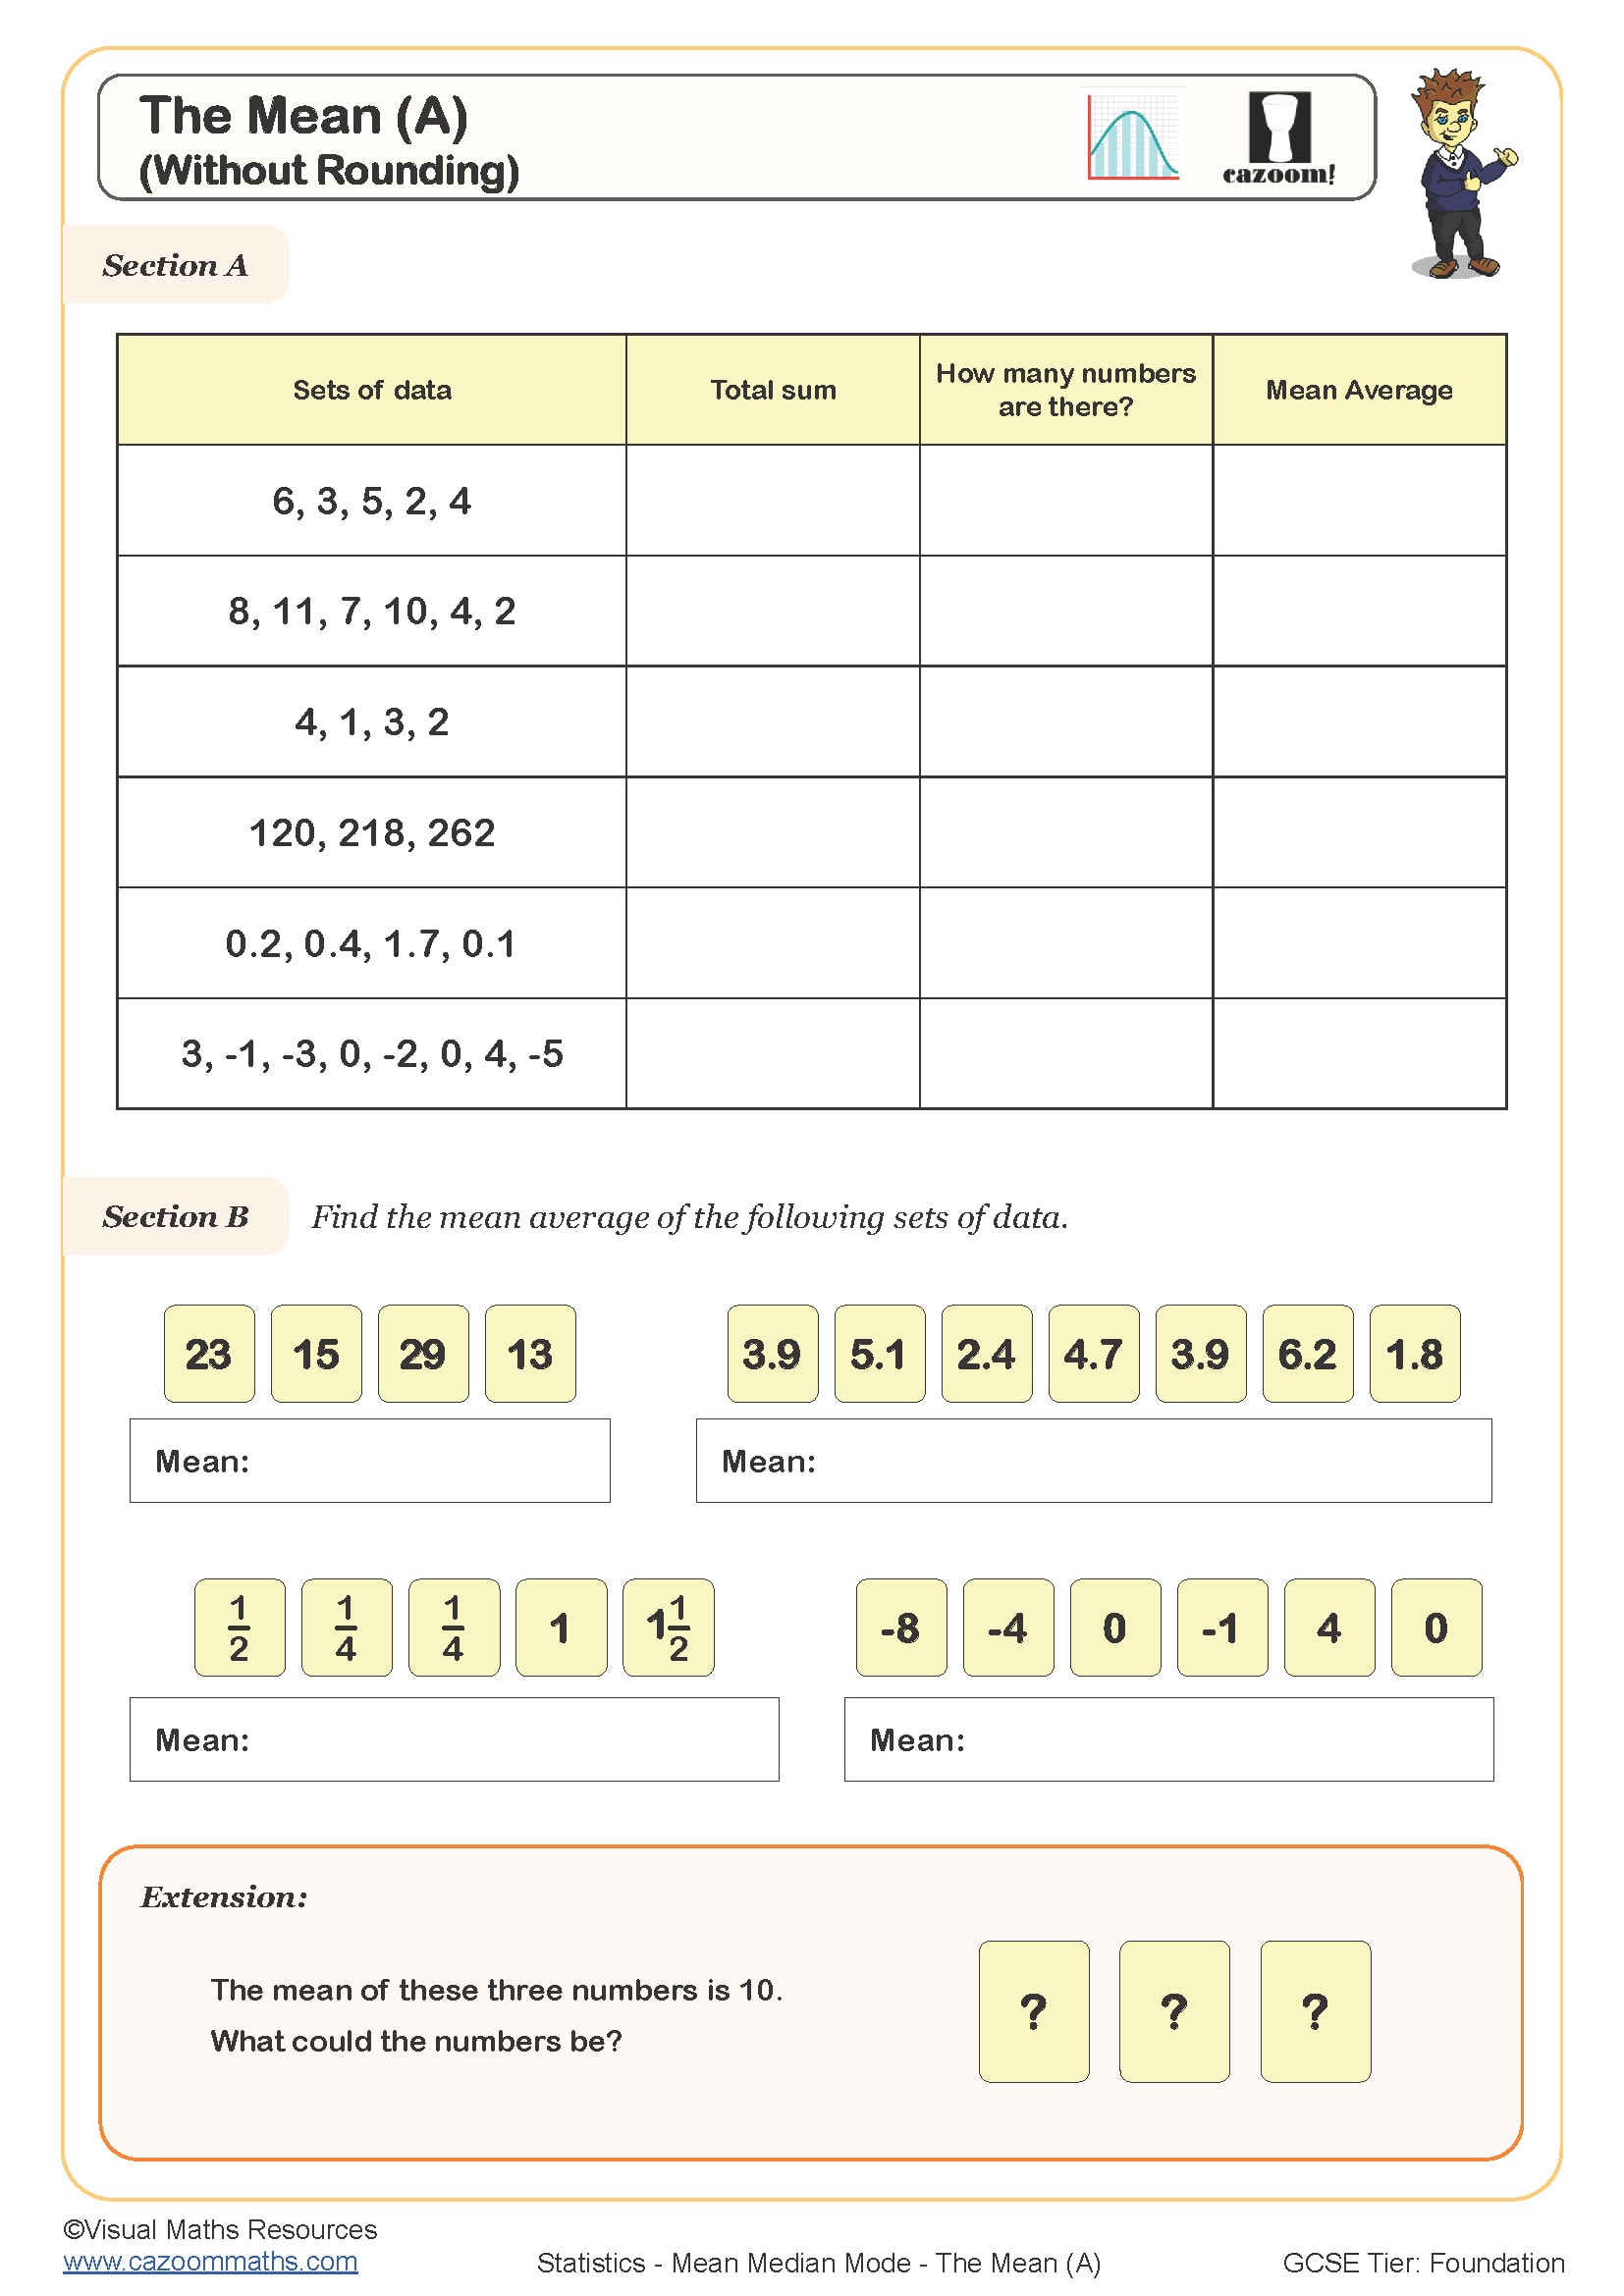
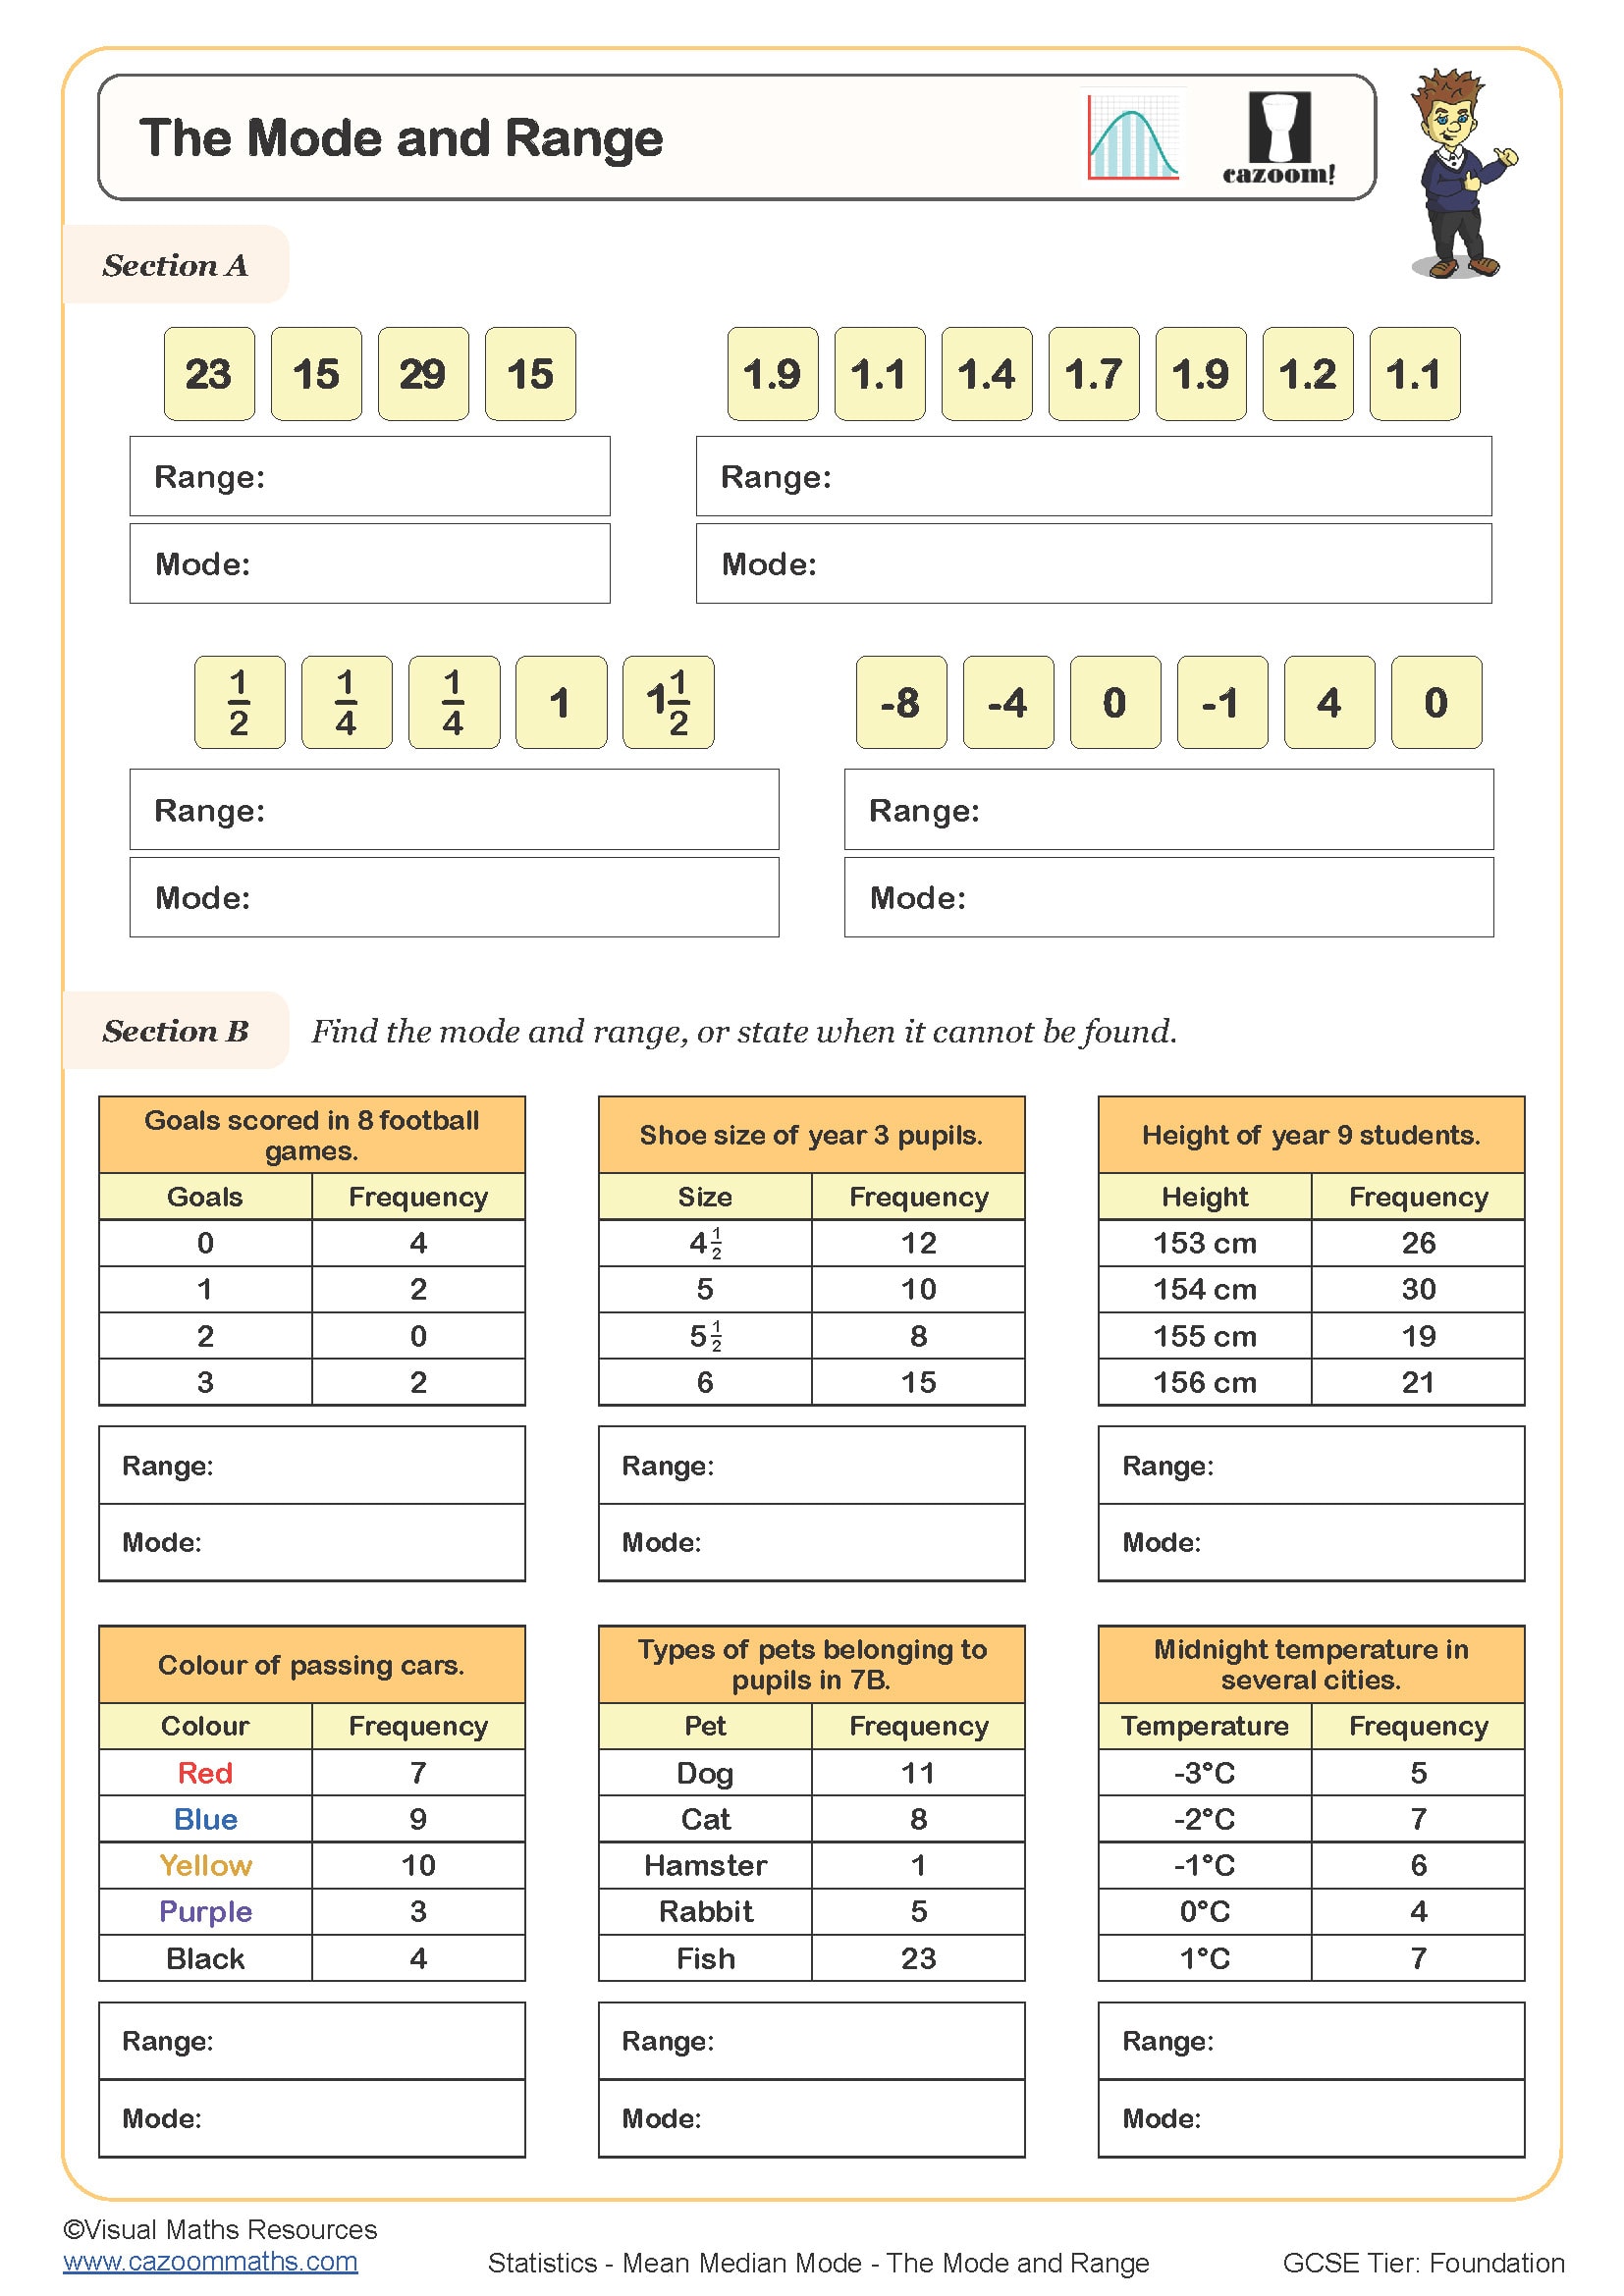
In the UK curriculum, students learn three types of average (mean, median and mode) alongside range, which measures spread rather than central tendency. The mean is the sum of all values divided by how many values there are. The median is the middle value when data is arranged in order. The mode is the most frequently occurring value. Range is the difference between the highest and lowest values.
Students often lose marks by calculating mean incorrectly when they miscount the number of values in a list, particularly when the list wraps across lines on a page. Teachers notice this happens most with lists containing 8 to 12 values. Another common error occurs when finding the mode from grouped data later in KS3, where students try to apply the same method used for individual values.
Which year groups learn averages and range from lists?
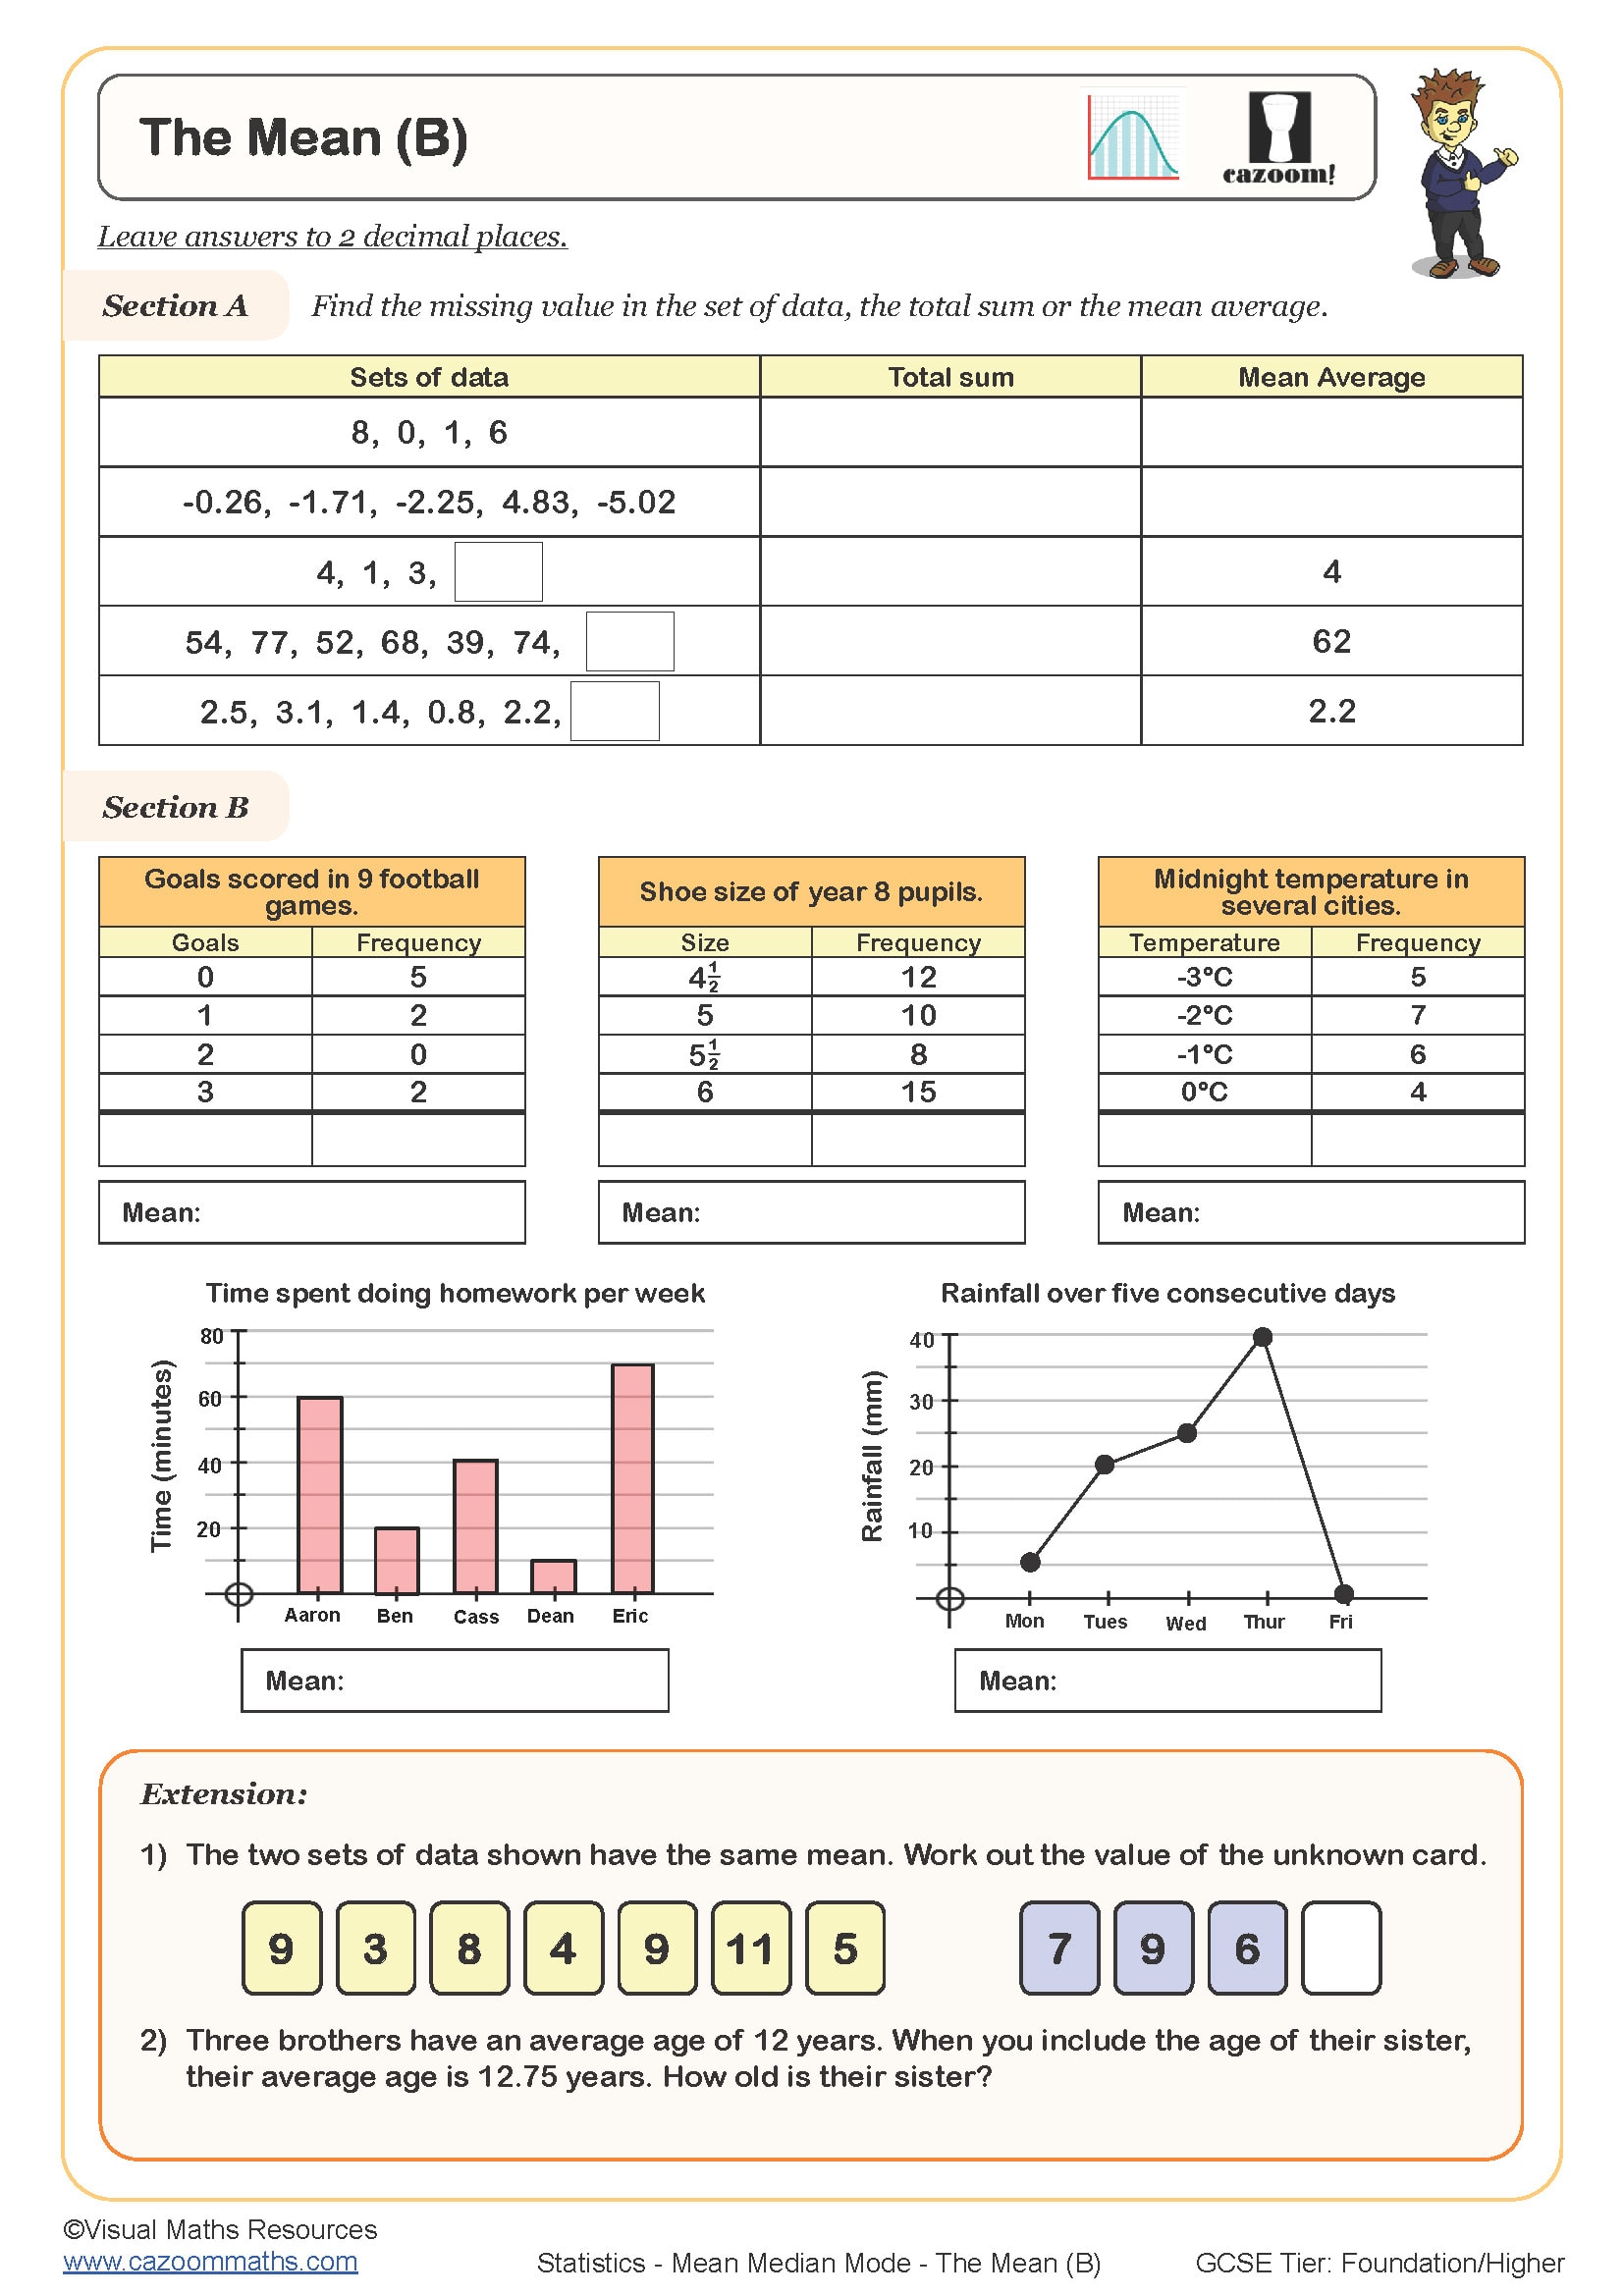
These worksheets cover averages and range for Year 7 and Year 8 students at KS3 level. The National Curriculum introduces these statistical measures in Year 6, but KS3 develops much greater depth and expects students to work with larger data sets, decimal values and negative numbers. Students must also begin to choose which average is most appropriate for different contexts.
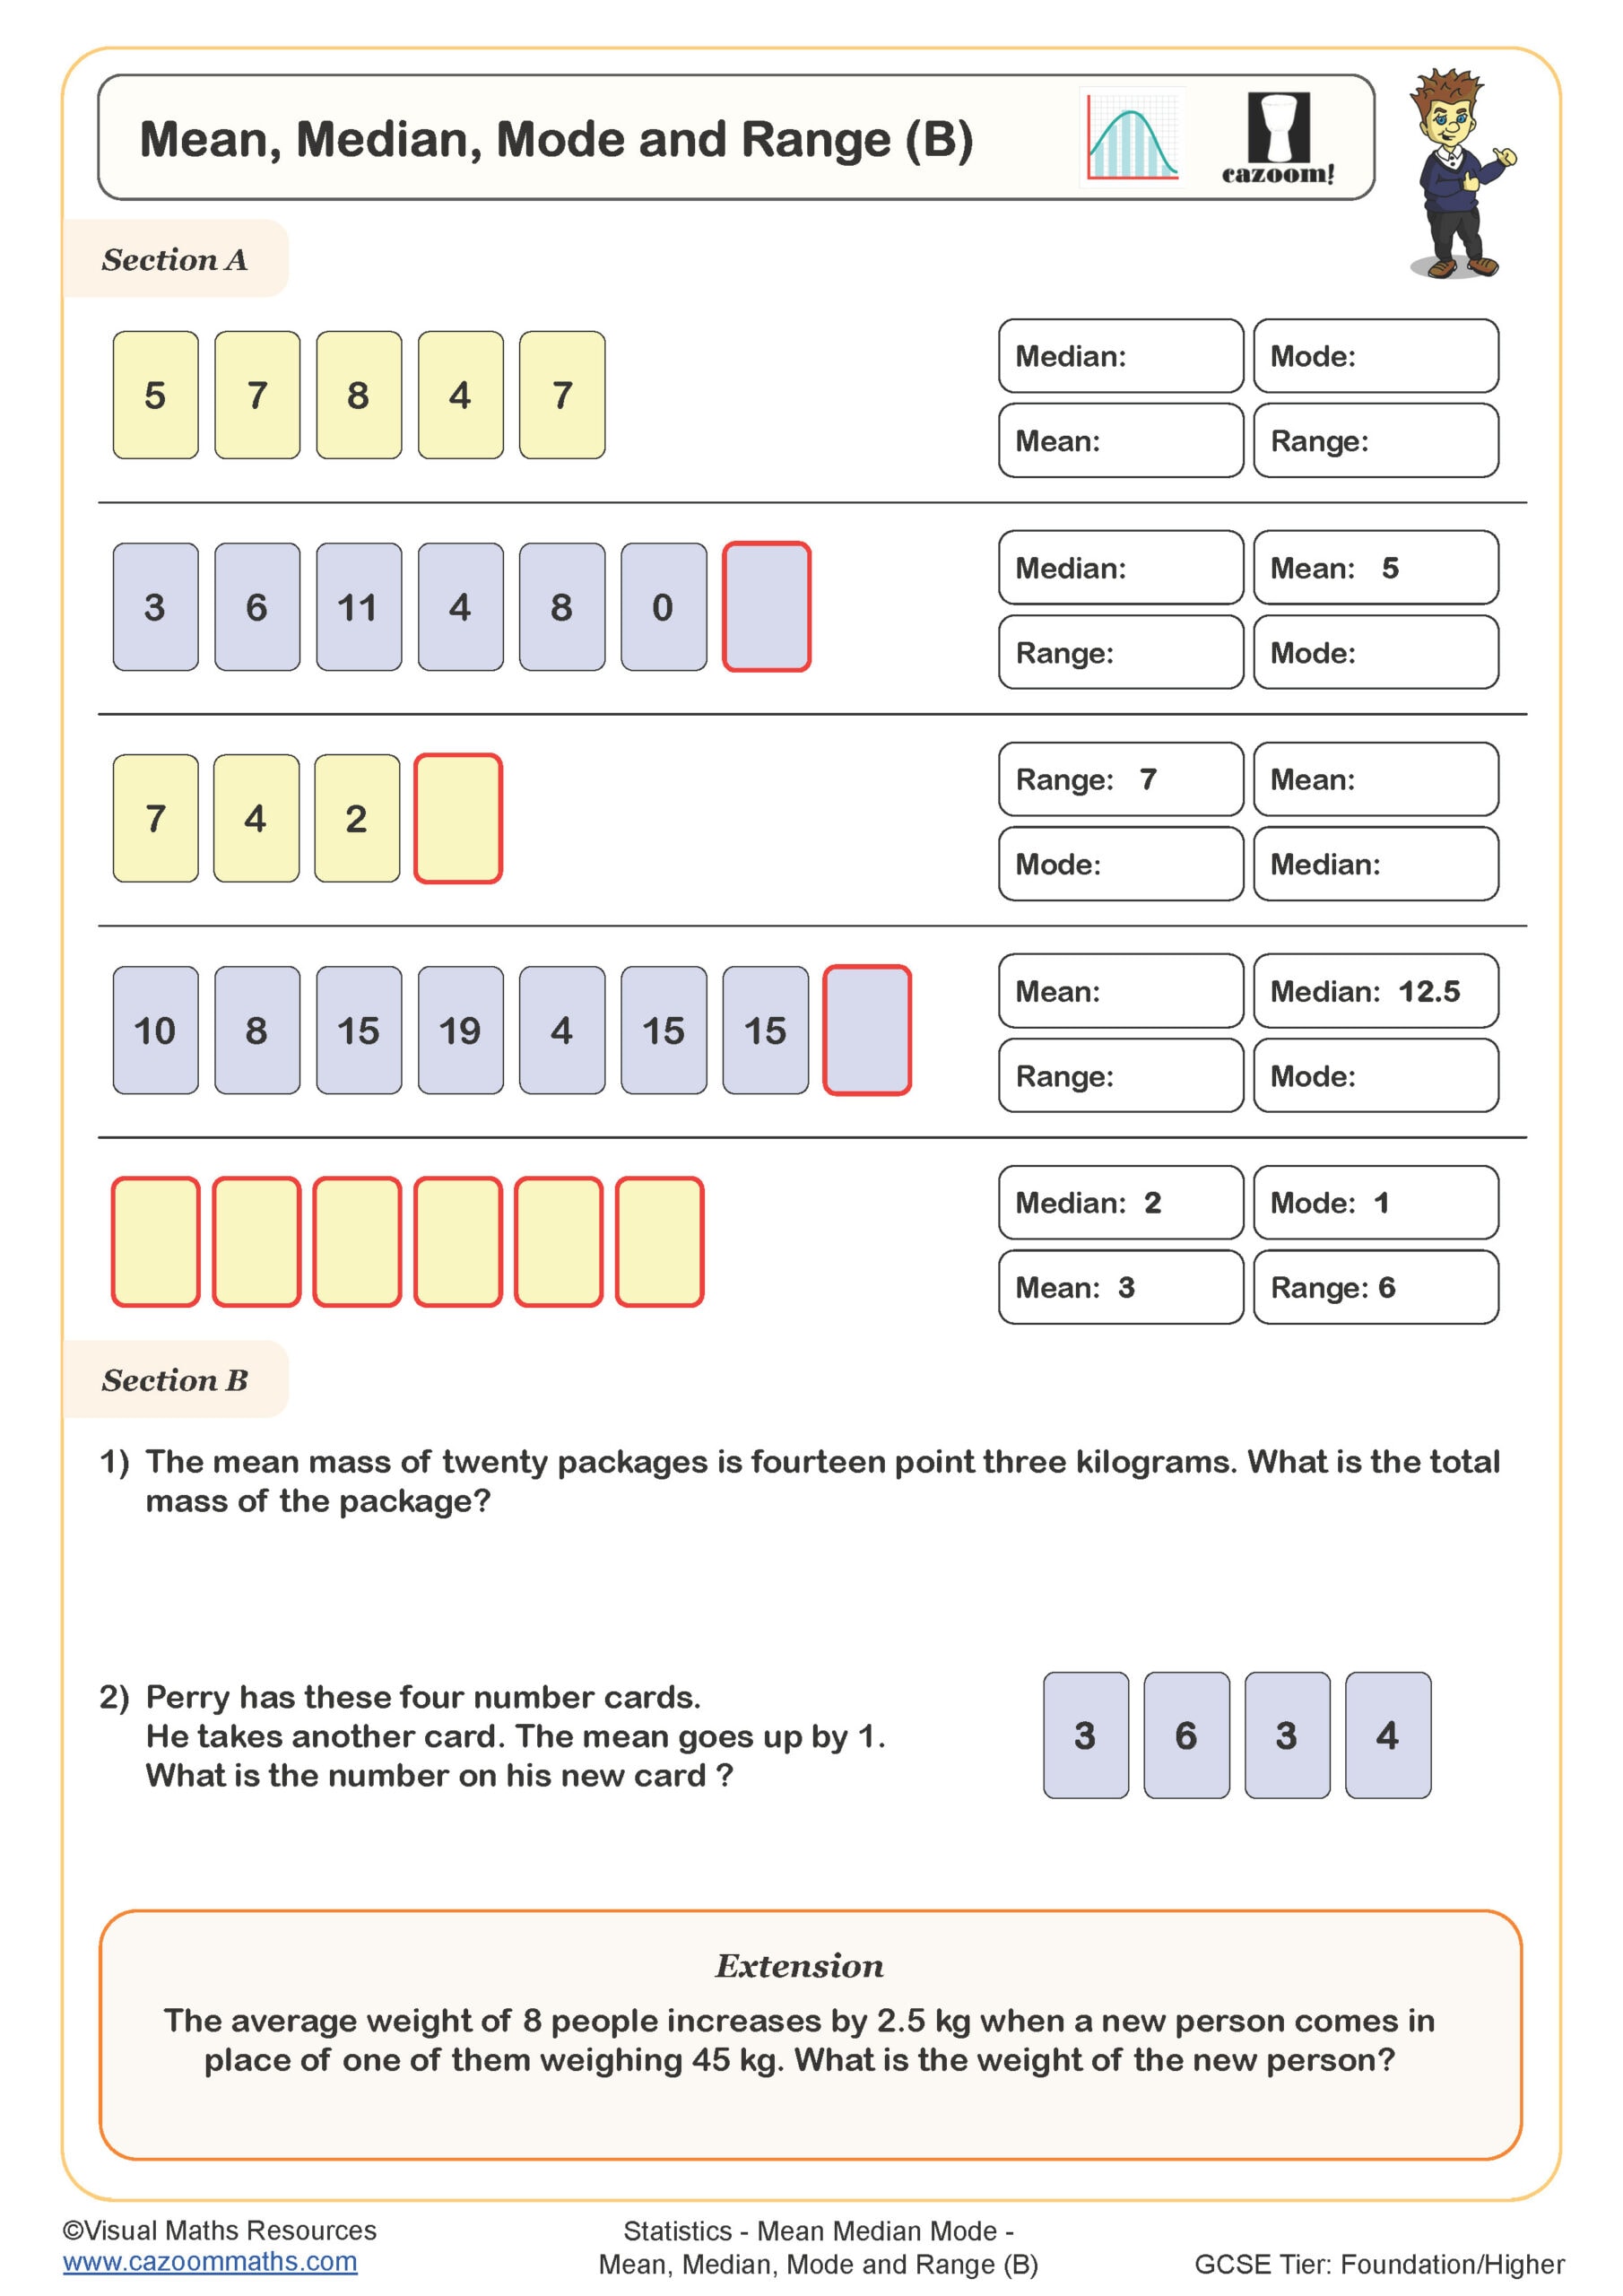
The progression from Year 7 to Year 8 typically involves more complex data sets with awkward numbers, questions requiring interpretation rather than just calculation, and problems where students must work backwards from a given average to find missing values. Year 8 worksheets also introduce situations where the mode doesn't exist or where multiple modes appear.
Why is the median useful in real-world data?
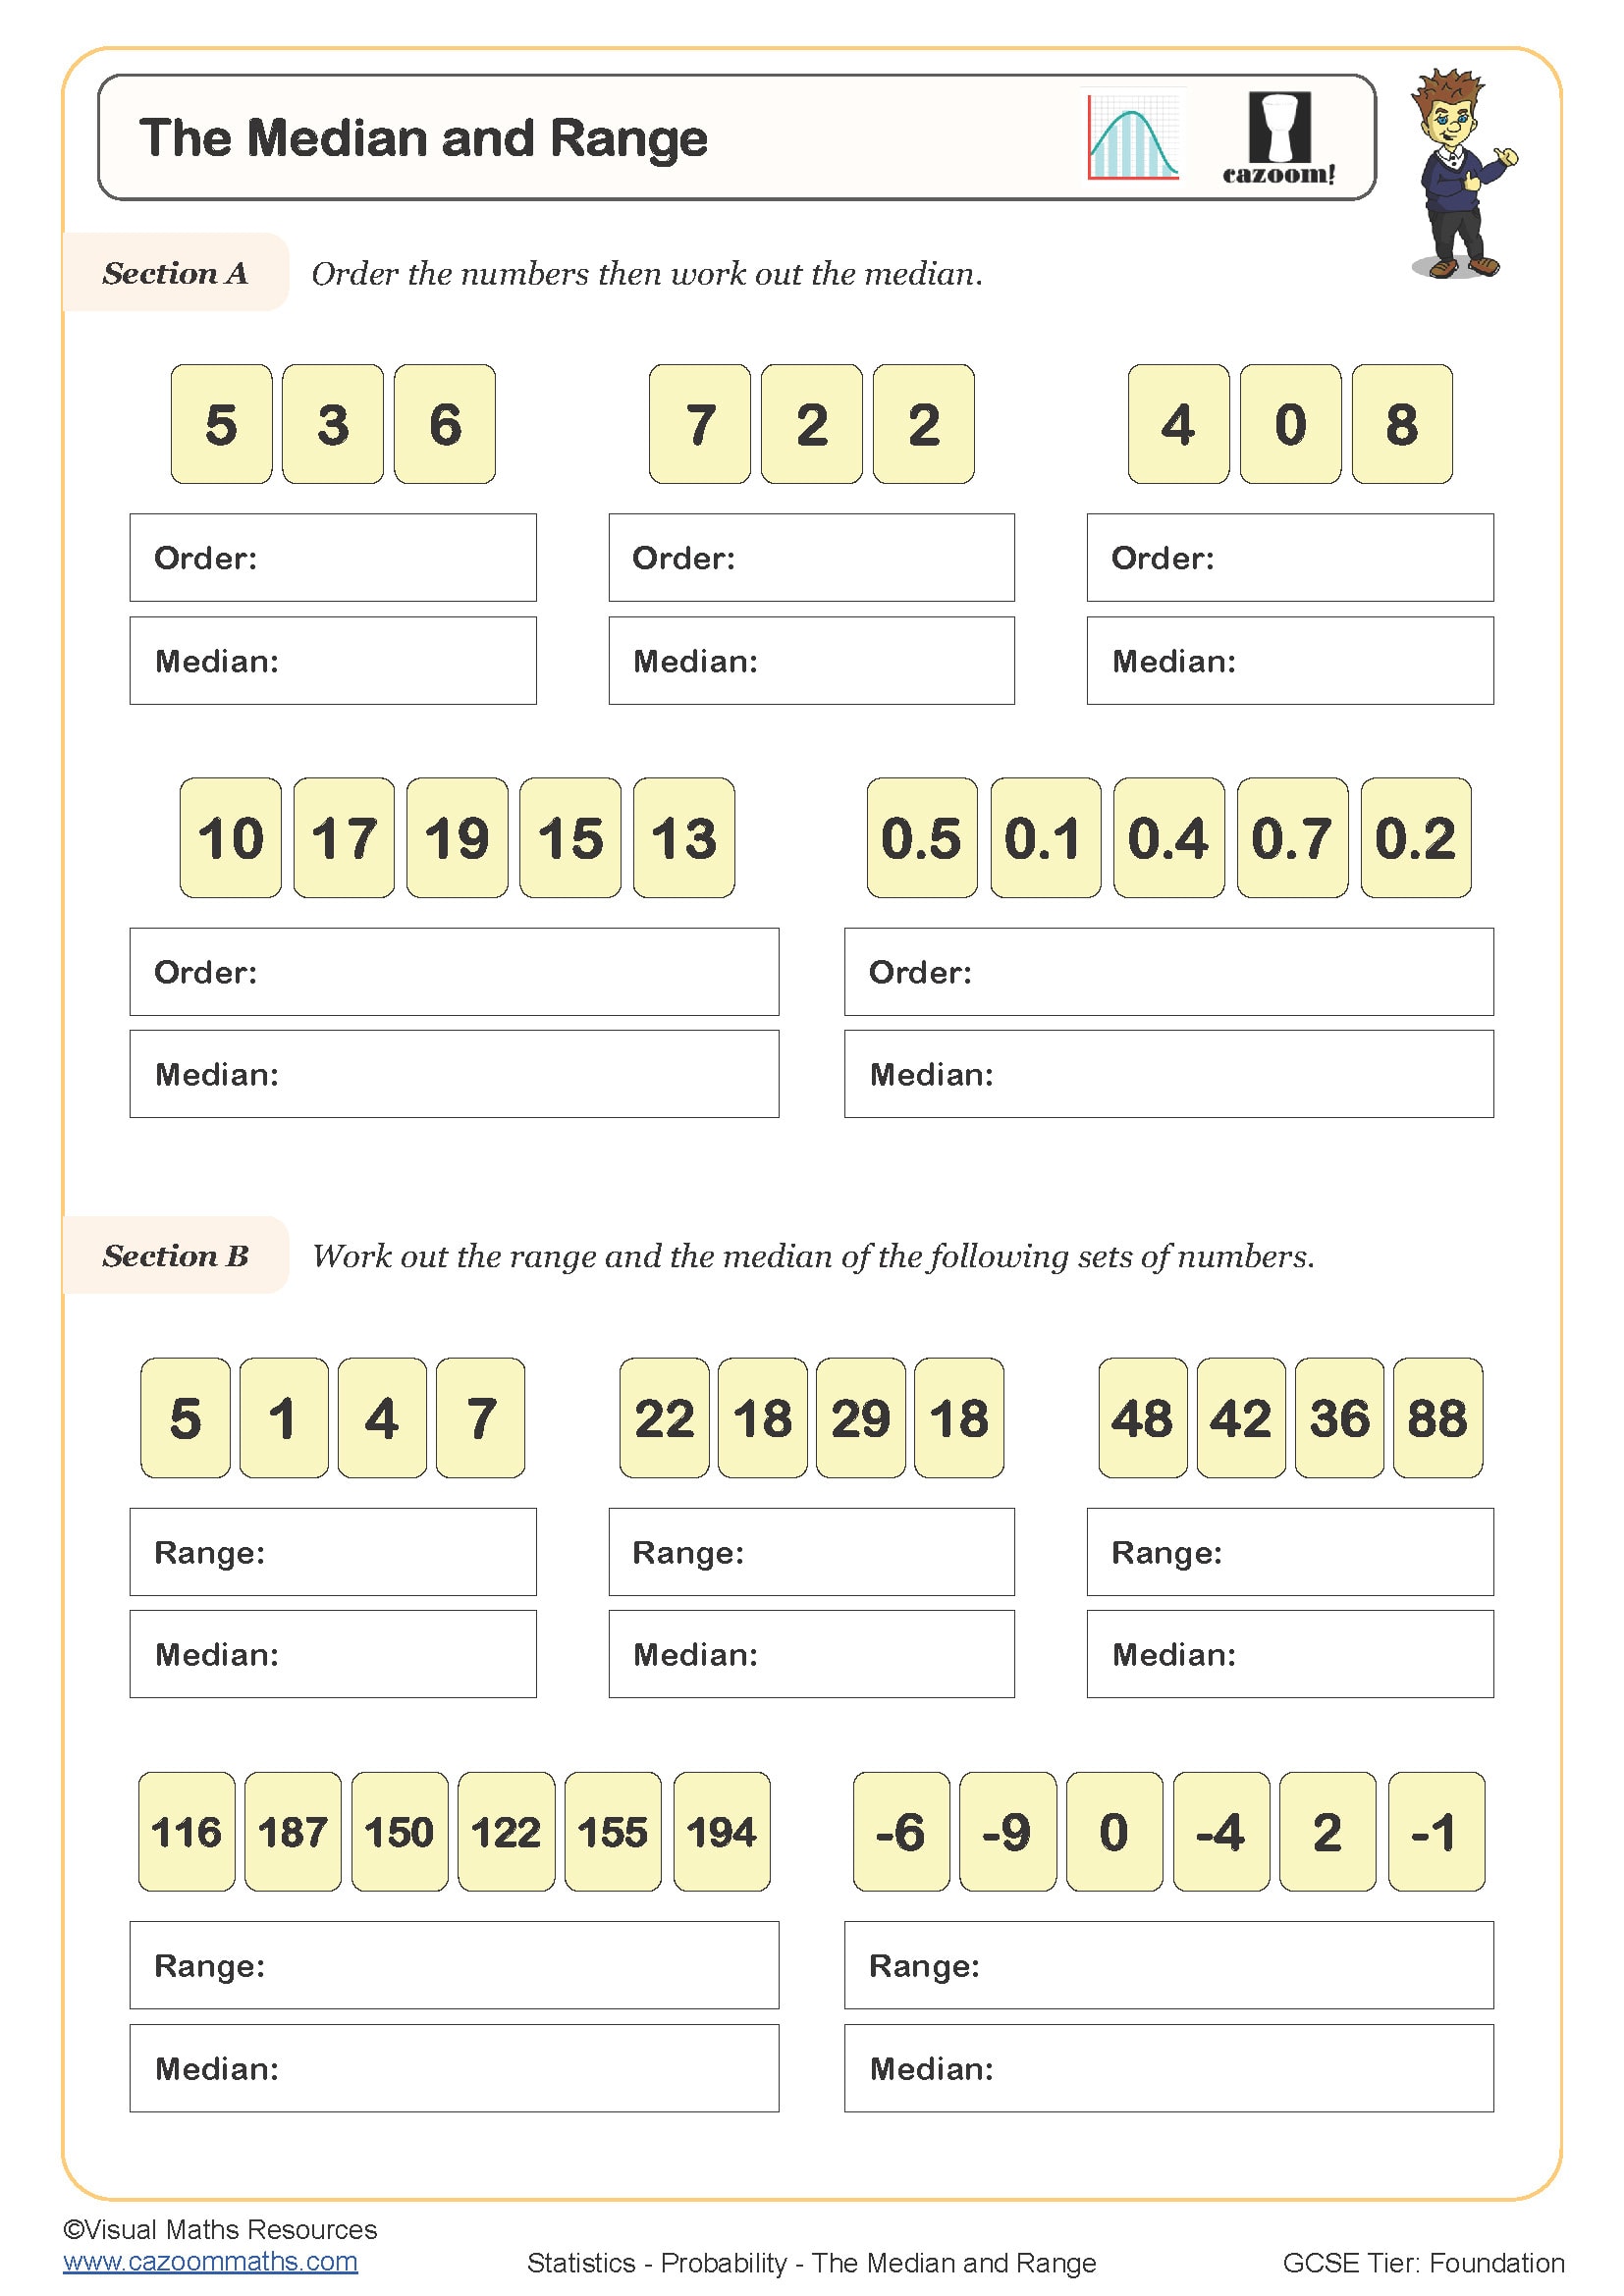
The median represents the middle value of a data set and is particularly valuable when dealing with skewed data or outliers that would distort the mean. In statistics, the median provides a more representative measure of central tendency when extreme values exist. Students learn to arrange values in ascending order, then identify the middle value (or calculate the midpoint of the two middle values for even-sized data sets).
Real-world applications include house price statistics, where the median gives a better sense of typical property values than the mean, which gets inflated by extremely expensive properties. Salary data, healthcare waiting times and climate records all use median values for this reason. Understanding when median is more appropriate than mean becomes crucial in GCSE statistics and supports critical thinking about how data can be presented or misrepresented in the media.
How do these worksheets help students practise averages and range?
The worksheets build confidence through structured practice that moves from straightforward calculations with small, manageable numbers to more challenging problems involving decimals and larger data sets. Questions are organised so students can consolidate the method for each type of average before combining skills. The answer sheets allow students to check their working independently, helping them identify where errors occur in their calculation process rather than just whether their final answer is correct.
Many teachers use these worksheets for targeted intervention with students who struggle to retain the different methods, as repeated practice with varied examples helps secure procedural fluency. They work well as homework to reinforce classwork or as starter activities to check retention from previous lessons. Some teachers set them as paired work where one student calculates mean and median whilst their partner finds mode and range, then they compare answers.