Averages and Range from Tables Worksheets
All worksheets are created by the team of experienced teachers at Cazoom Maths.
How do you calculate averages from frequency tables?
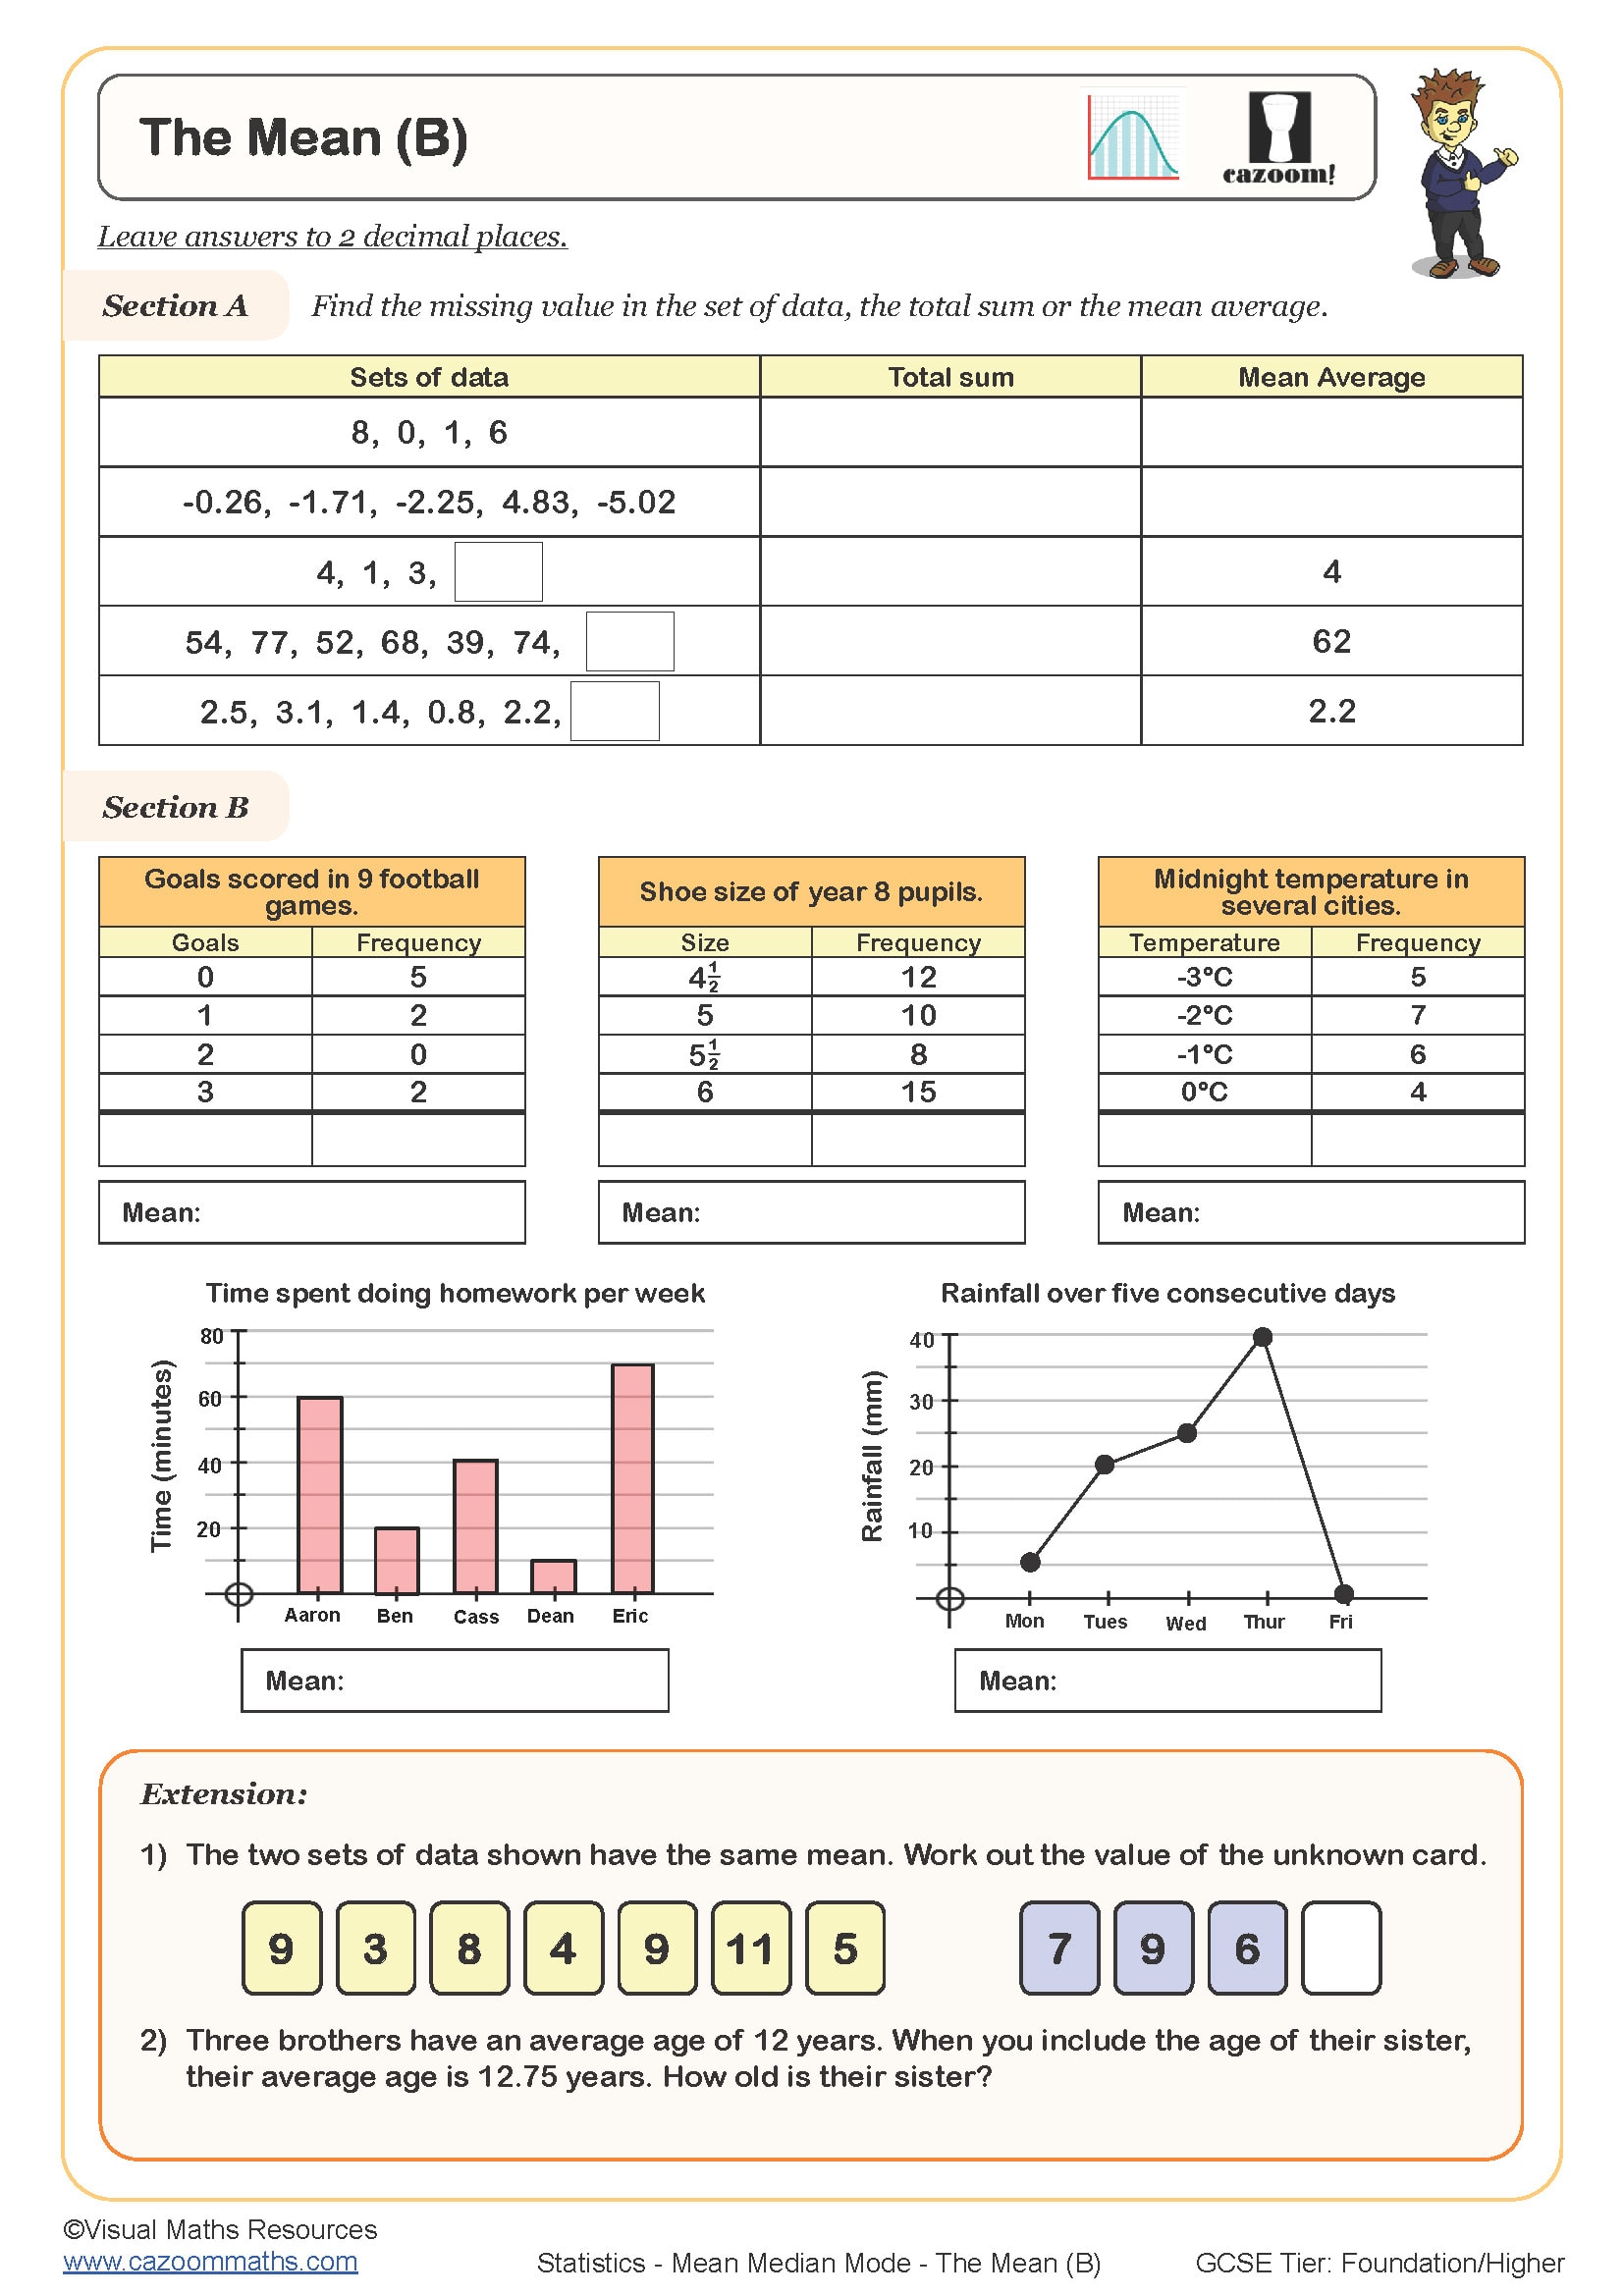
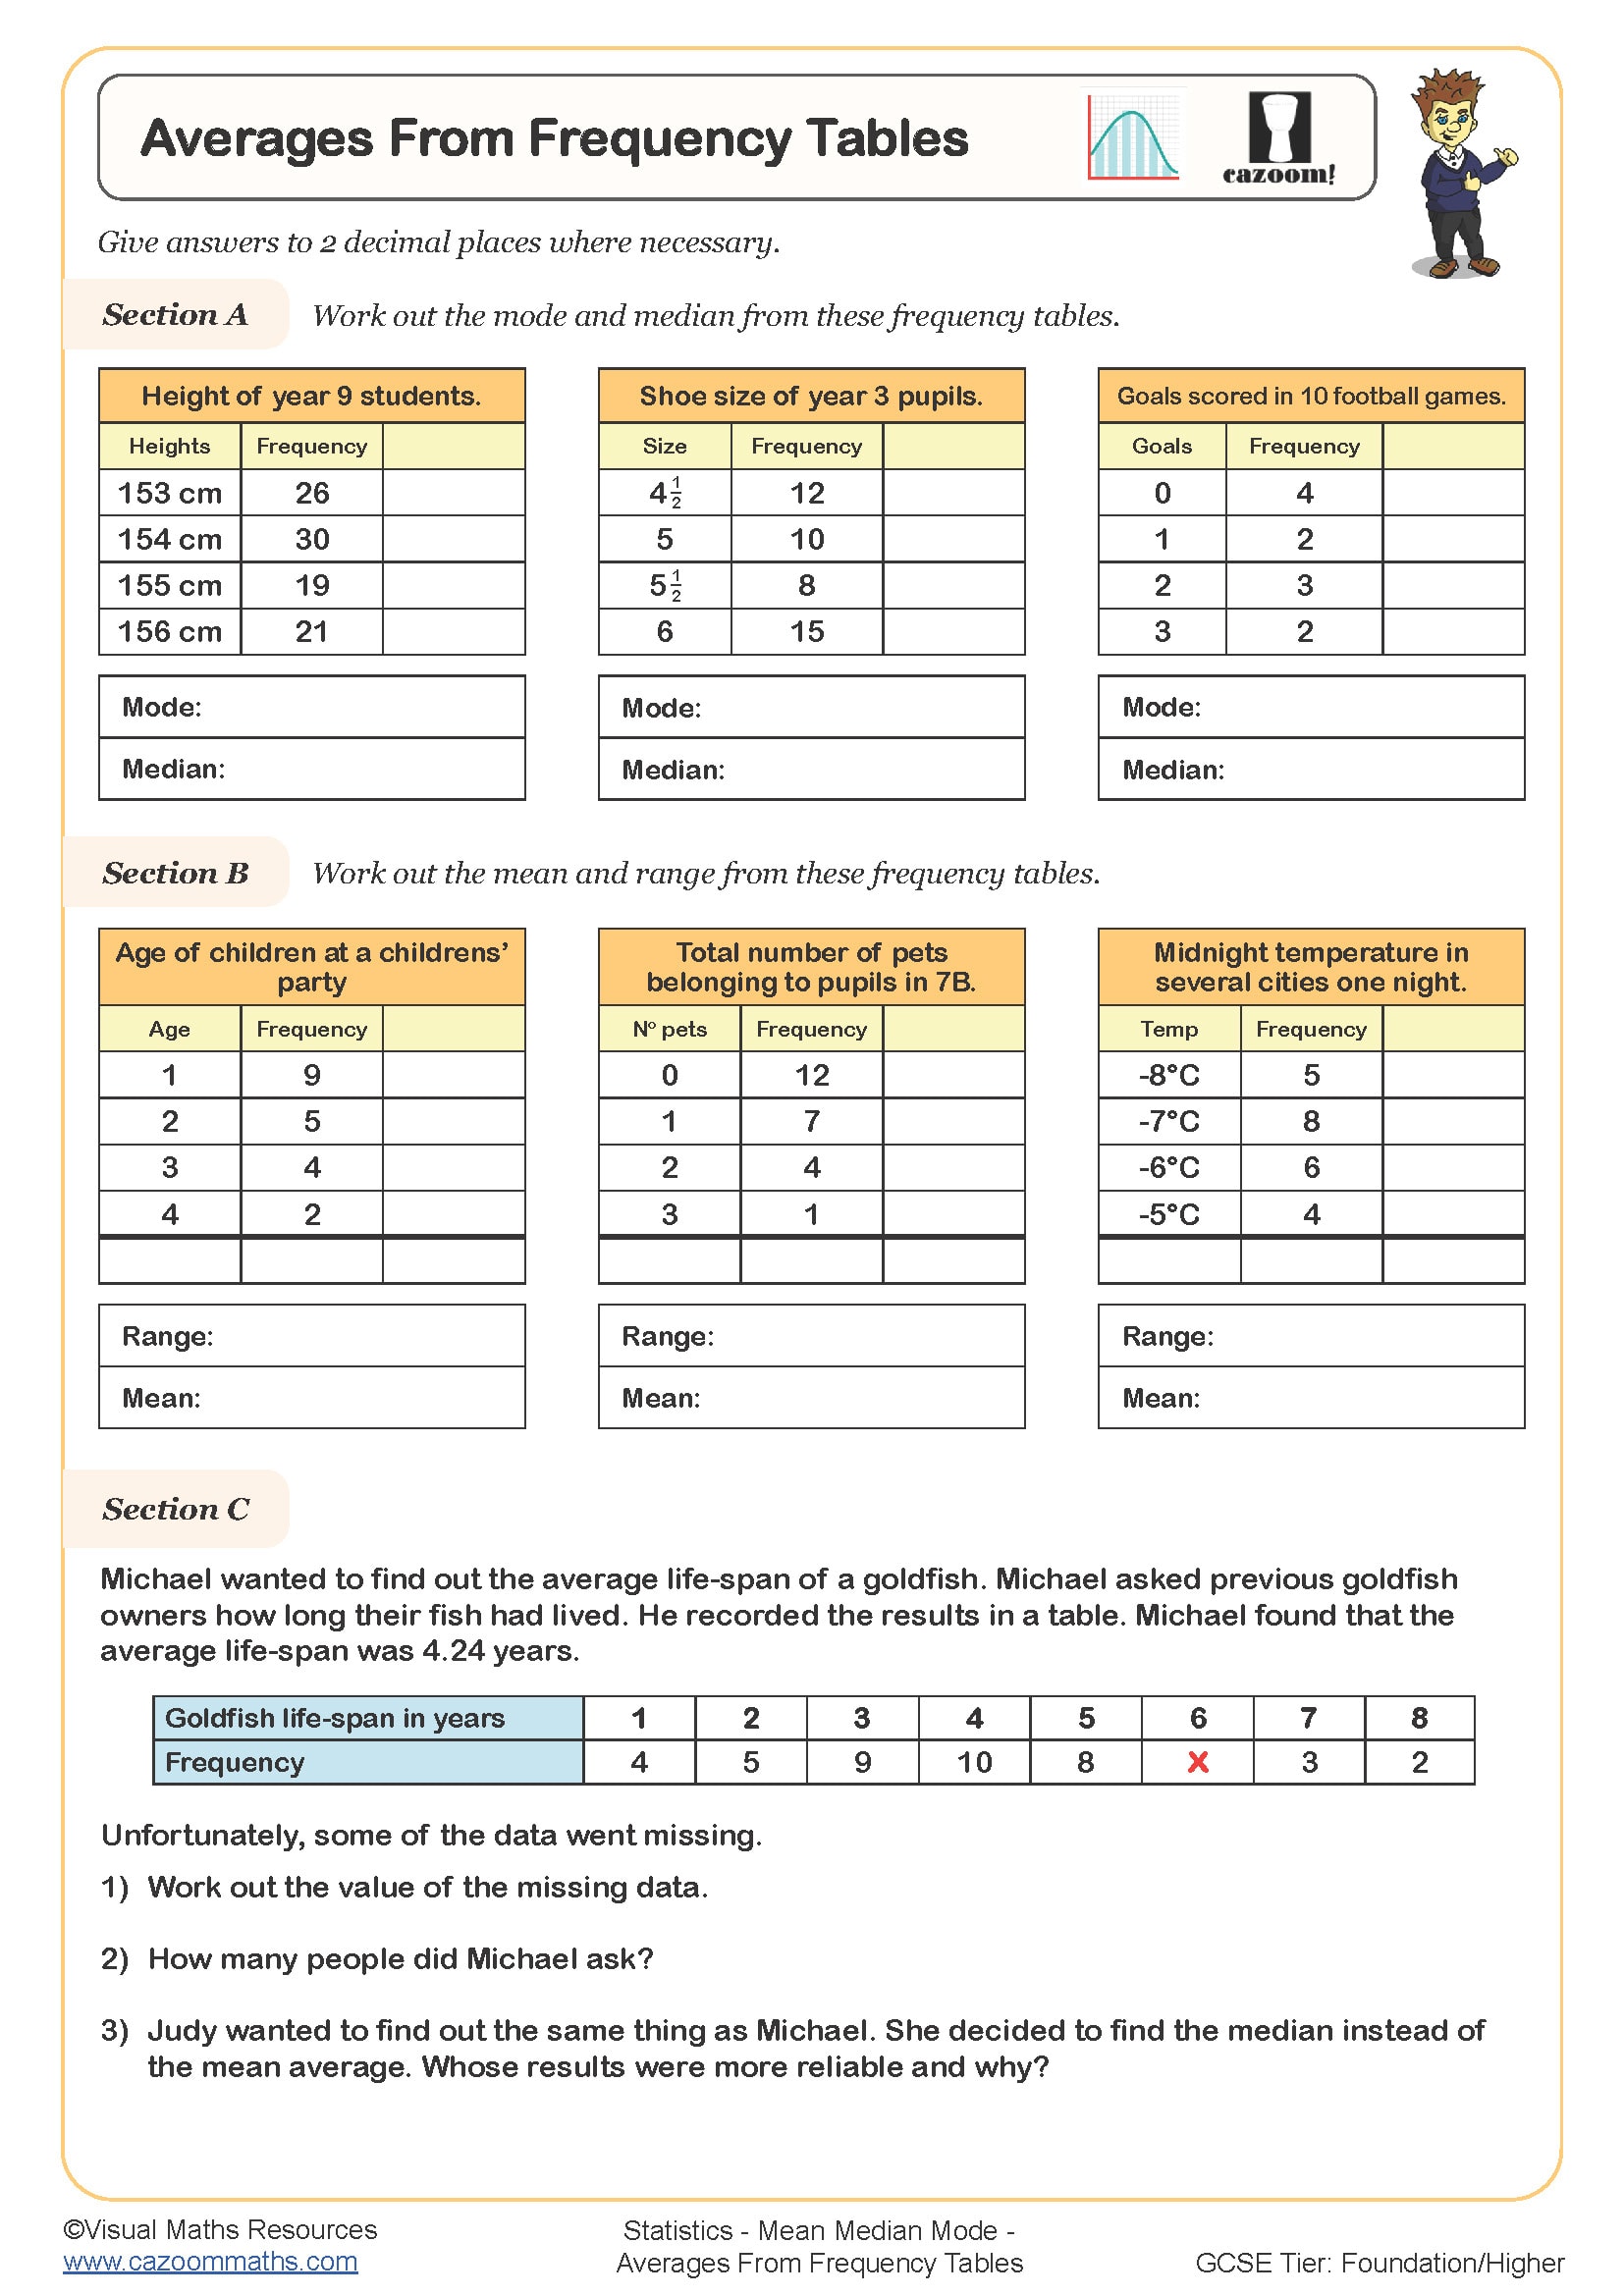
To find averages from frequency tables, students multiply each data value by its frequency, then apply the standard methods for mean (sum of all values divided by total frequency), median (the middle value when frequencies are counted cumulatively) and mode (the value with the highest frequency). The range remains the difference between the highest and lowest data values, regardless of frequency.
The most common error occurs when calculating the median, where students simply select the middle number from the value column rather than using cumulative frequency to locate the actual middle position. For example, if the total frequency is 30, the median is the 15th value, which requires adding frequencies until reaching or passing position 15. This systematic approach prevents the typical mistakes seen in exam responses.
Which year groups study averages and range from tables?
These worksheets cover Year 7, Year 8 and Year 9 as part of the KS3 statistics curriculum. Finding averages from frequency tables builds directly on the work students complete with averages from lists in upper KS2, extending their understanding to handle larger datasets more efficiently. This topic sits within the National Curriculum requirement to interpret and construct tables and use them to solve problems.
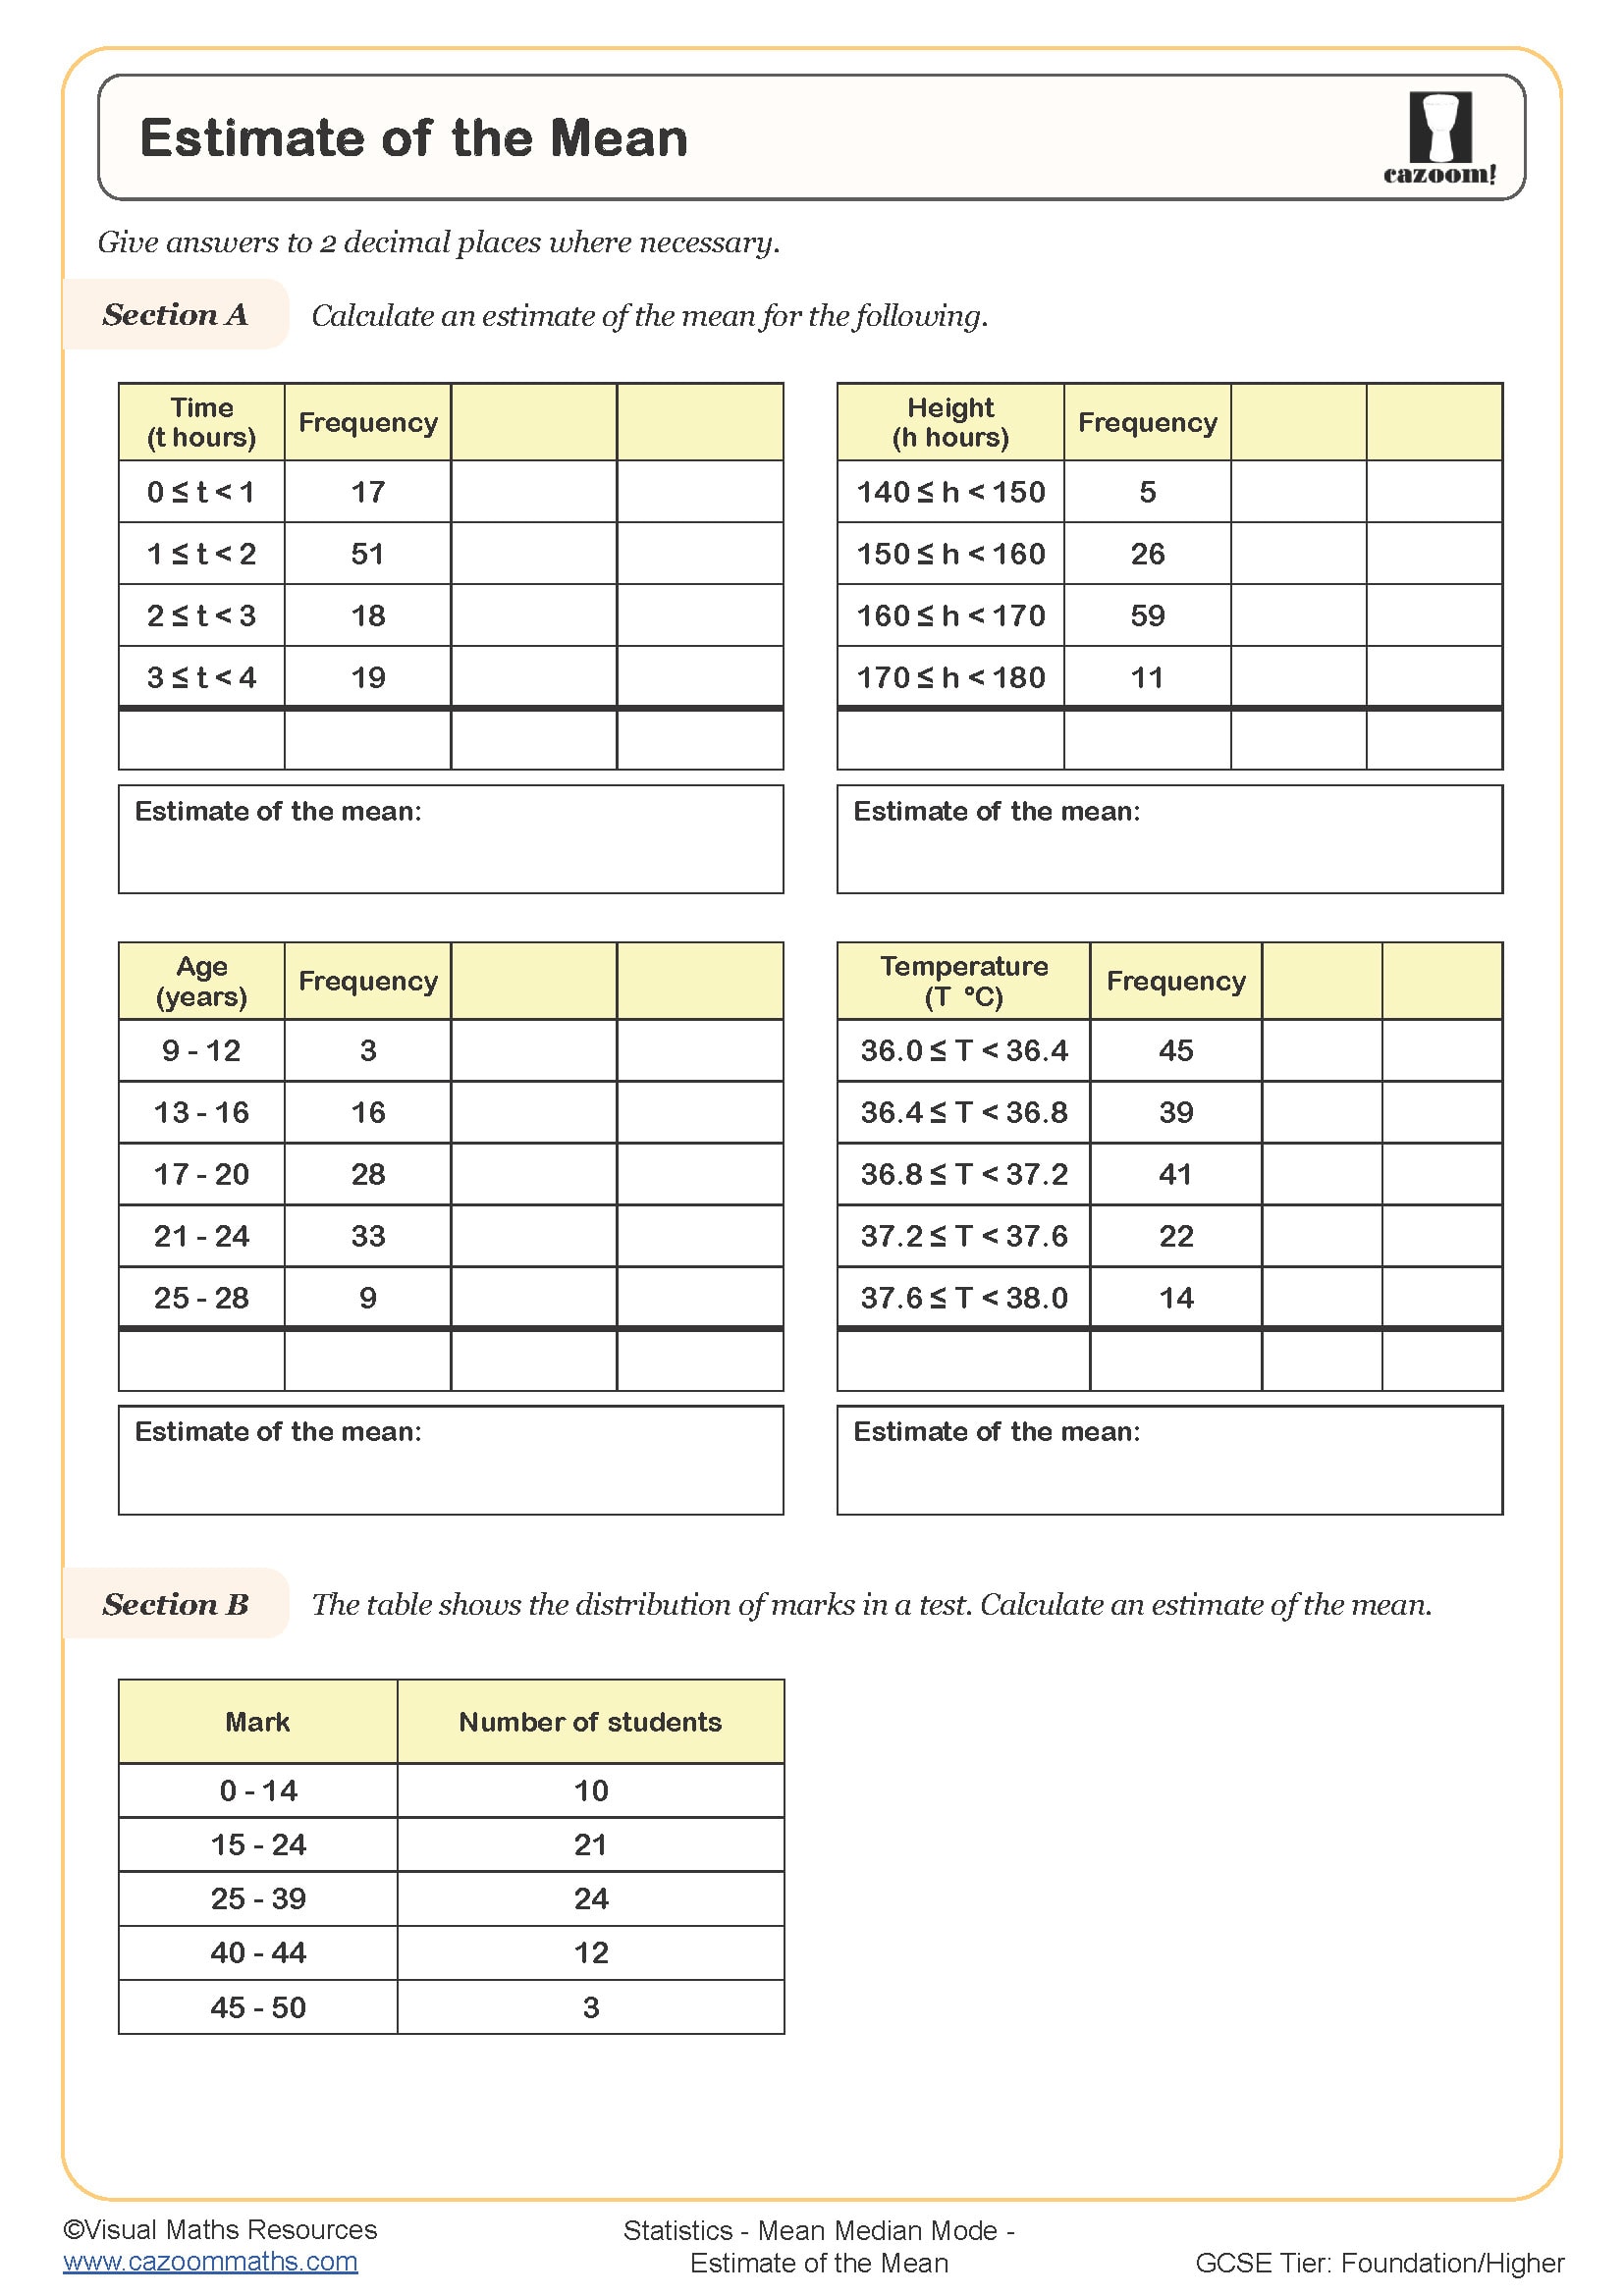
The progression across these year groups typically involves starting with simple ungrouped frequency tables in Year 7, then introducing grouped data where students must use midpoints to estimate the mean by Year 9. Students also encounter increasingly complex scenarios, such as missing frequencies or problems requiring them to work backwards from a given mean to find unknown values.
What is the difference between grouped and ungrouped frequency tables?
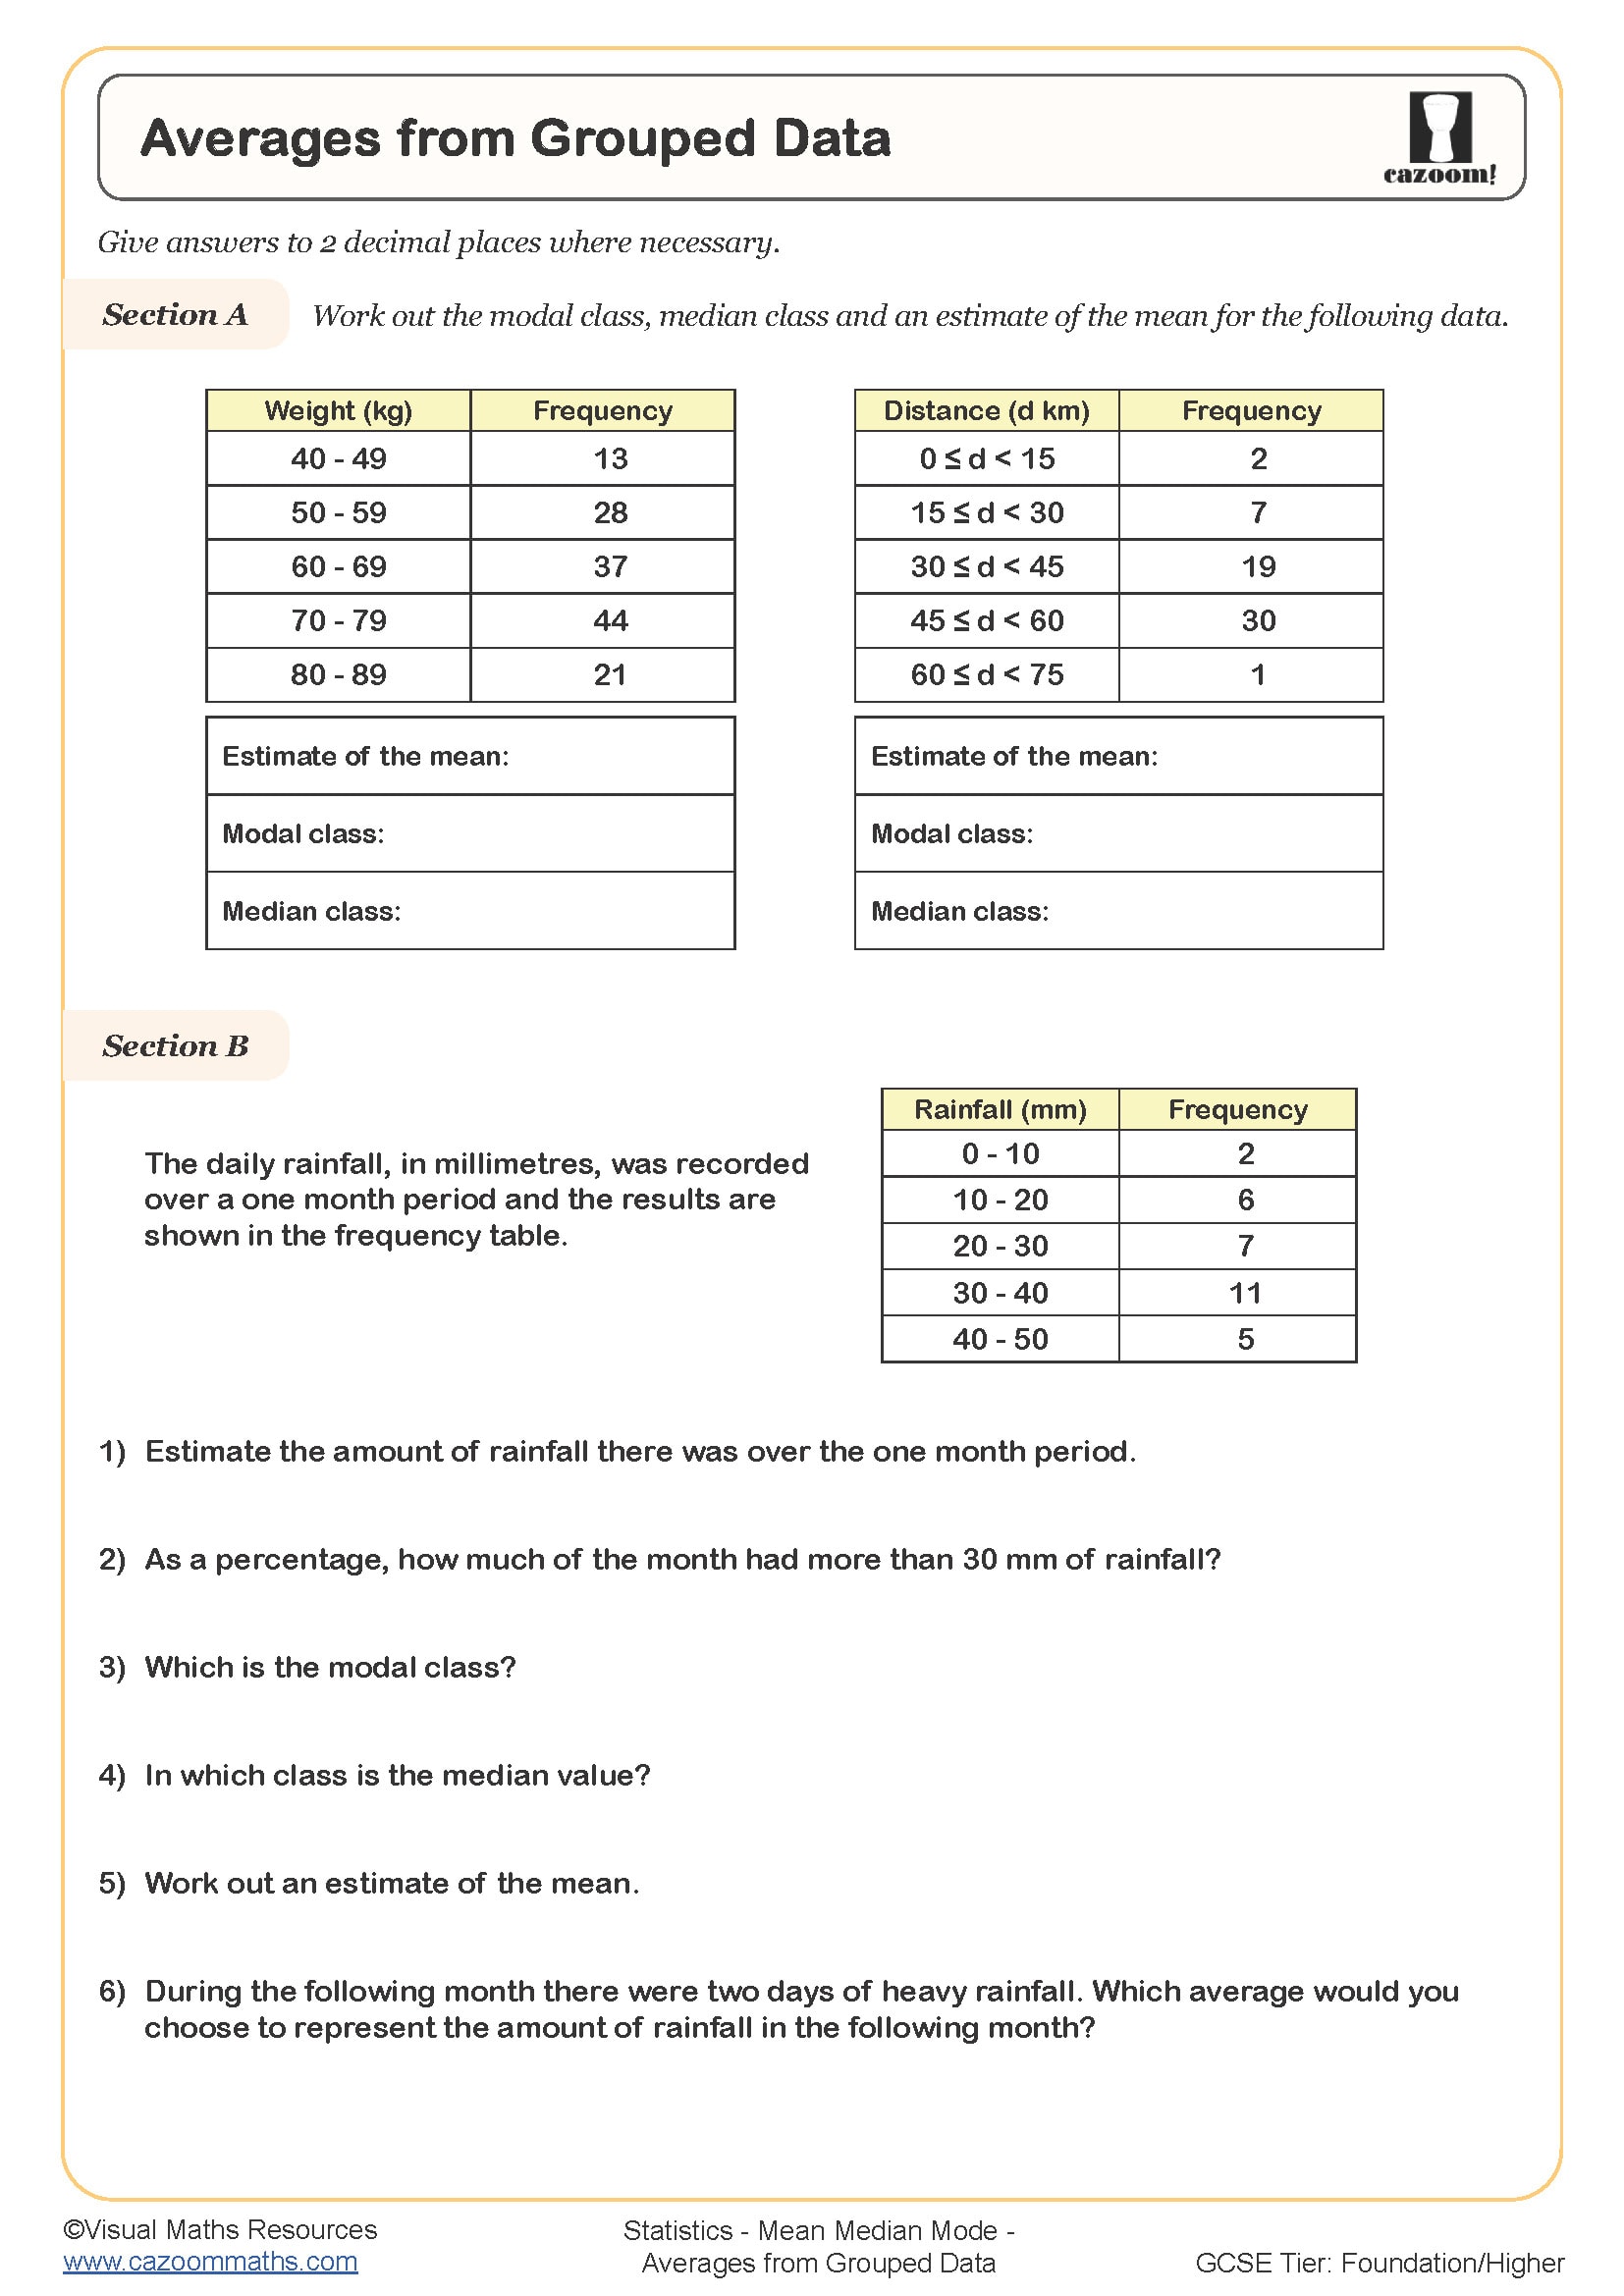
Ungrouped frequency tables list individual data values with their frequencies, allowing students to calculate exact averages. Grouped frequency tables organise data into class intervals (such as 0-10, 10-20), which means the mean can only be estimated using the midpoint of each class interval. Students must understand that grouped data sacrifices precision for the ability to handle larger, more complex datasets efficiently.
This skill connects directly to real-world data handling in fields like market research, quality control and medical studies, where large datasets are routinely grouped for analysis. For instance, manufacturers might group production times into intervals to identify the modal class for typical completion times, or hospitals might analyse patient wait times using grouped frequency tables to monitor service standards and resource allocation across different departments.
How do these worksheets support learning about frequency tables?
The worksheets provide structured practice that builds confidence with the procedural steps required for each type of average, helping students develop fluency with frequency table calculations before tackling more complex statistical problems. Questions typically progress from straightforward calculations to problem-solving scenarios that require students to interpret their answers or work with partially completed tables.
Many teachers use these resources for targeted intervention with students who struggle during whole-class teaching, as the answer sheets allow for immediate self-correction and identification of specific misconceptions. They work equally well as homework to consolidate classwork, as starter activities to refresh prior learning, or during revision sessions before assessments. The PDF format means they can be printed for individuals who need extra support or displayed for whole-class worked examples.