Frequency Trees Worksheets
All worksheets are created by the team of experienced teachers at Cazoom Maths.
What are frequency trees in maths?
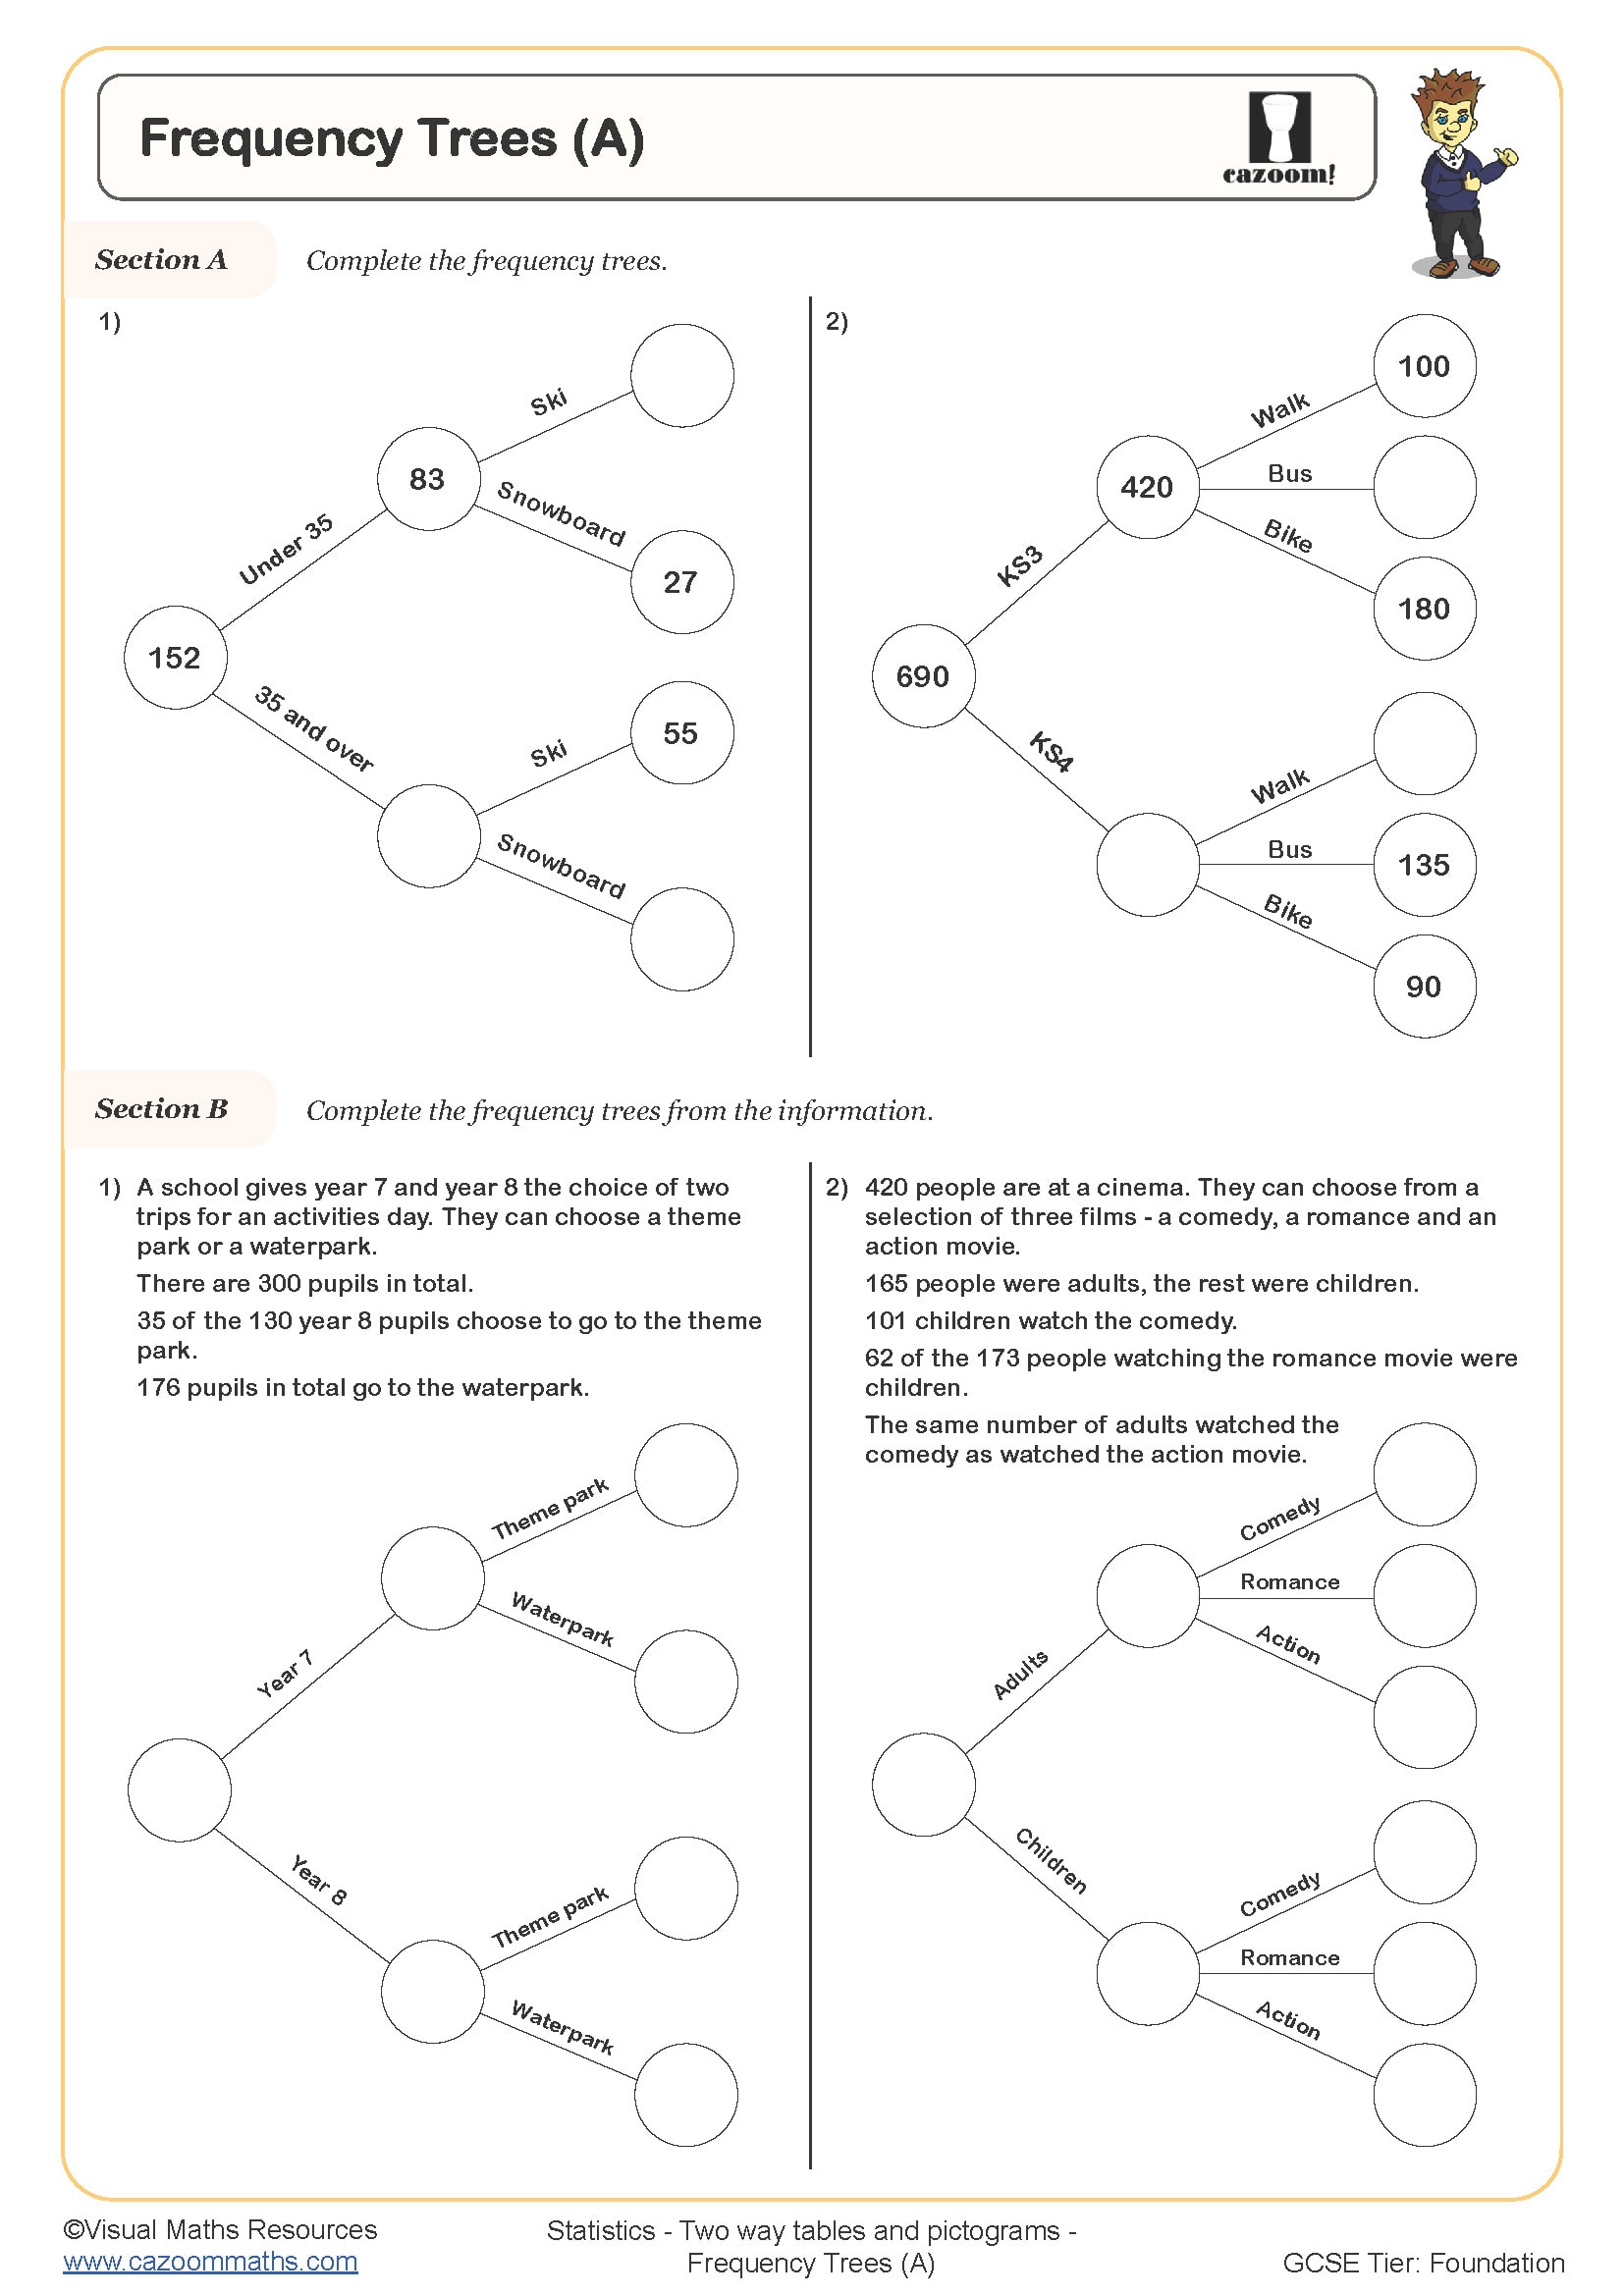
Frequency trees are branching diagrams that display how data is distributed across two or more categories, showing actual counts rather than probabilities. In the National Curriculum for KS3 statistics, they provide an alternative visual representation to two-way tables, helping students organise categorical data systematically and calculate missing frequencies using addition and subtraction.
A frequency tree might show 60 students split by gender (male/female) and then by transport method (bus/car/walk), with each branch labelled with the actual number in that category. Students often make the mistake of treating these numbers as probabilities or percentages, particularly when they encounter probability trees later in Year 8 and Year 9. Teachers notice this confusion surfaces when students try to add branches that don't sit at the same level or when they fail to check that all branches from one point sum to the total shown.
Which year groups learn about frequency trees?
Frequency trees appear in the KS3 statistics curriculum, with these worksheets covering Year 7 and Year 8 content. Students typically meet frequency trees after working with two-way tables and tally charts, as the tree structure offers another way to organise the same categorical data. This timing allows students to develop their understanding of how different statistical representations connect to one another.
In Year 7, students generally focus on interpreting completed frequency trees and filling in missing values when most information is provided. By Year 8, the complexity increases as students work with trees that have more missing values requiring multi-step reasoning, and they begin constructing their own frequency trees from written data or two-way tables. This progression mirrors their developing algebraic skills, as finding unknown frequencies often involves working backwards through the branches using inverse operations.
How do you work out missing values in a frequency tree?
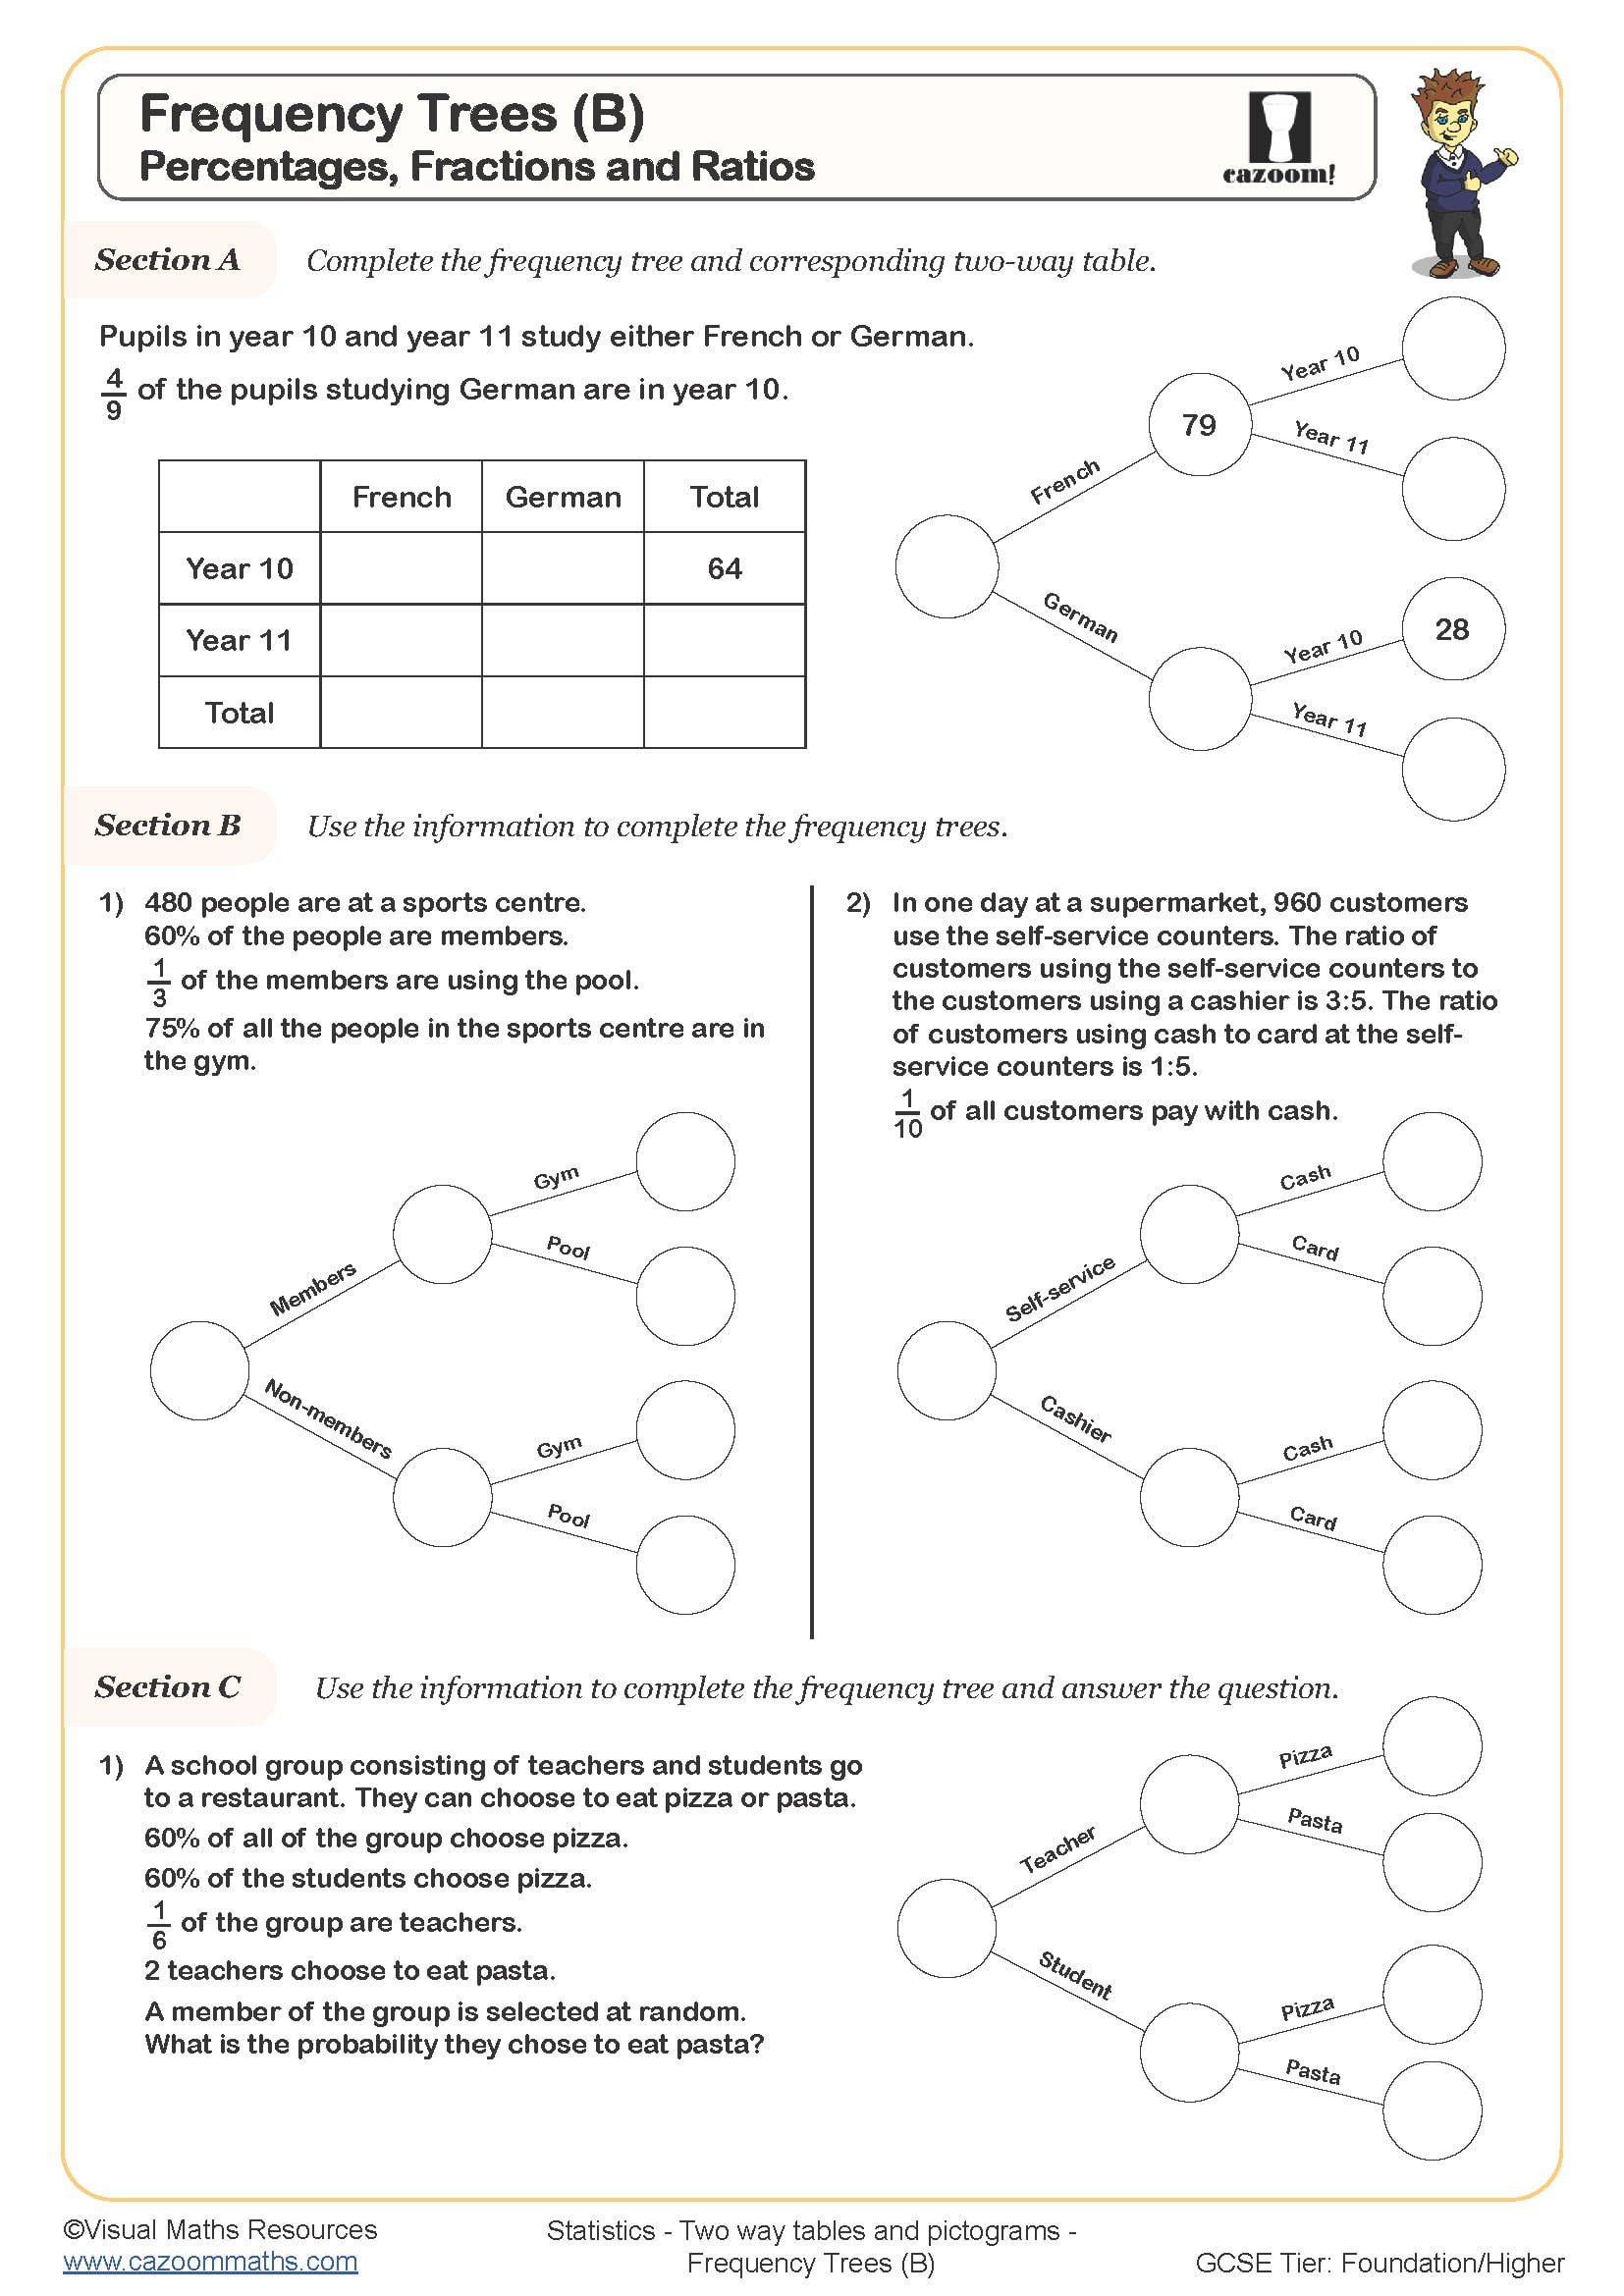
Finding missing values in a frequency tree relies on understanding that all branches stemming from the same point must add up to the total at that point. Students work systematically through the tree, using addition to combine known branches and subtraction to find unknowns when the total is given. The key skill involves identifying which values can be calculated first and which depend on earlier calculations, building a logical sequence of steps.
This skill connects directly to data analysis in science investigations, where students categorise results across multiple variables. In biology, researchers might use frequency trees to organise ecological survey data showing how many organisms of each species were found in different habitat types. In market research, companies analyse customer data using similar structures to understand how preferences vary across age groups and regions. The logical reasoning students develop when completing frequency trees strengthens their problem-solving abilities across STEM subjects where categorising and quantifying data is fundamental.
How can these frequency trees worksheets help my students?
The worksheets build understanding through carefully structured questions that start with interpreting straightforward frequency trees before progressing to those with multiple missing values. This scaffolded approach allows students to develop confidence with the basic concept before tackling problems that require more complex reasoning. The answer sheets show complete working, which helps students understand the logical steps needed rather than just checking final answers.
Teachers use these resources effectively for mixed-ability teaching by differentiating which questions students attempt, with some focusing on reading and simple completion whilst others work through multi-step problems. They work well as homework tasks because the visual nature of frequency trees makes them accessible for independent work, yet the challenge level ensures students must think carefully rather than apply memorised procedures. In revision sessions before assessments, frequency trees often benefit from paired work where students explain their reasoning to each other, exposing misconceptions about how branches relate to totals.