Line Graphs Worksheets
All worksheets are created by the team of experienced teachers at Cazoom Maths.
What are line graphs used for in maths?
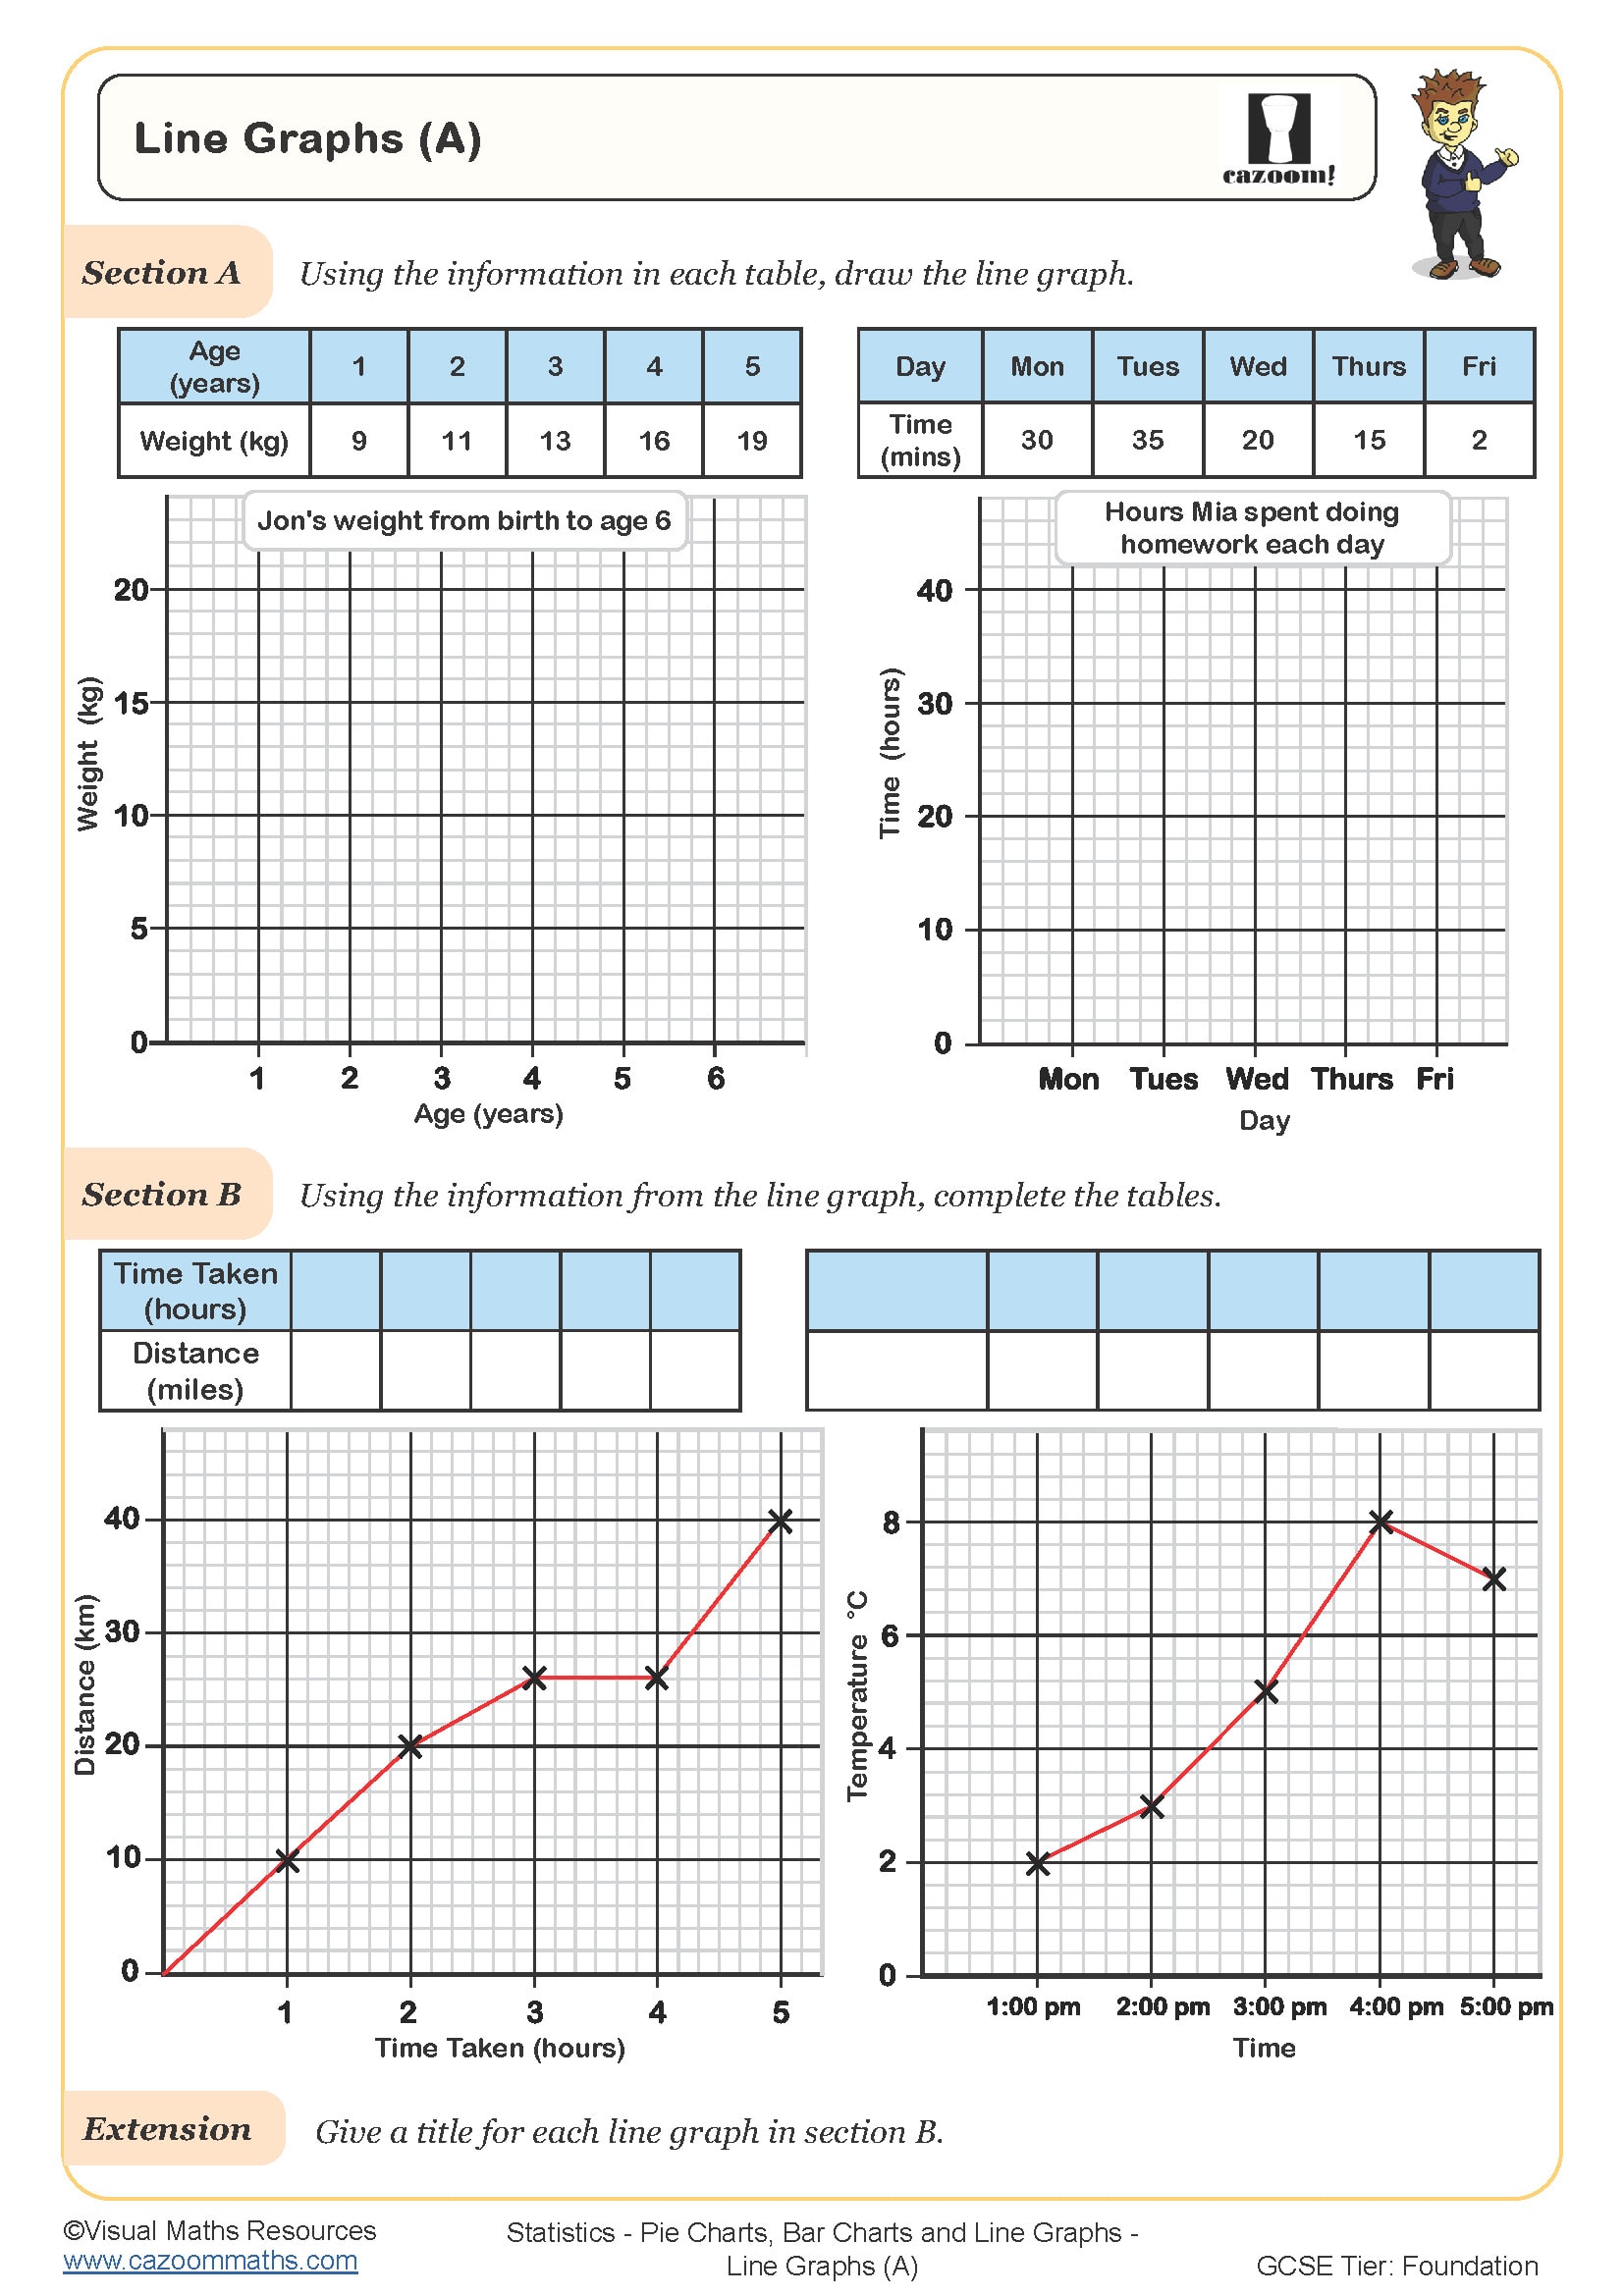
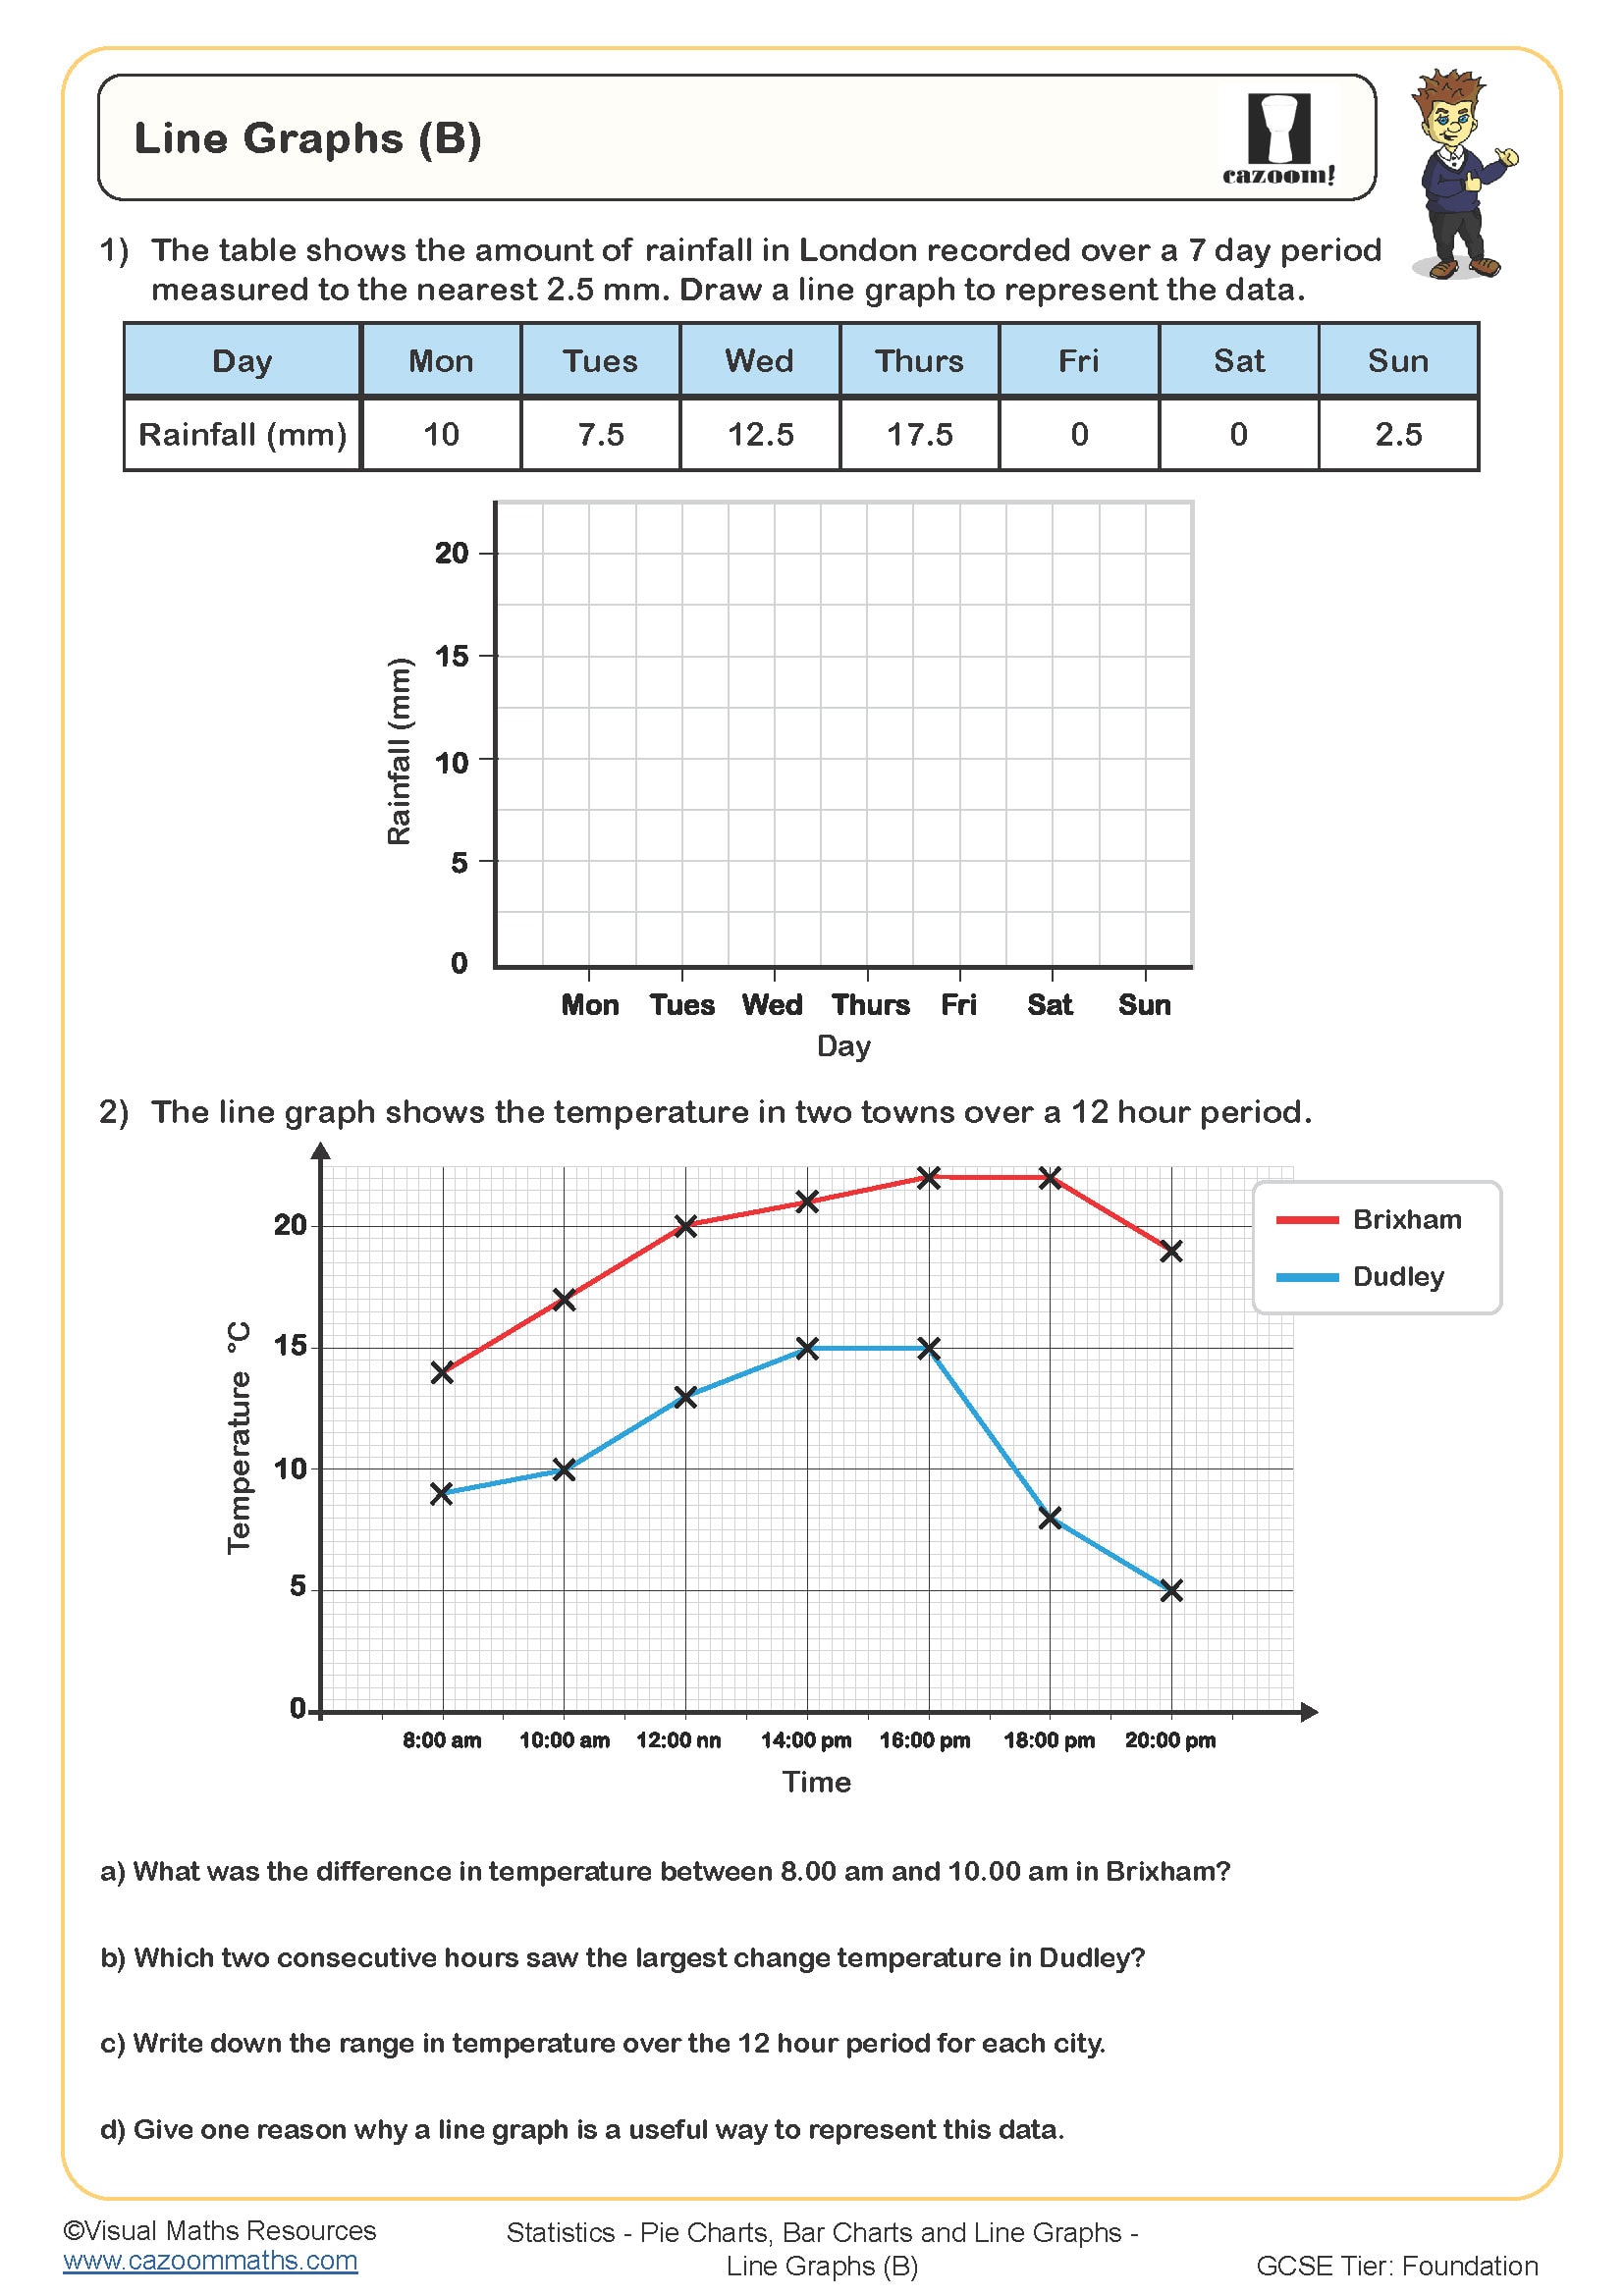
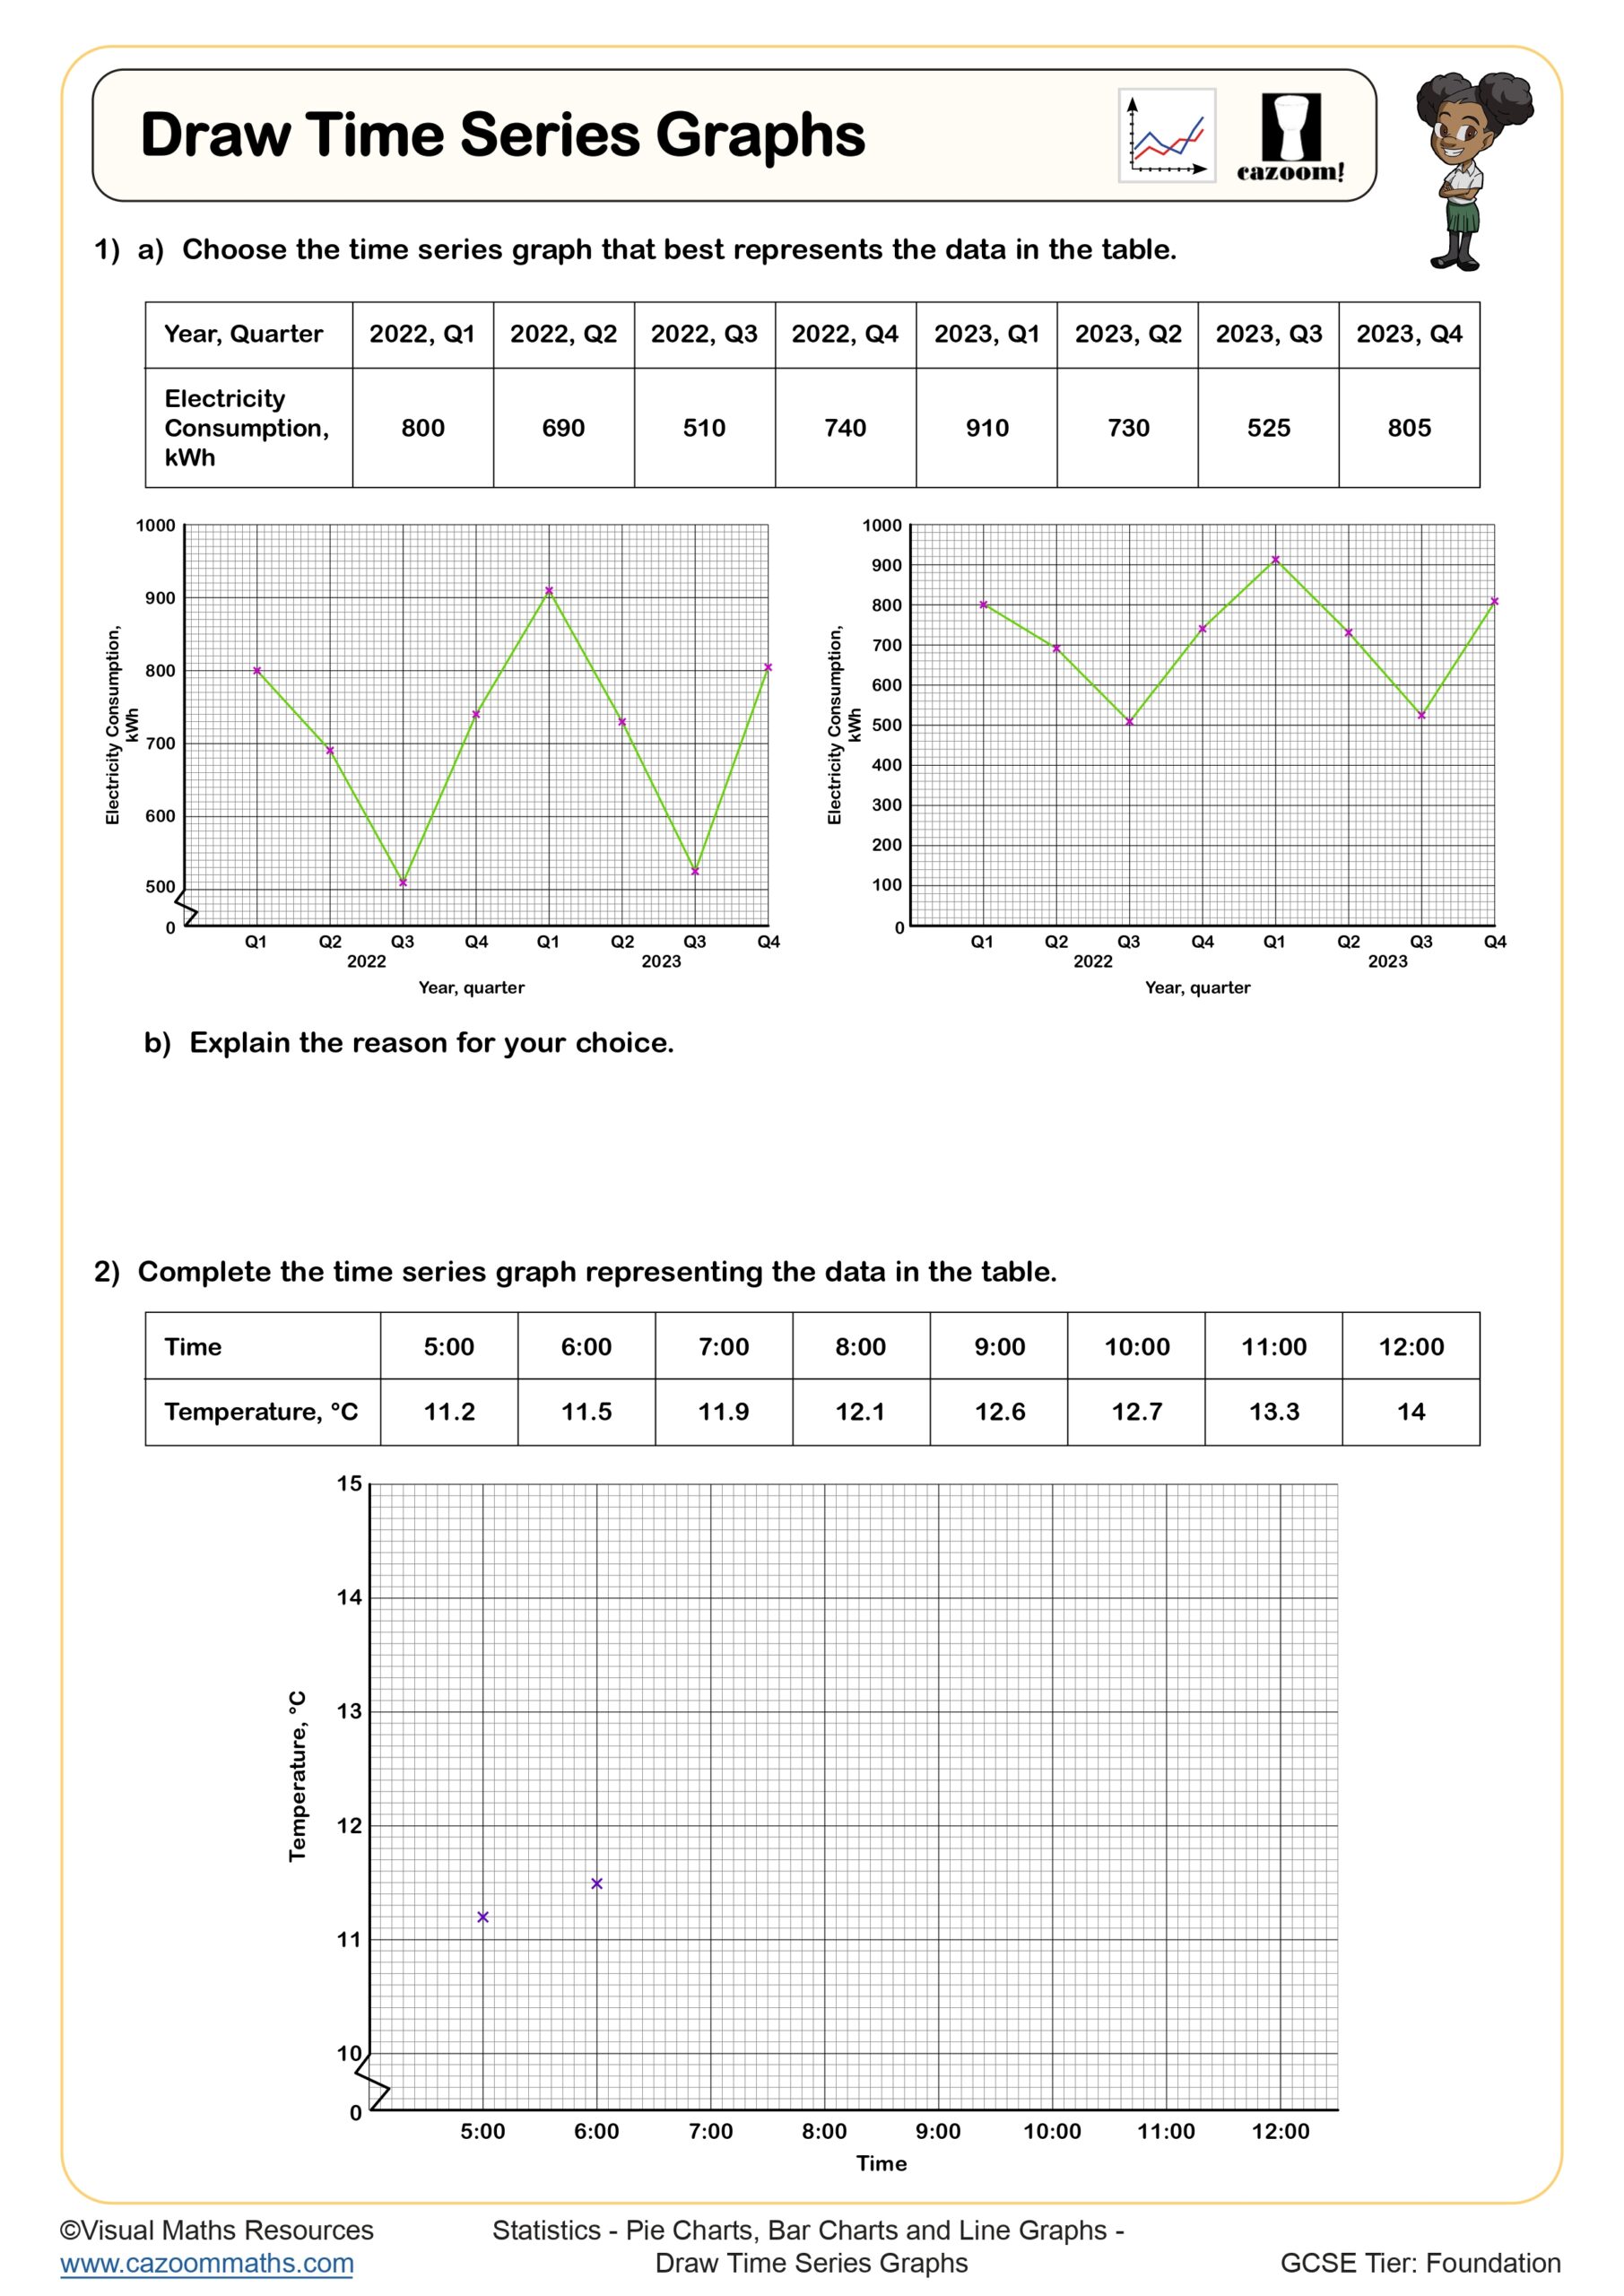
Line graphs display continuous data where values change over time or across a variable, showing trends and patterns through connected points. In the National Curriculum, students use line graphs to represent relationships between two variables, particularly when exploring linear functions and direct proportion at KS3 and KS4. The connection between plotted points reveals whether a relationship is linear, helping students transition from basic data handling to algebraic thinking.
Teachers often notice students treat line graphs like bar charts, plotting bars instead of points or failing to connect points with straight lines. Another common error occurs when students don't extend lines to the axes when required, particularly when finding intercepts. Understanding that the line represents all possible values between plotted points, not just the data collected, requires explicit teaching and repeated practice with varied examples.
Which year groups study line graphs?
These worksheets cover line graphs for Year 7, Year 8, Year 9, and Year 10, spanning both Key Stage 3 and Key Stage 4. At KS3, students begin by plotting straightforward line graphs with positive coordinates and simple scales, developing familiarity with continuous data representation. The topic features prominently in the statistics strand but also connects to algebra when exploring linear relationships.
Progression across these year groups involves increasingly complex contexts and scales. Year 7 students typically work with simple time-based line graphs using whole numbers, whilst Year 9 and Year 10 students encounter negative coordinates, fractional scales, and graphs requiring interpretation of gradients as rates of change. By GCSE, students must confidently draw and interpret straight line graphs in both statistics and algebra contexts, including finding equations from plotted lines.
How do you plot a straight line graph?
Plotting a straight line graph requires identifying coordinates, accurately locating points using both axes, and connecting them with a ruler. Students must read scales carefully, counting divisions to determine the value of each square, then plot points where the x-coordinate (horizontal) and y-coordinate (vertical) intersect. A common misconception teachers observe is students plotting (3, 5) at the third square along and fifth square up without checking the scale value, leading to incorrect positioning when axes don't start at zero or use intervals other than one.
Straight line graphs appear extensively in real-world applications, from conversion graphs (temperature, currency, measurements) to distance-time graphs in physics. Scientists use linear graphs to identify proportional relationships in experiments, such as extension against force in spring investigations or current against voltage in electrical circuits. Recognising that three points lying on a straight line indicate a linear relationship helps students analyse data patterns across STEM subjects.
How do these worksheets help students learn about line graphs?
The worksheets provide structured practice that develops accuracy in plotting points and confidence in reading information from graphs. Questions progress from straightforward plotting tasks to more demanding interpretation questions, helping students recognise that line graphs show continuous change rather than discrete values. Answer sheets allow students to identify plotting errors immediately, which proves particularly valuable since small inaccuracies in coordinate work compound when finding gradients or solving related problems.
Many teachers use these worksheets during intervention sessions to address gaps in coordinate skills before tackling algebraic graphs. They work effectively as homework to reinforce classroom teaching, giving students independent practice with immediate feedback available. For revision, the worksheets help students revisit plotting techniques and scale-reading skills that underpin examination questions on distance-time graphs, conversion graphs, and straight line equations where accuracy in reading values directly affects marks awarded.