Mean Median Mode Worksheets
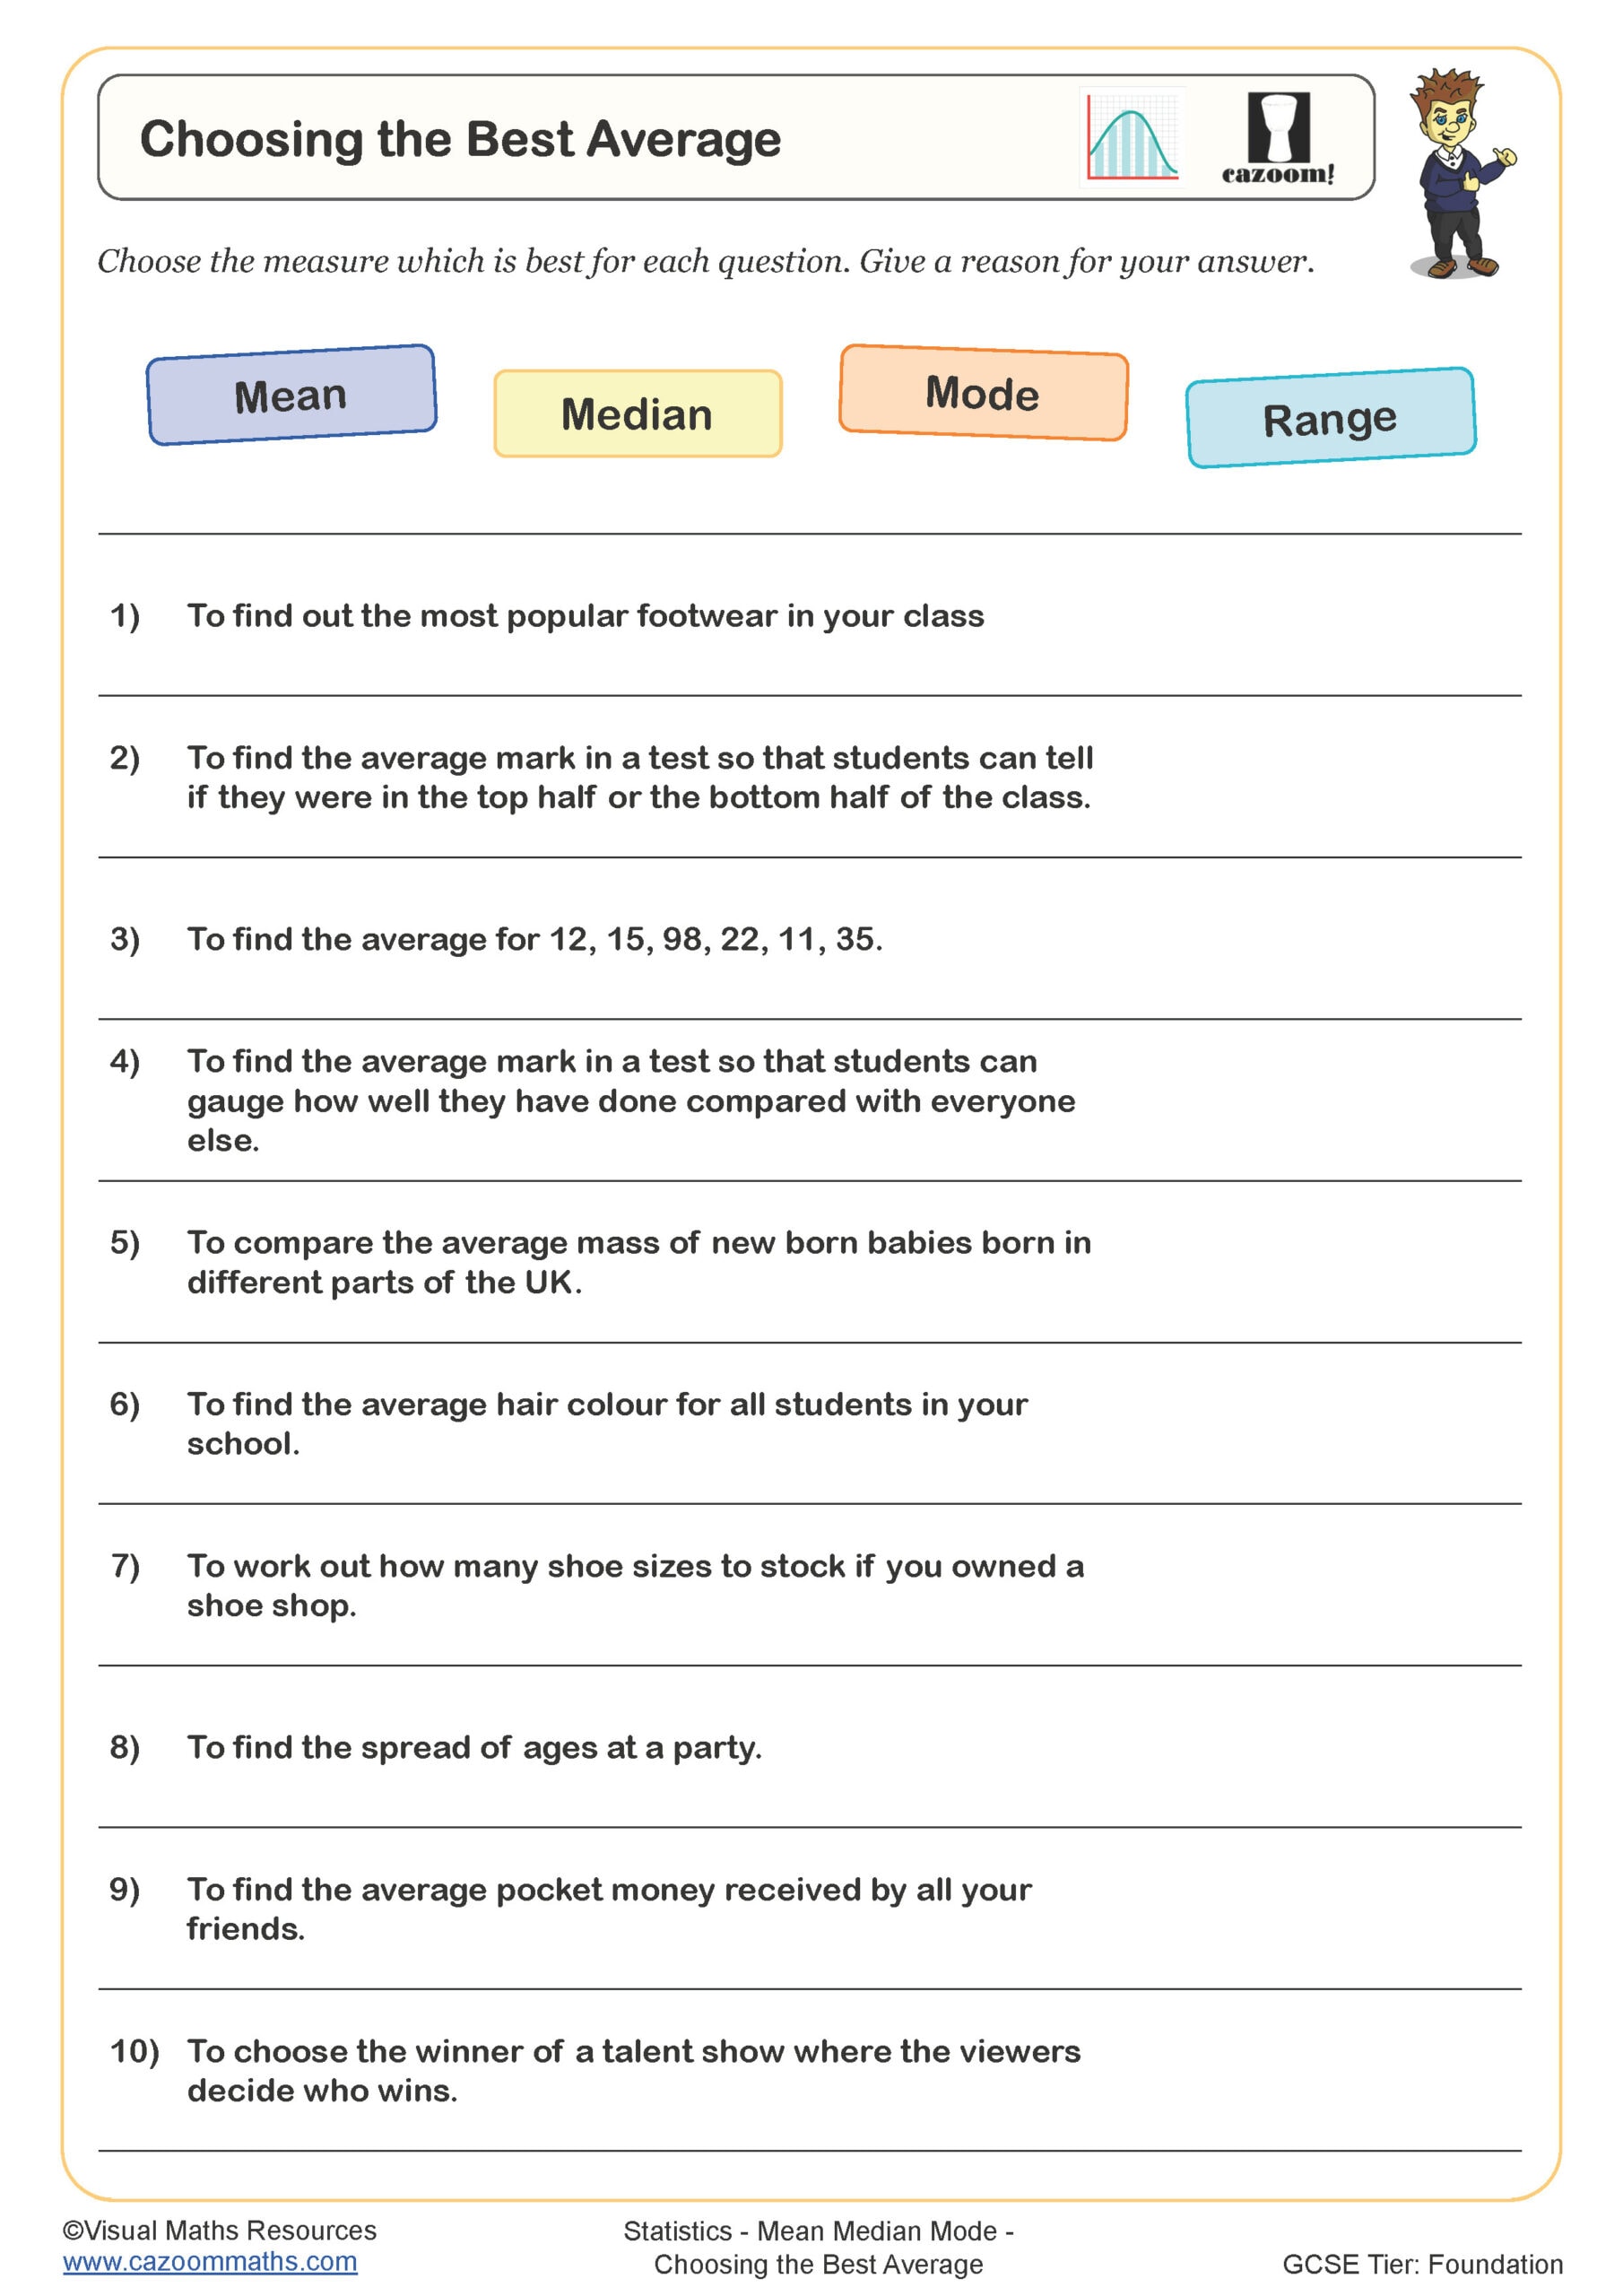
Choosing the Best Average
Year groups: 7, 8
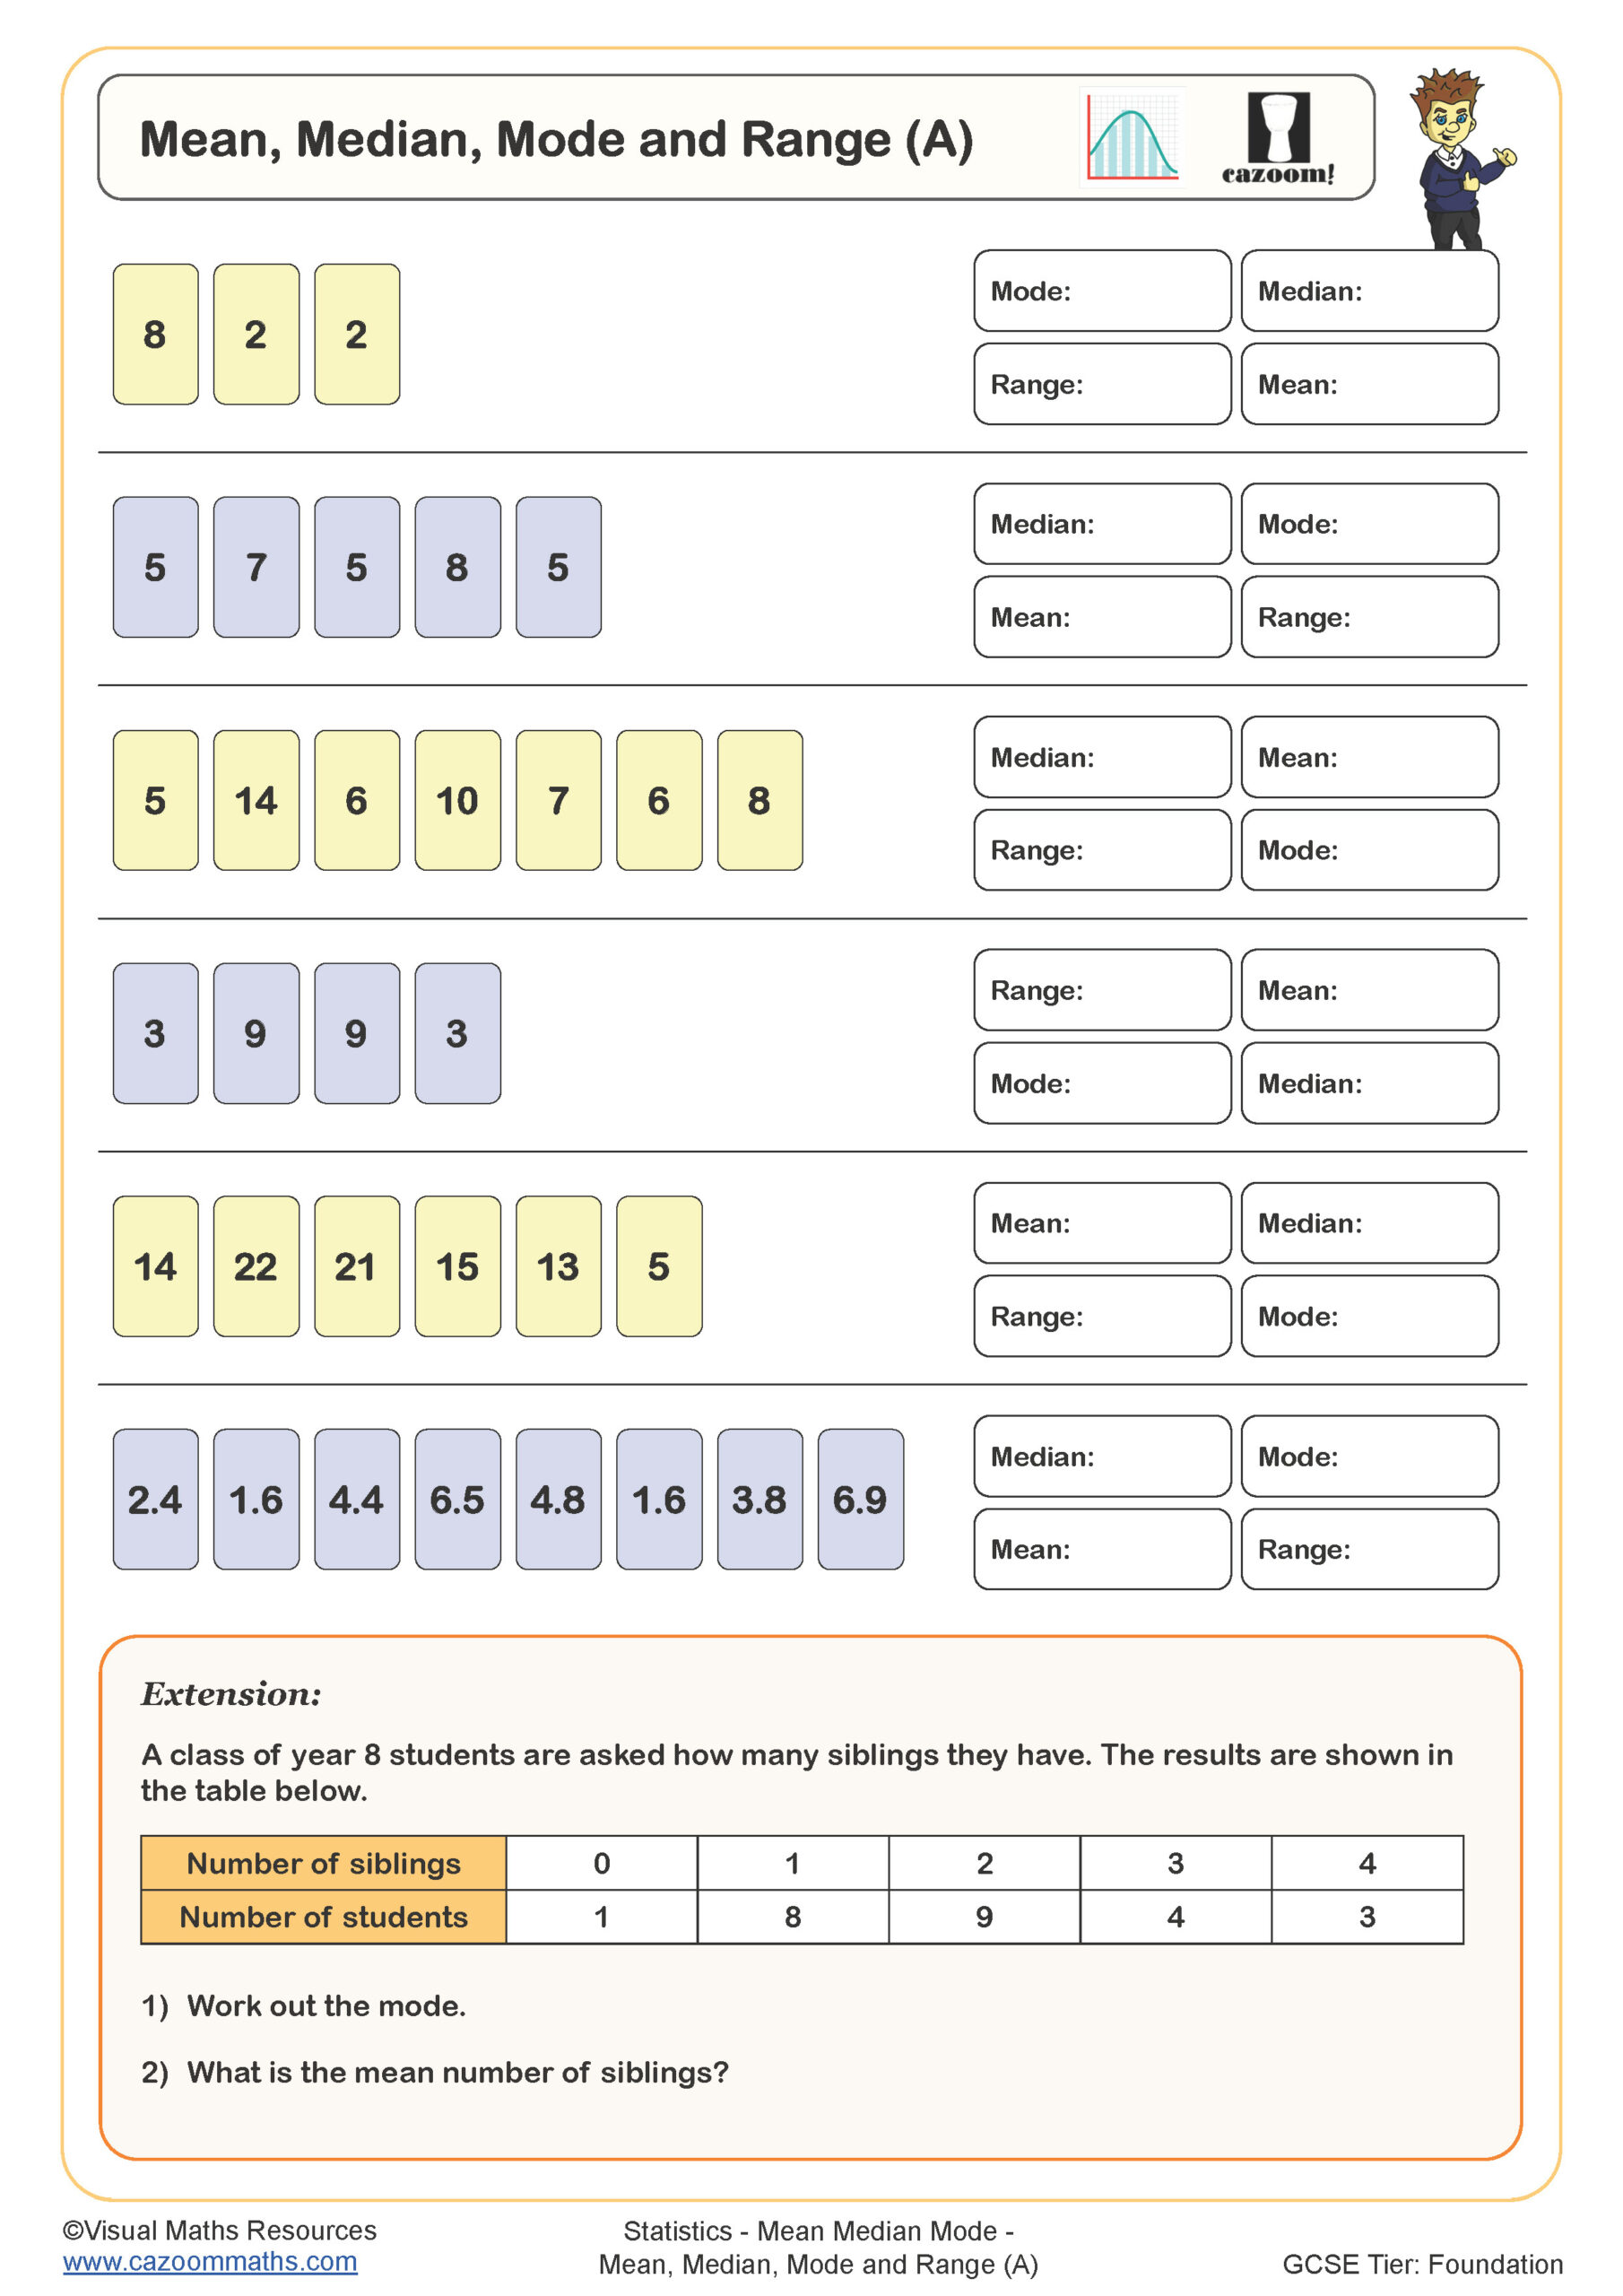
Mean, Median, Mode and Range (A)
Year groups: 7, 8
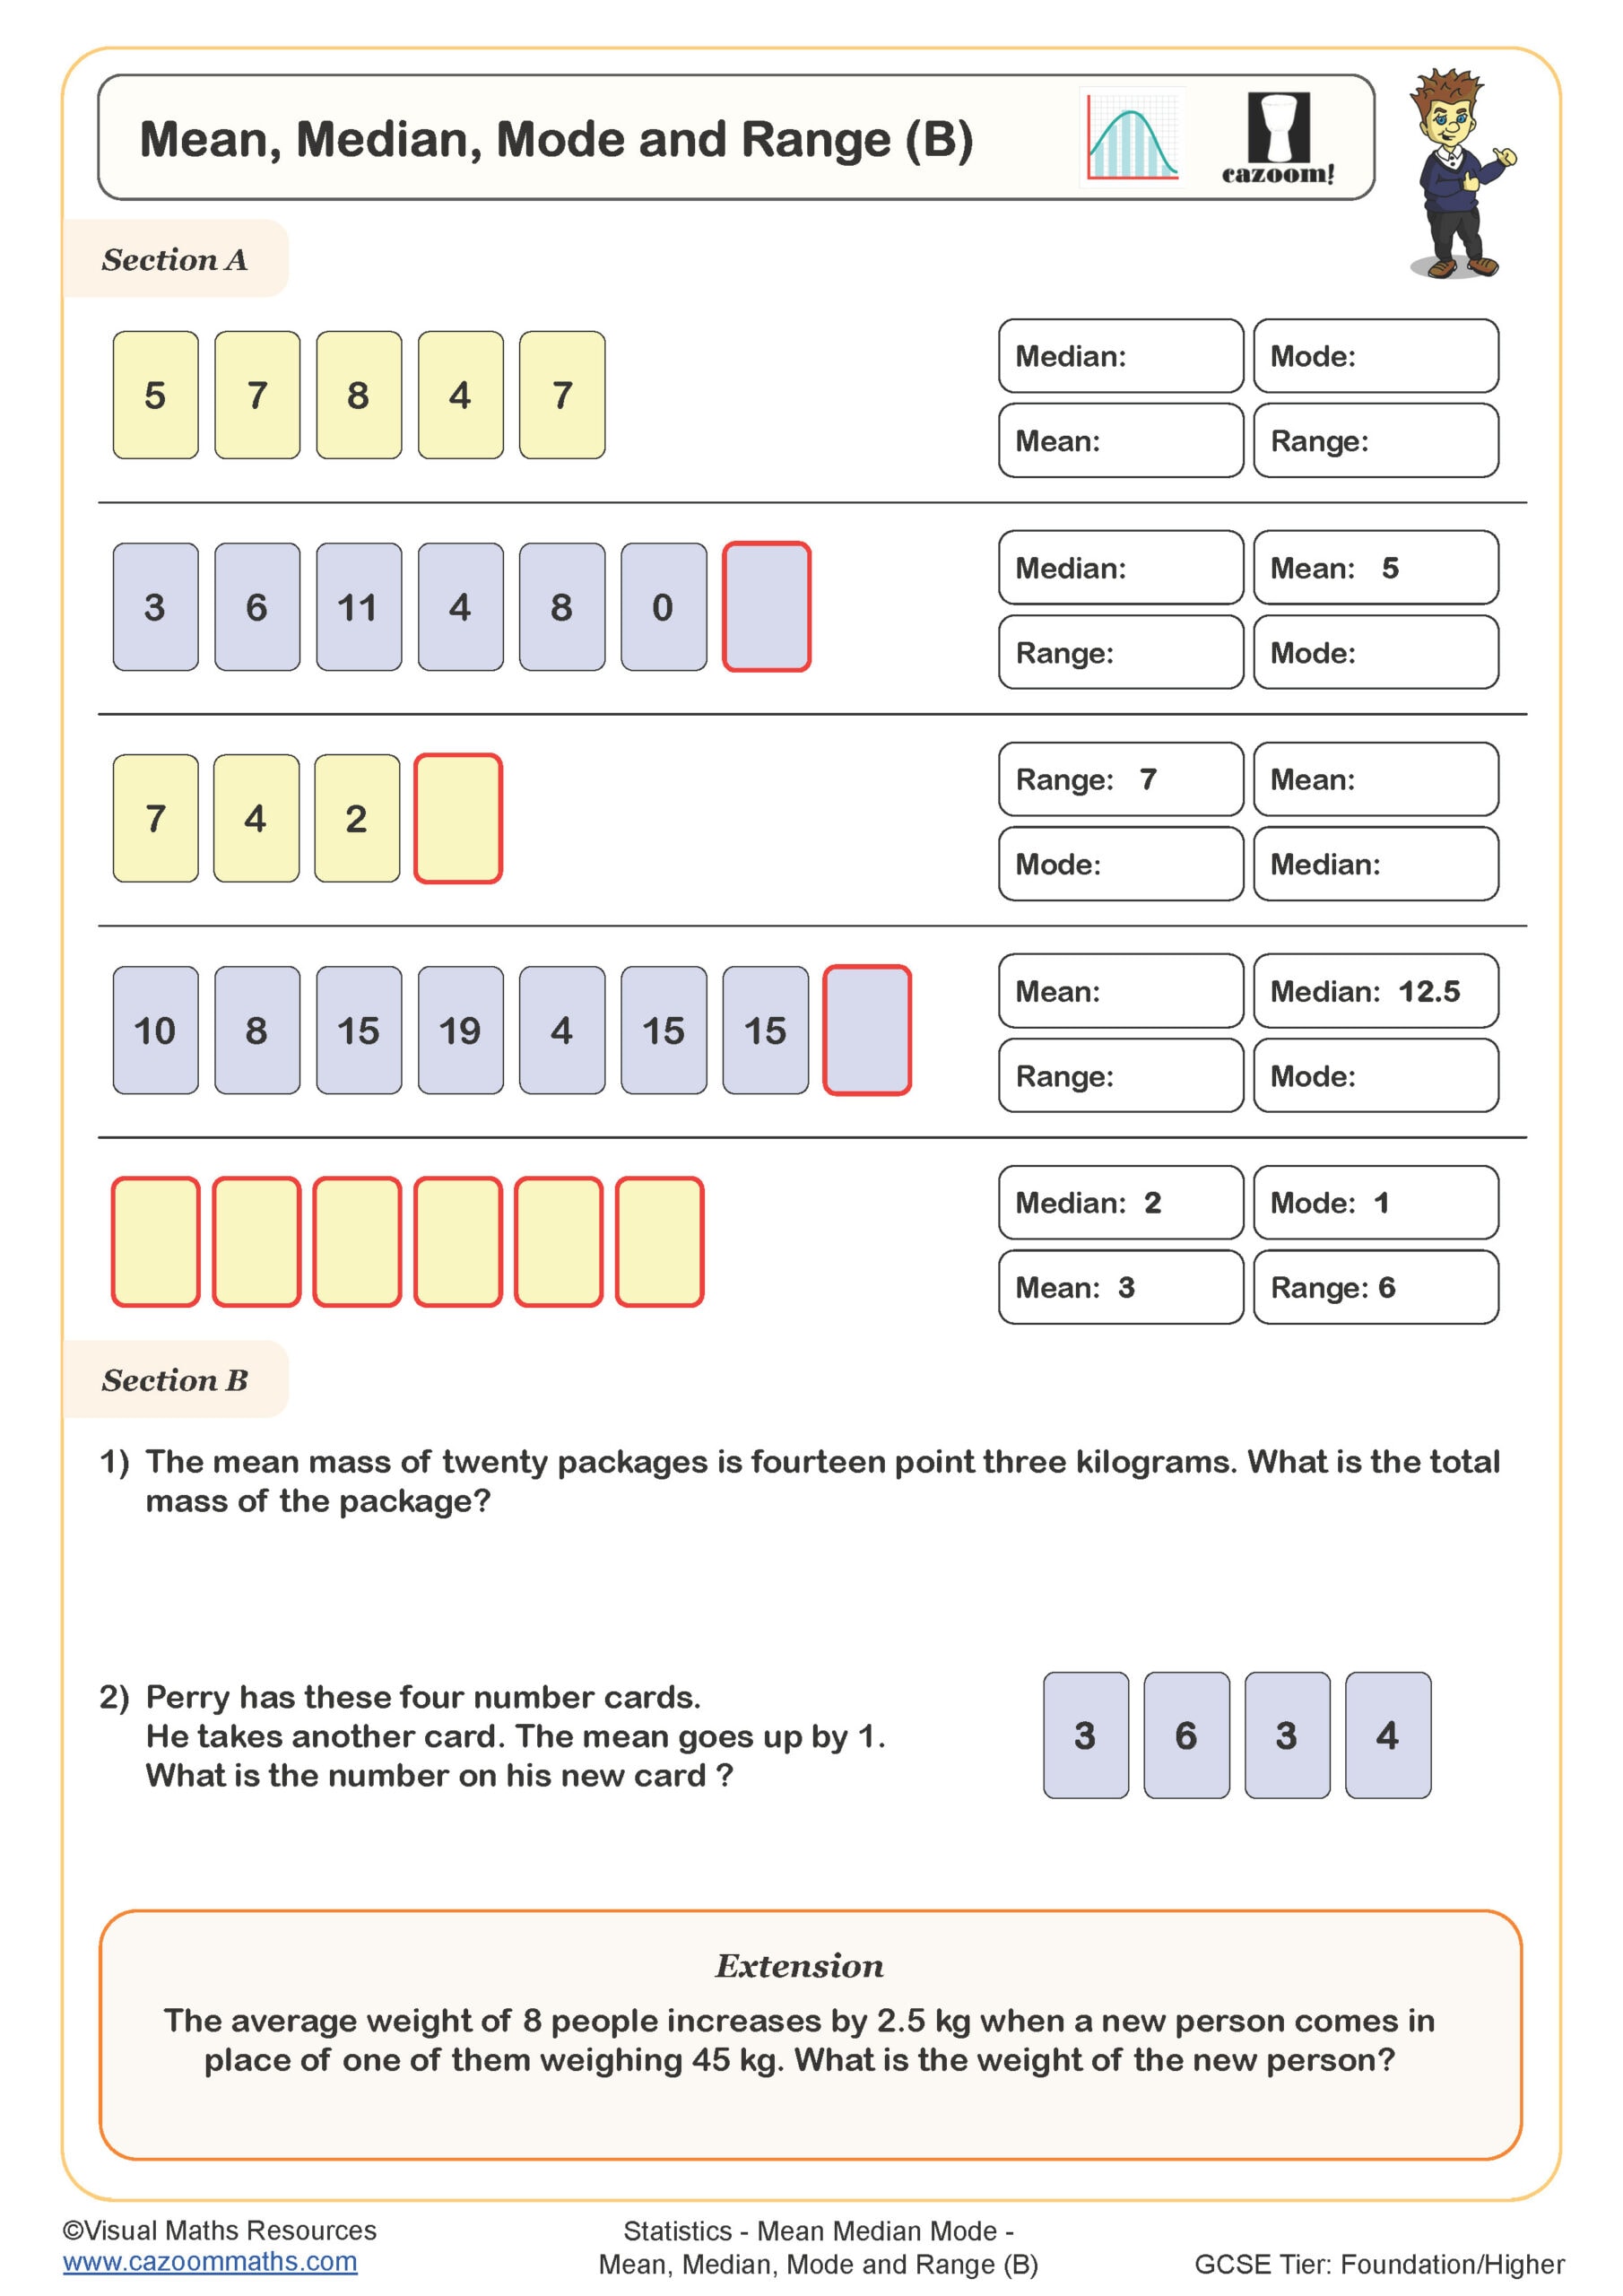
Mean, Median, Mode and Range (B)
Year groups: 7, 8
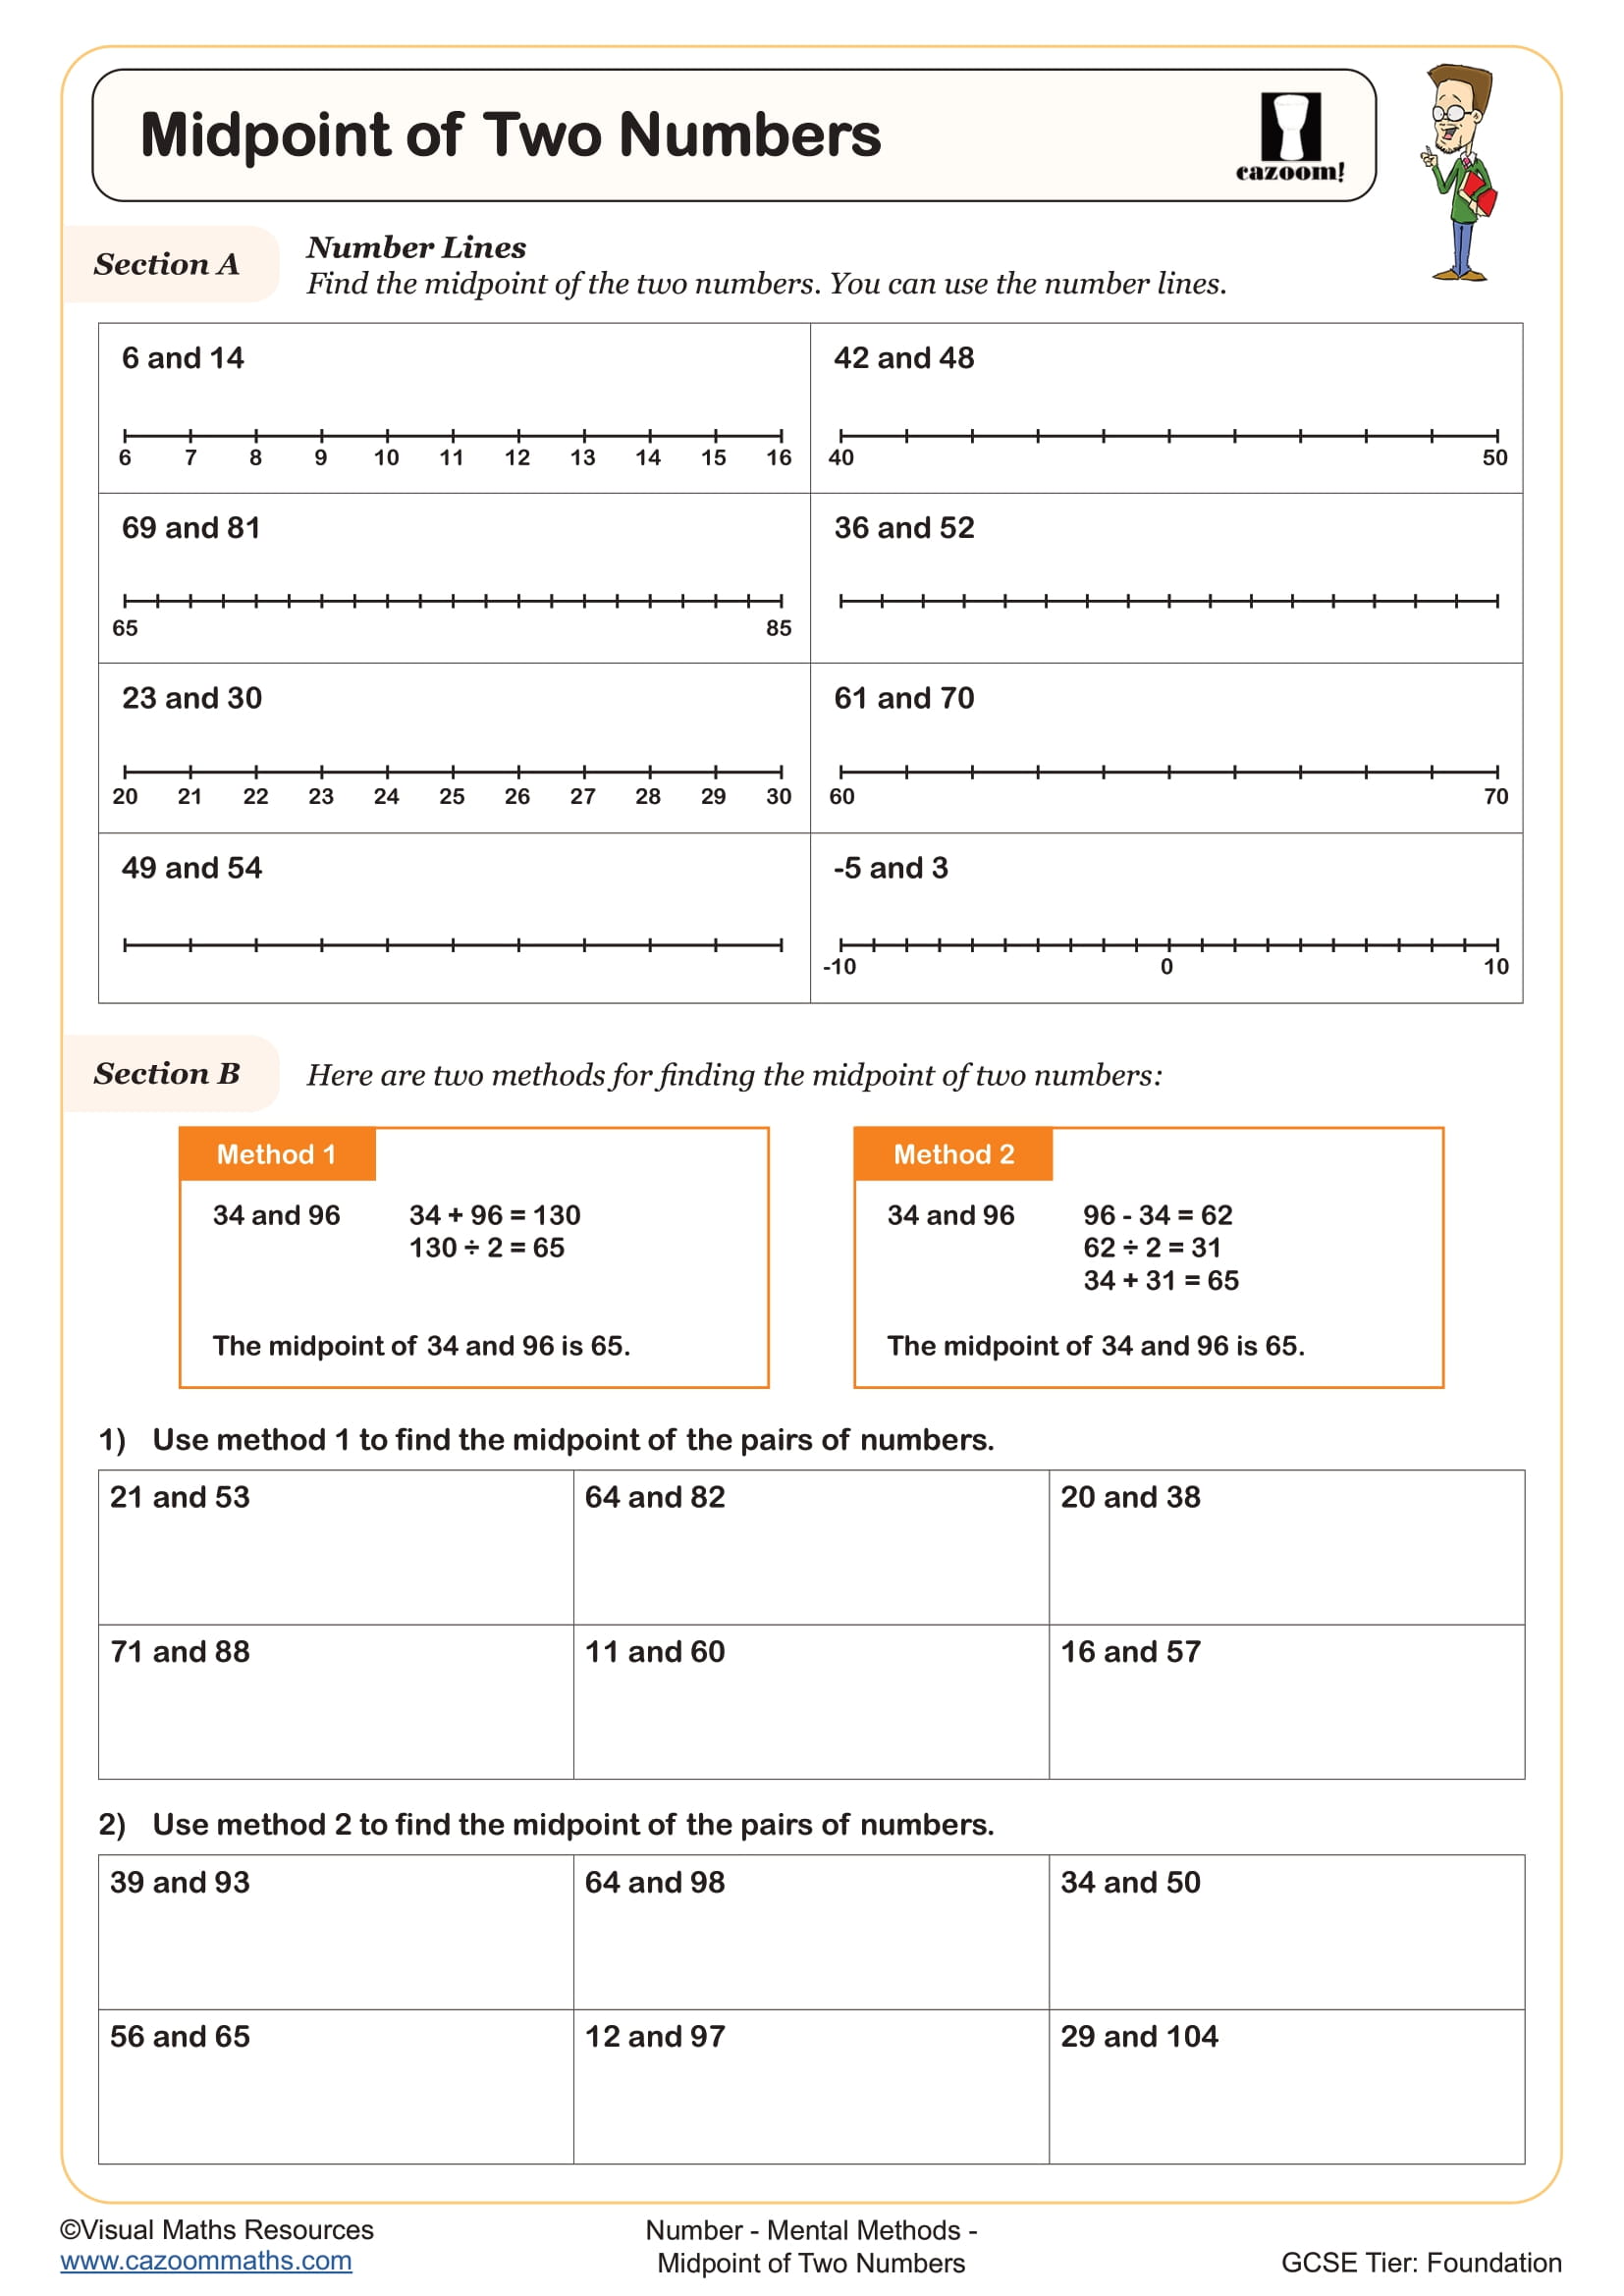
Midpoint of Two Numbers
Year groups: 7
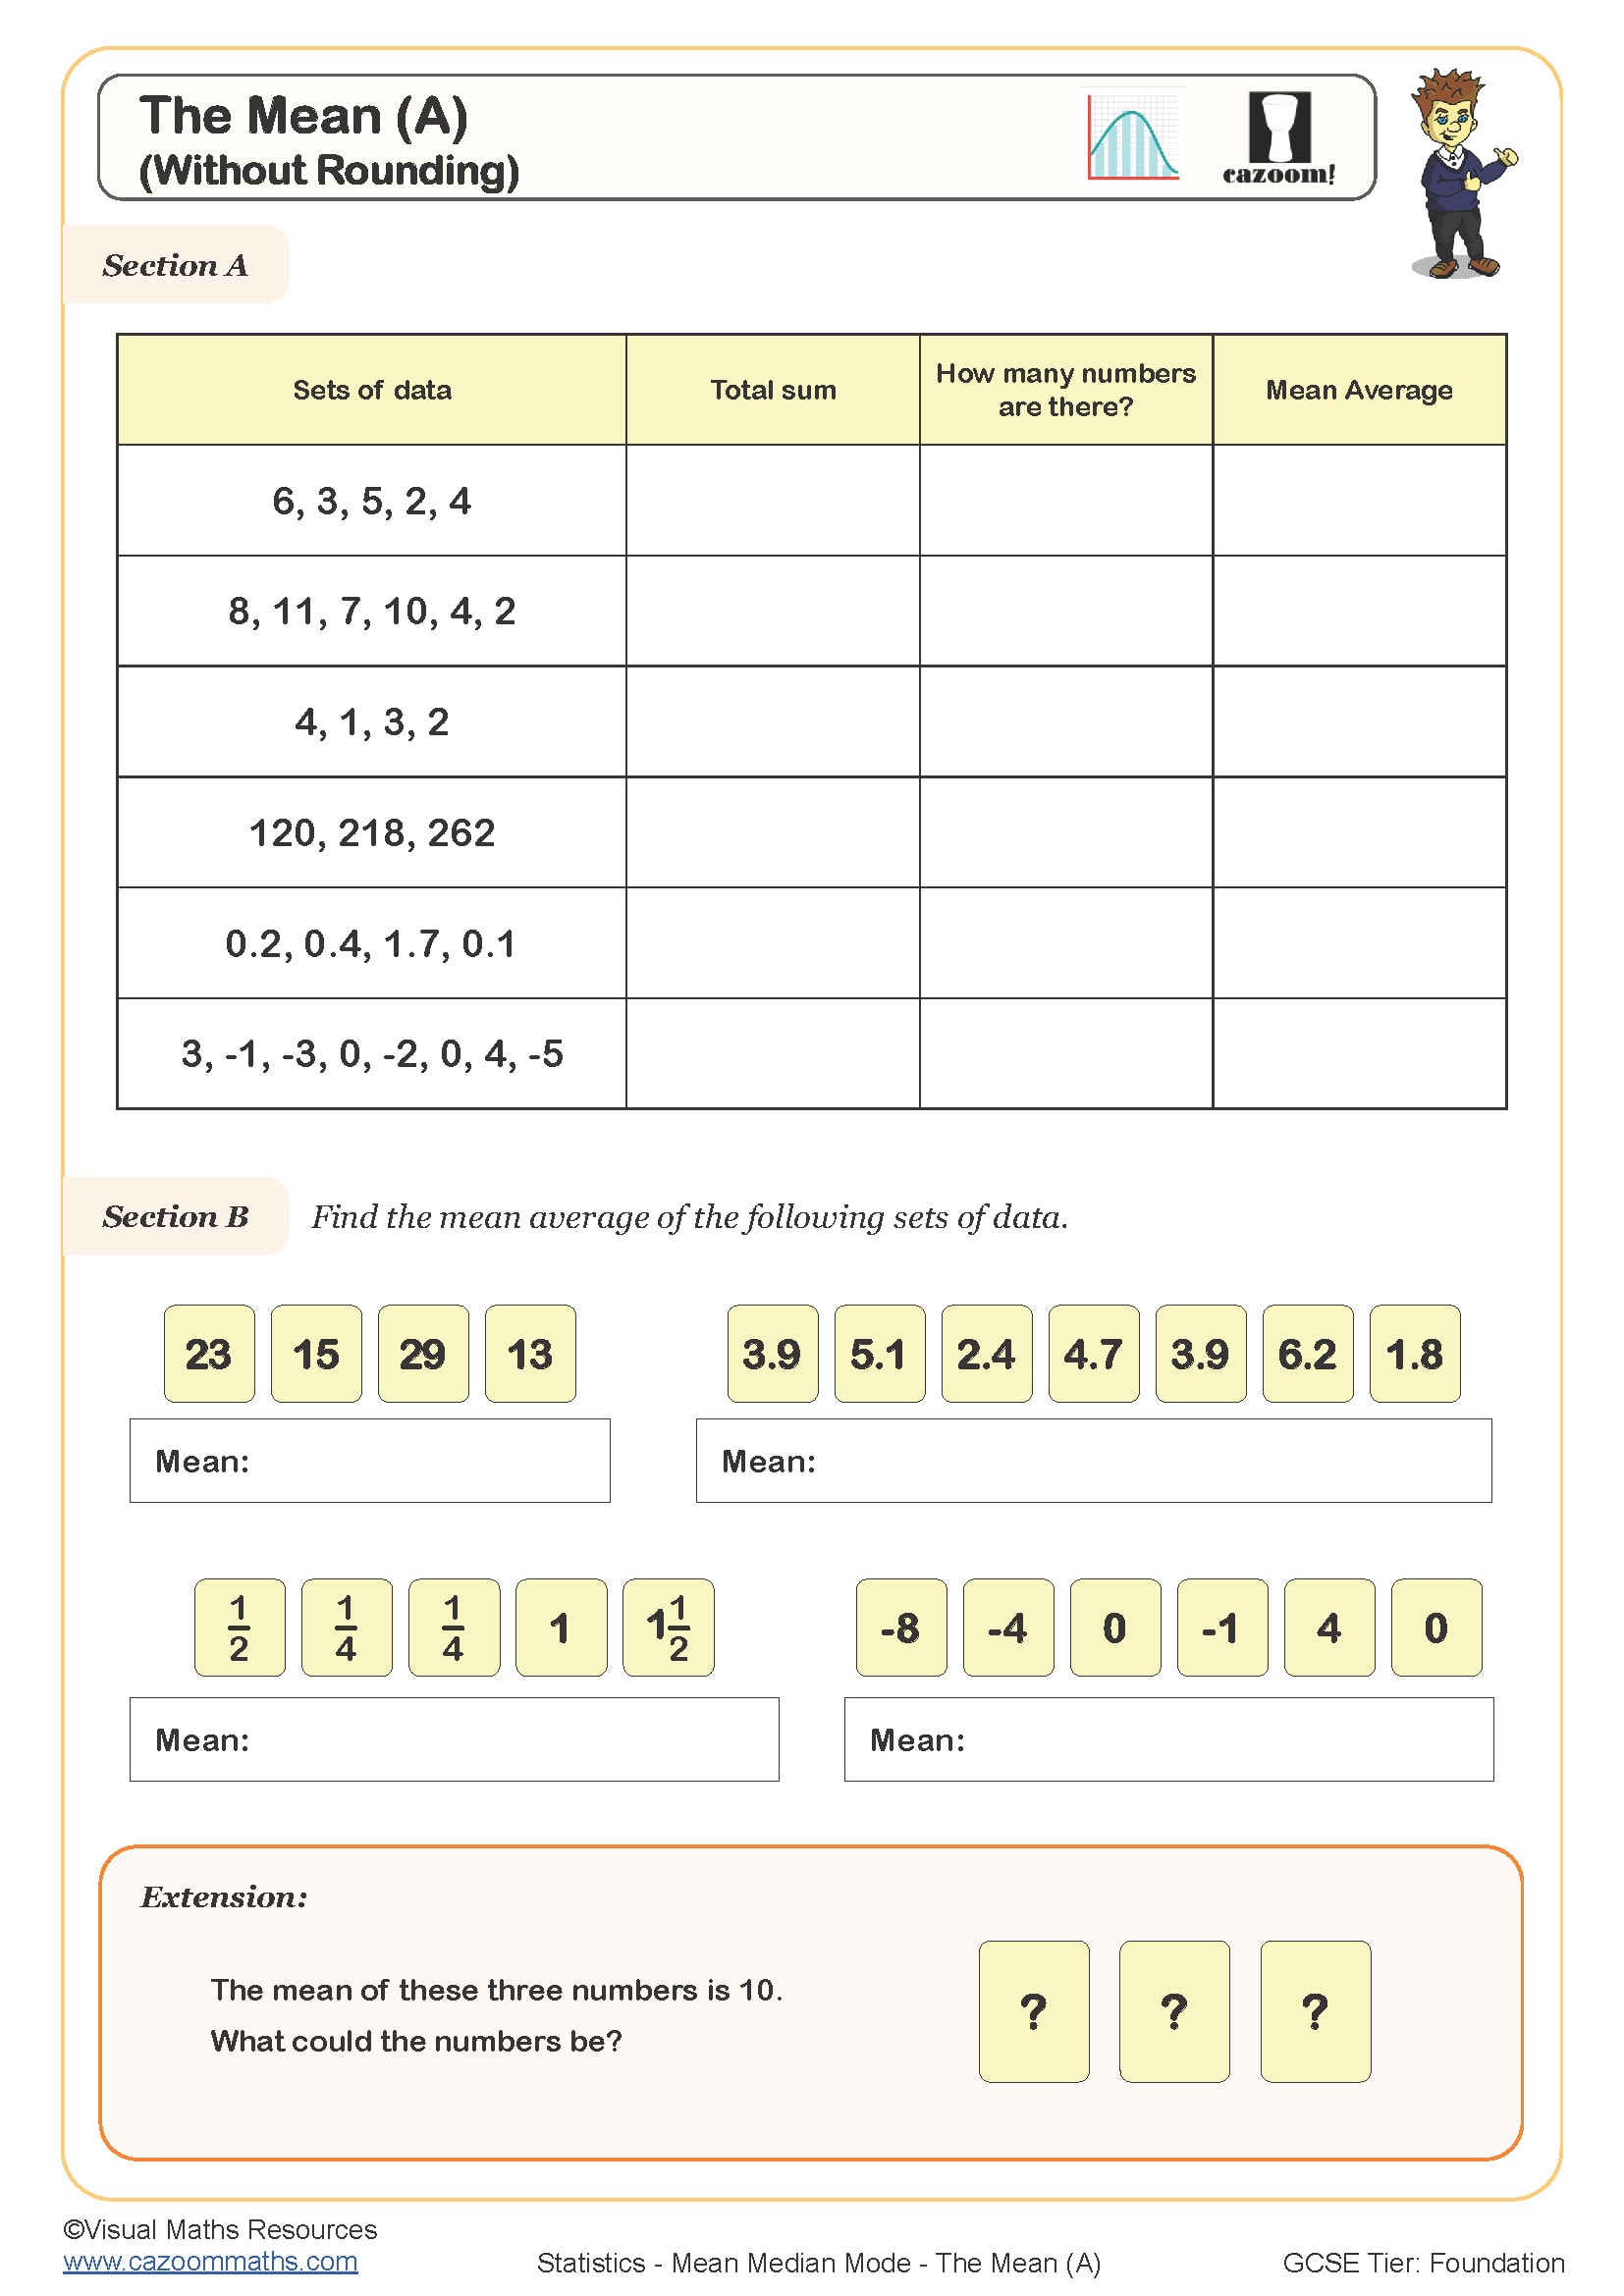
The Mean (A)
Year groups: 7, 8
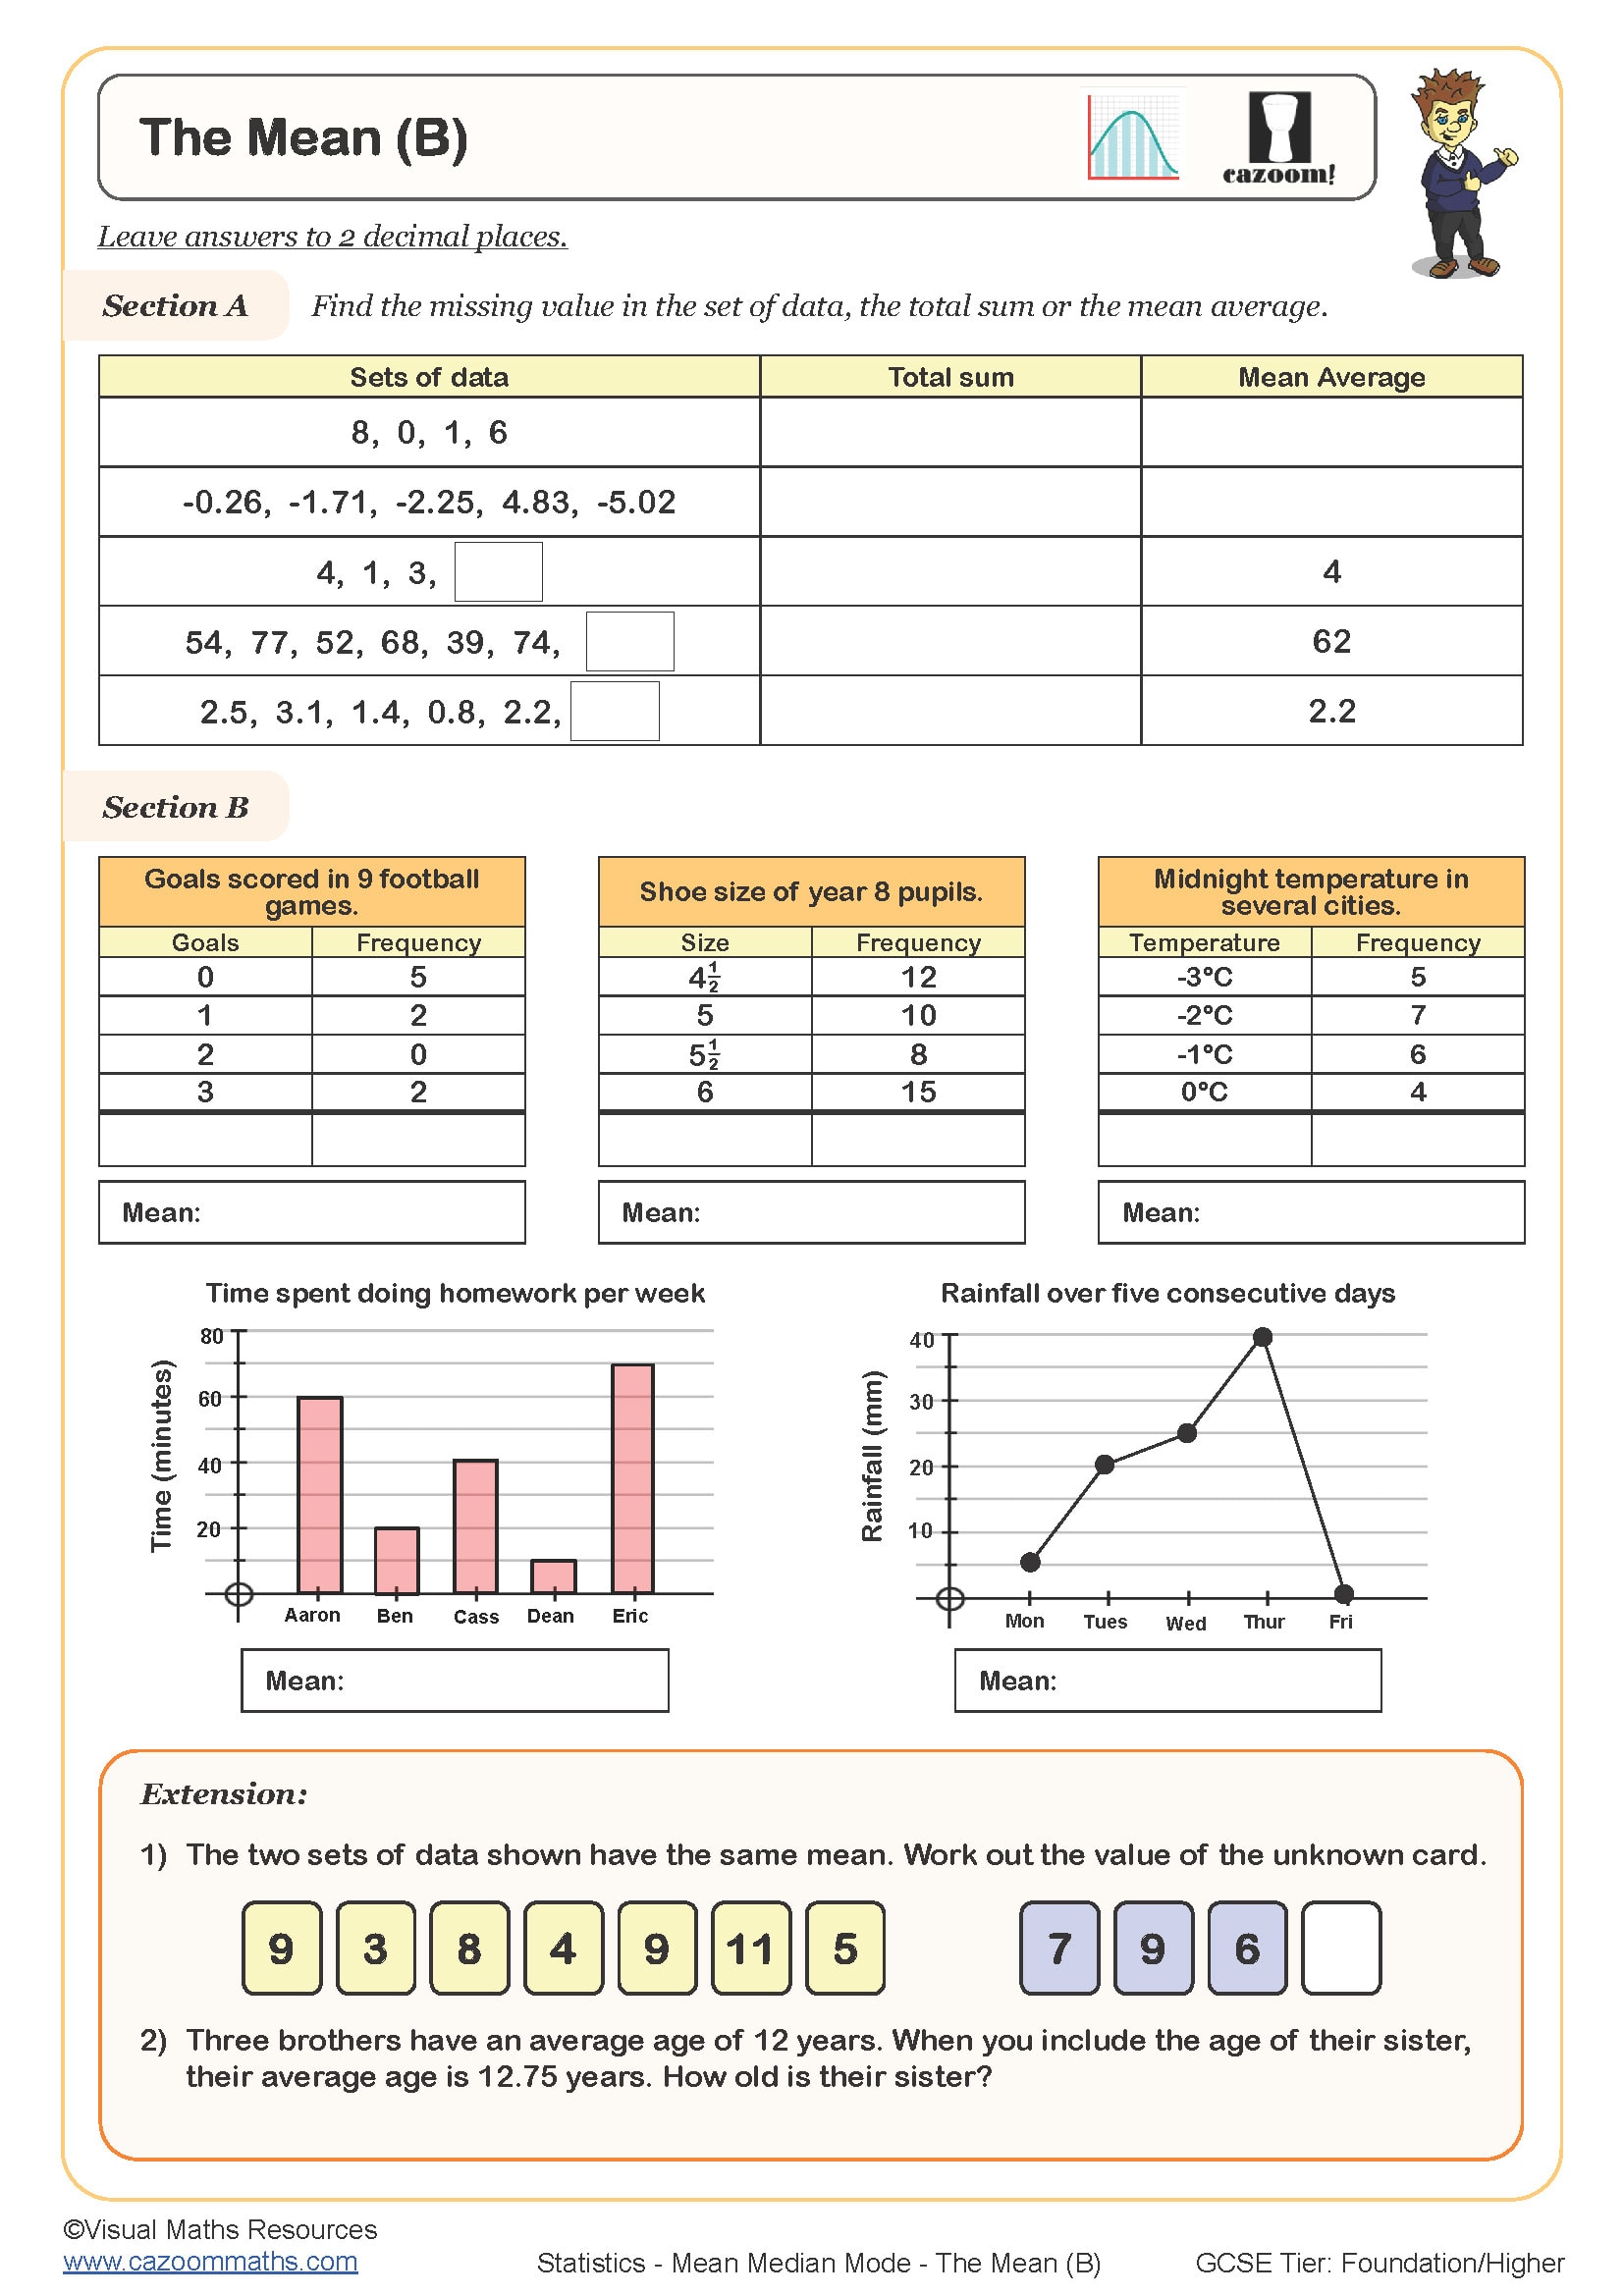
The Mean (B)
Year groups: 7, 8
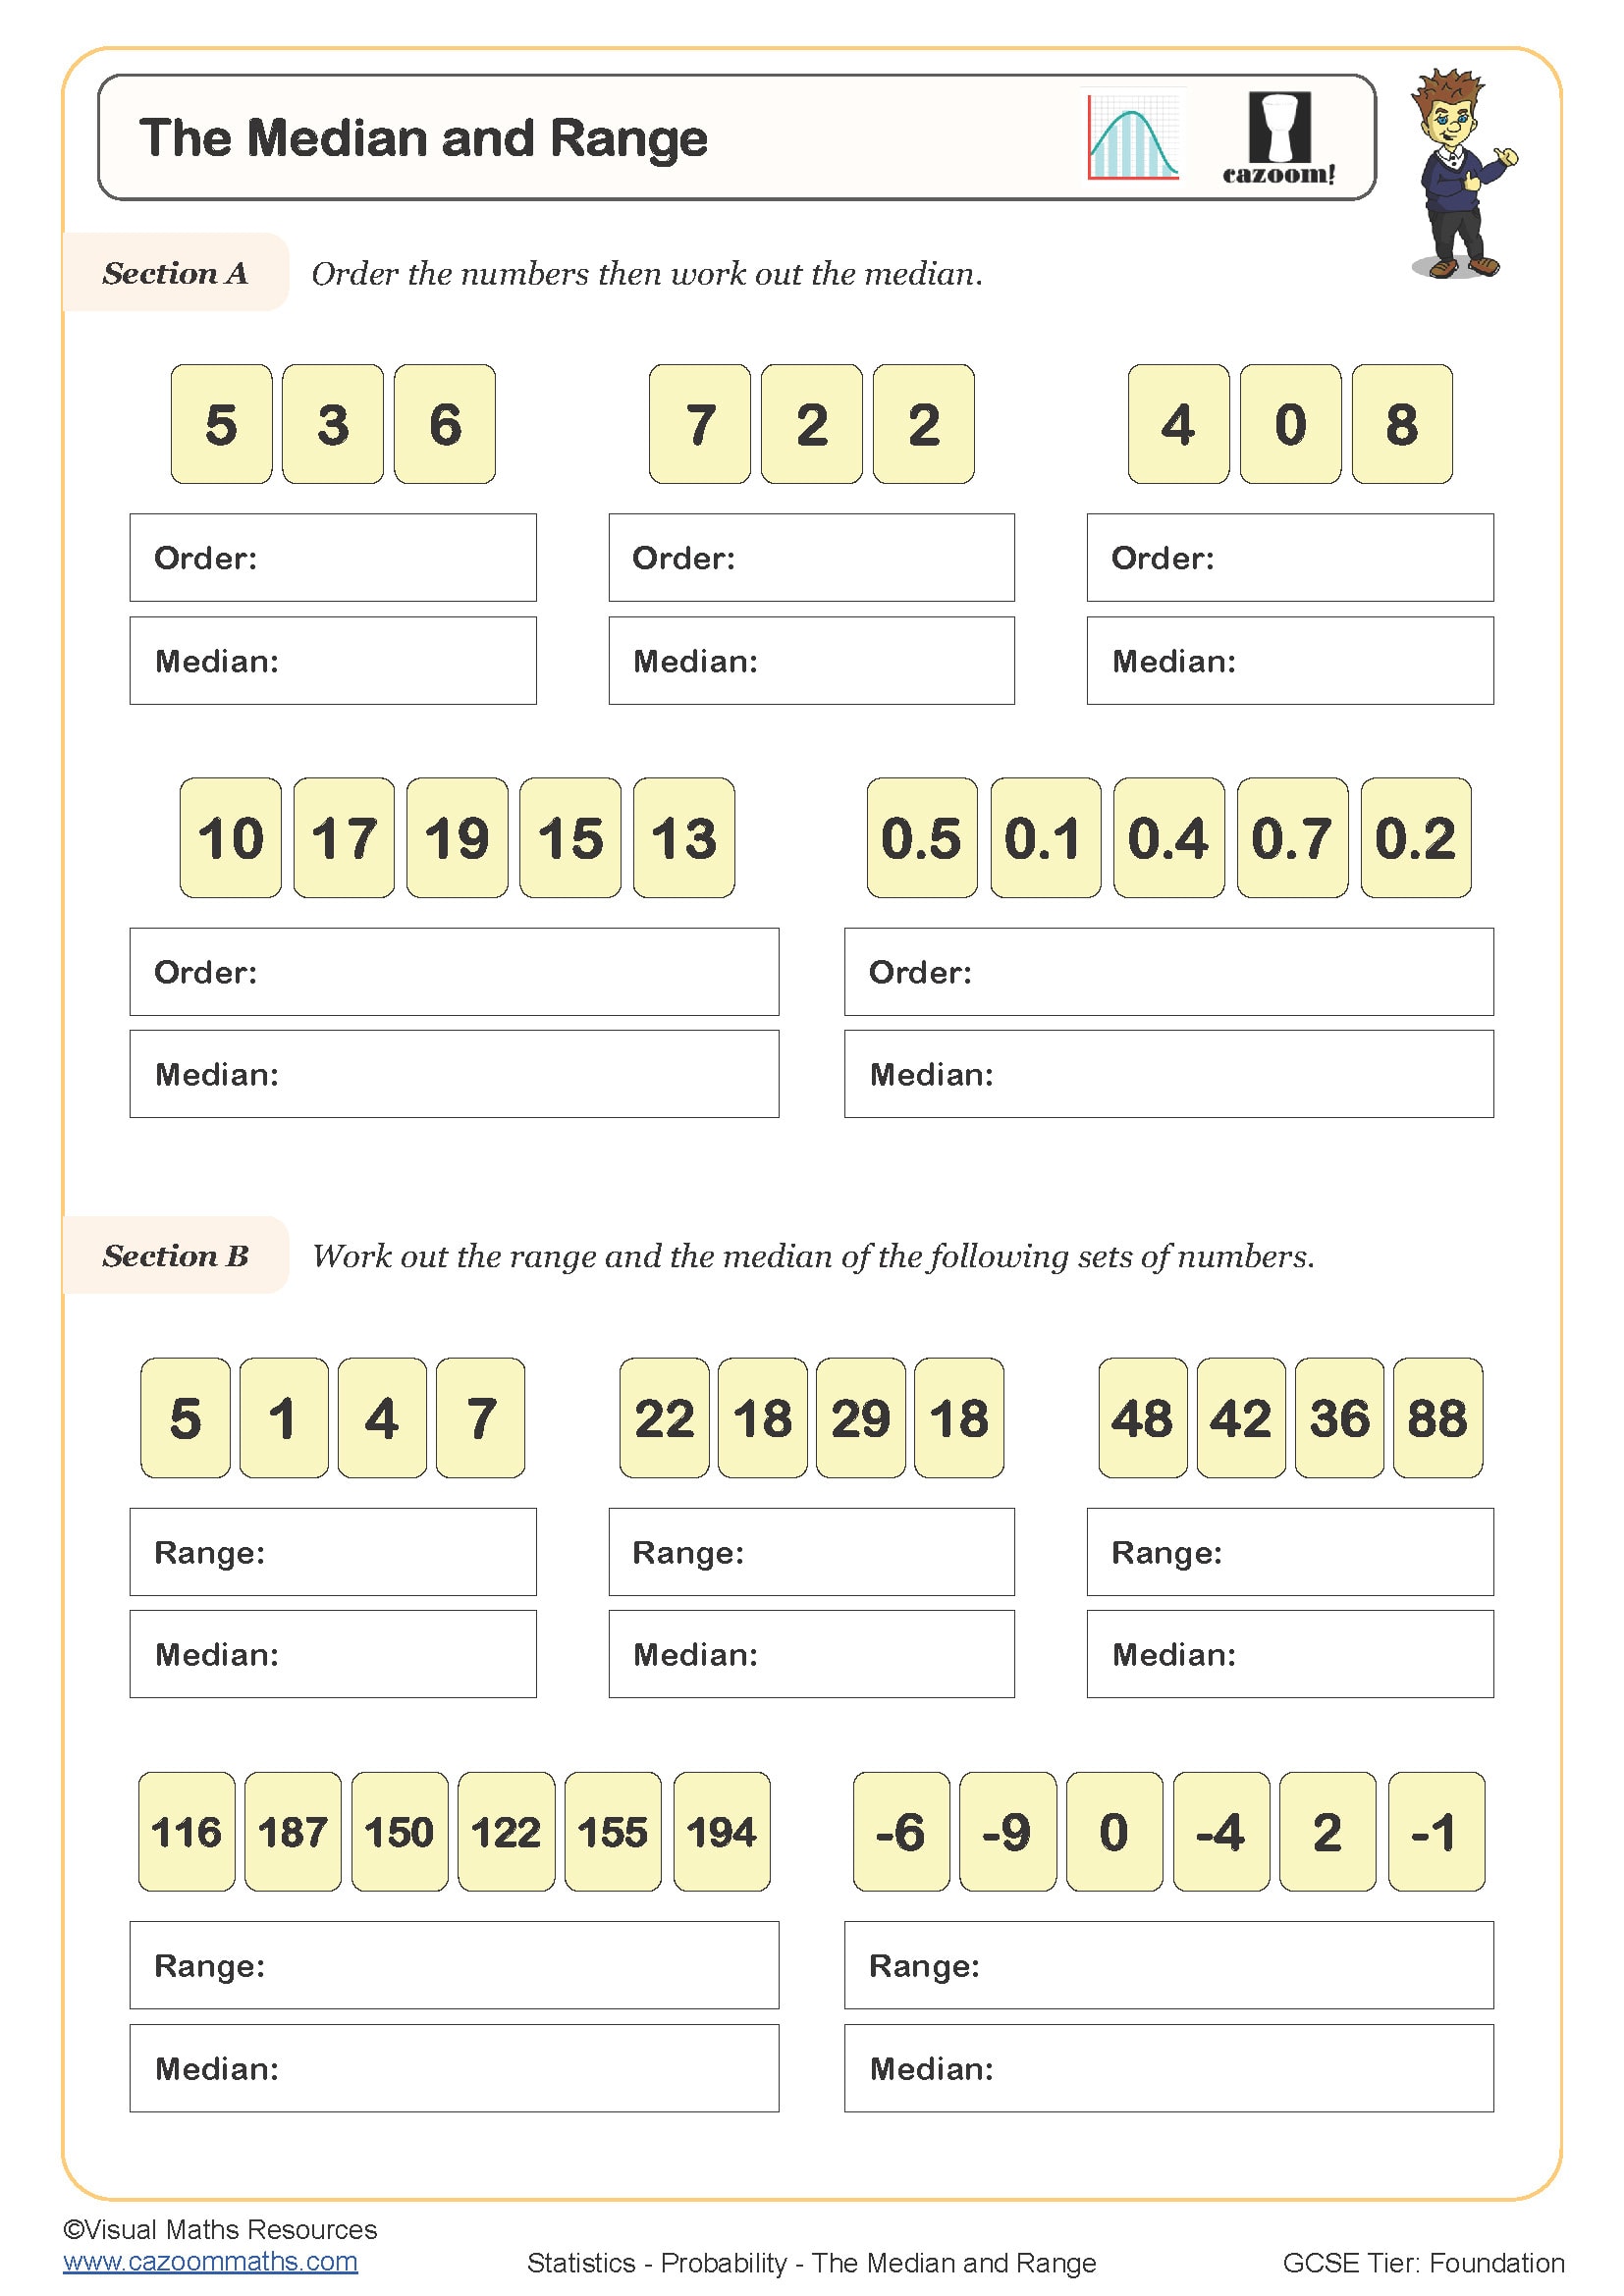
The Median and Range
Year groups: 7, 8
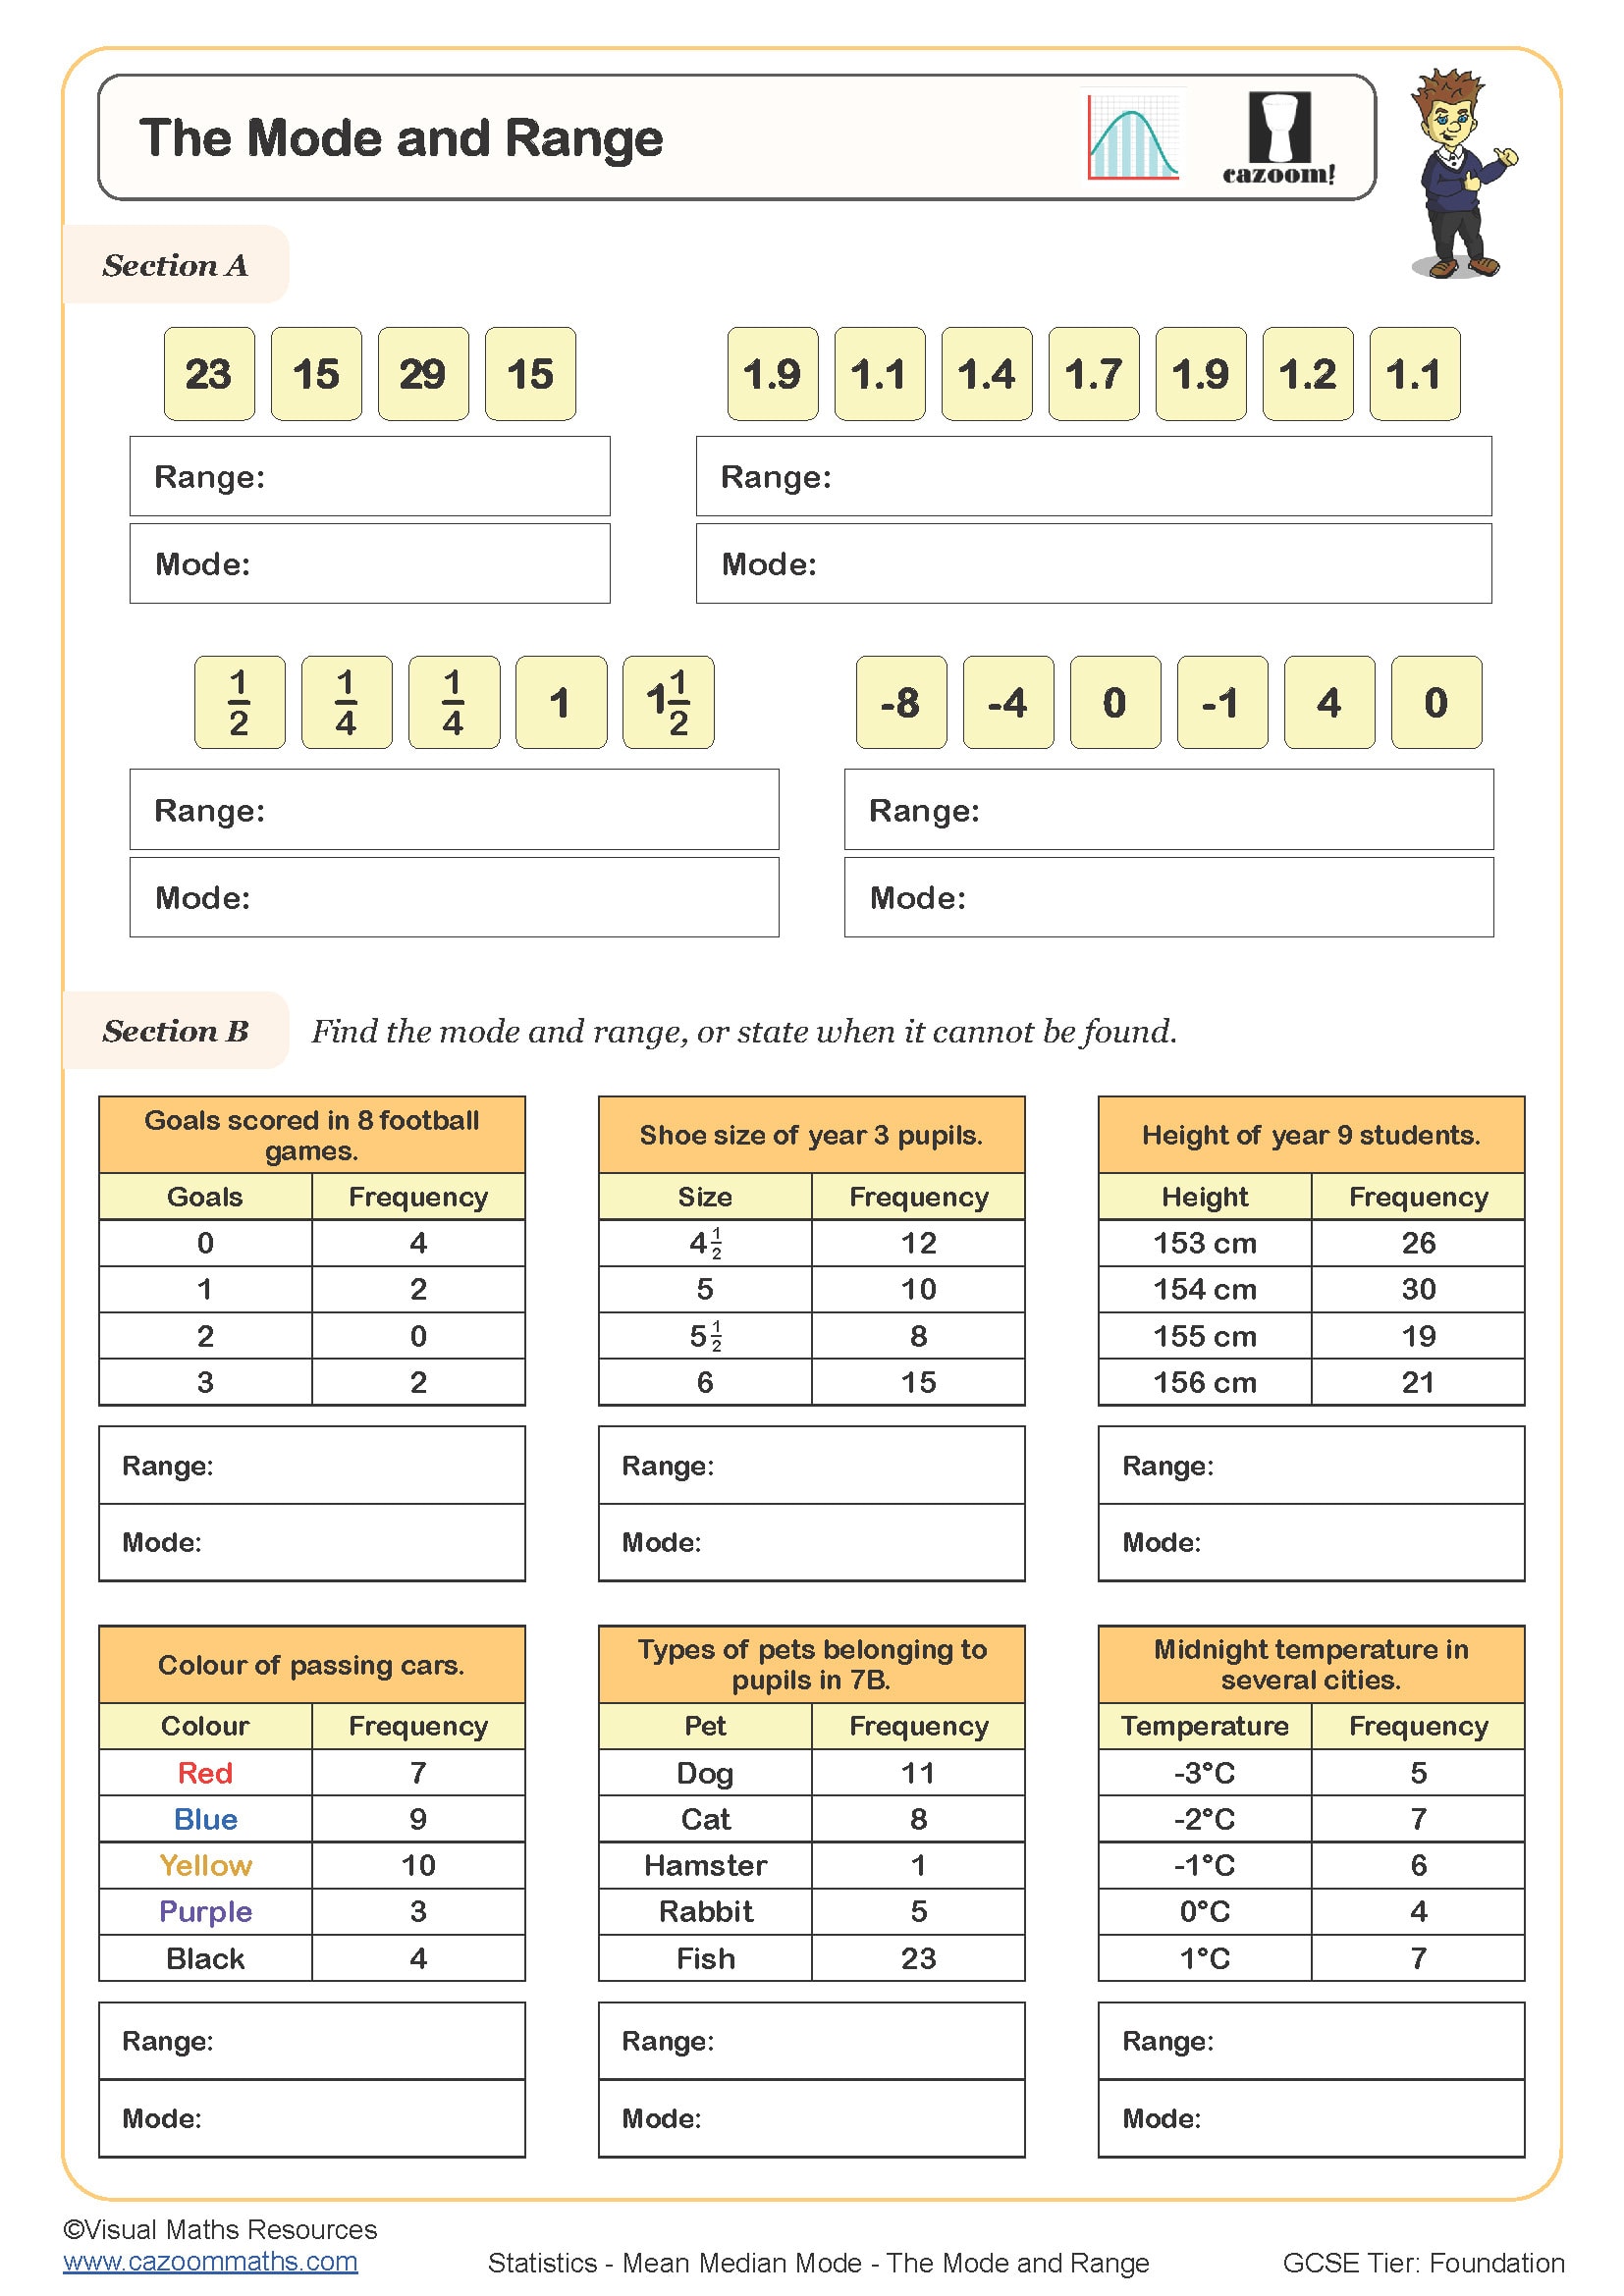
The Mode and Range
Year groups: 7, 8
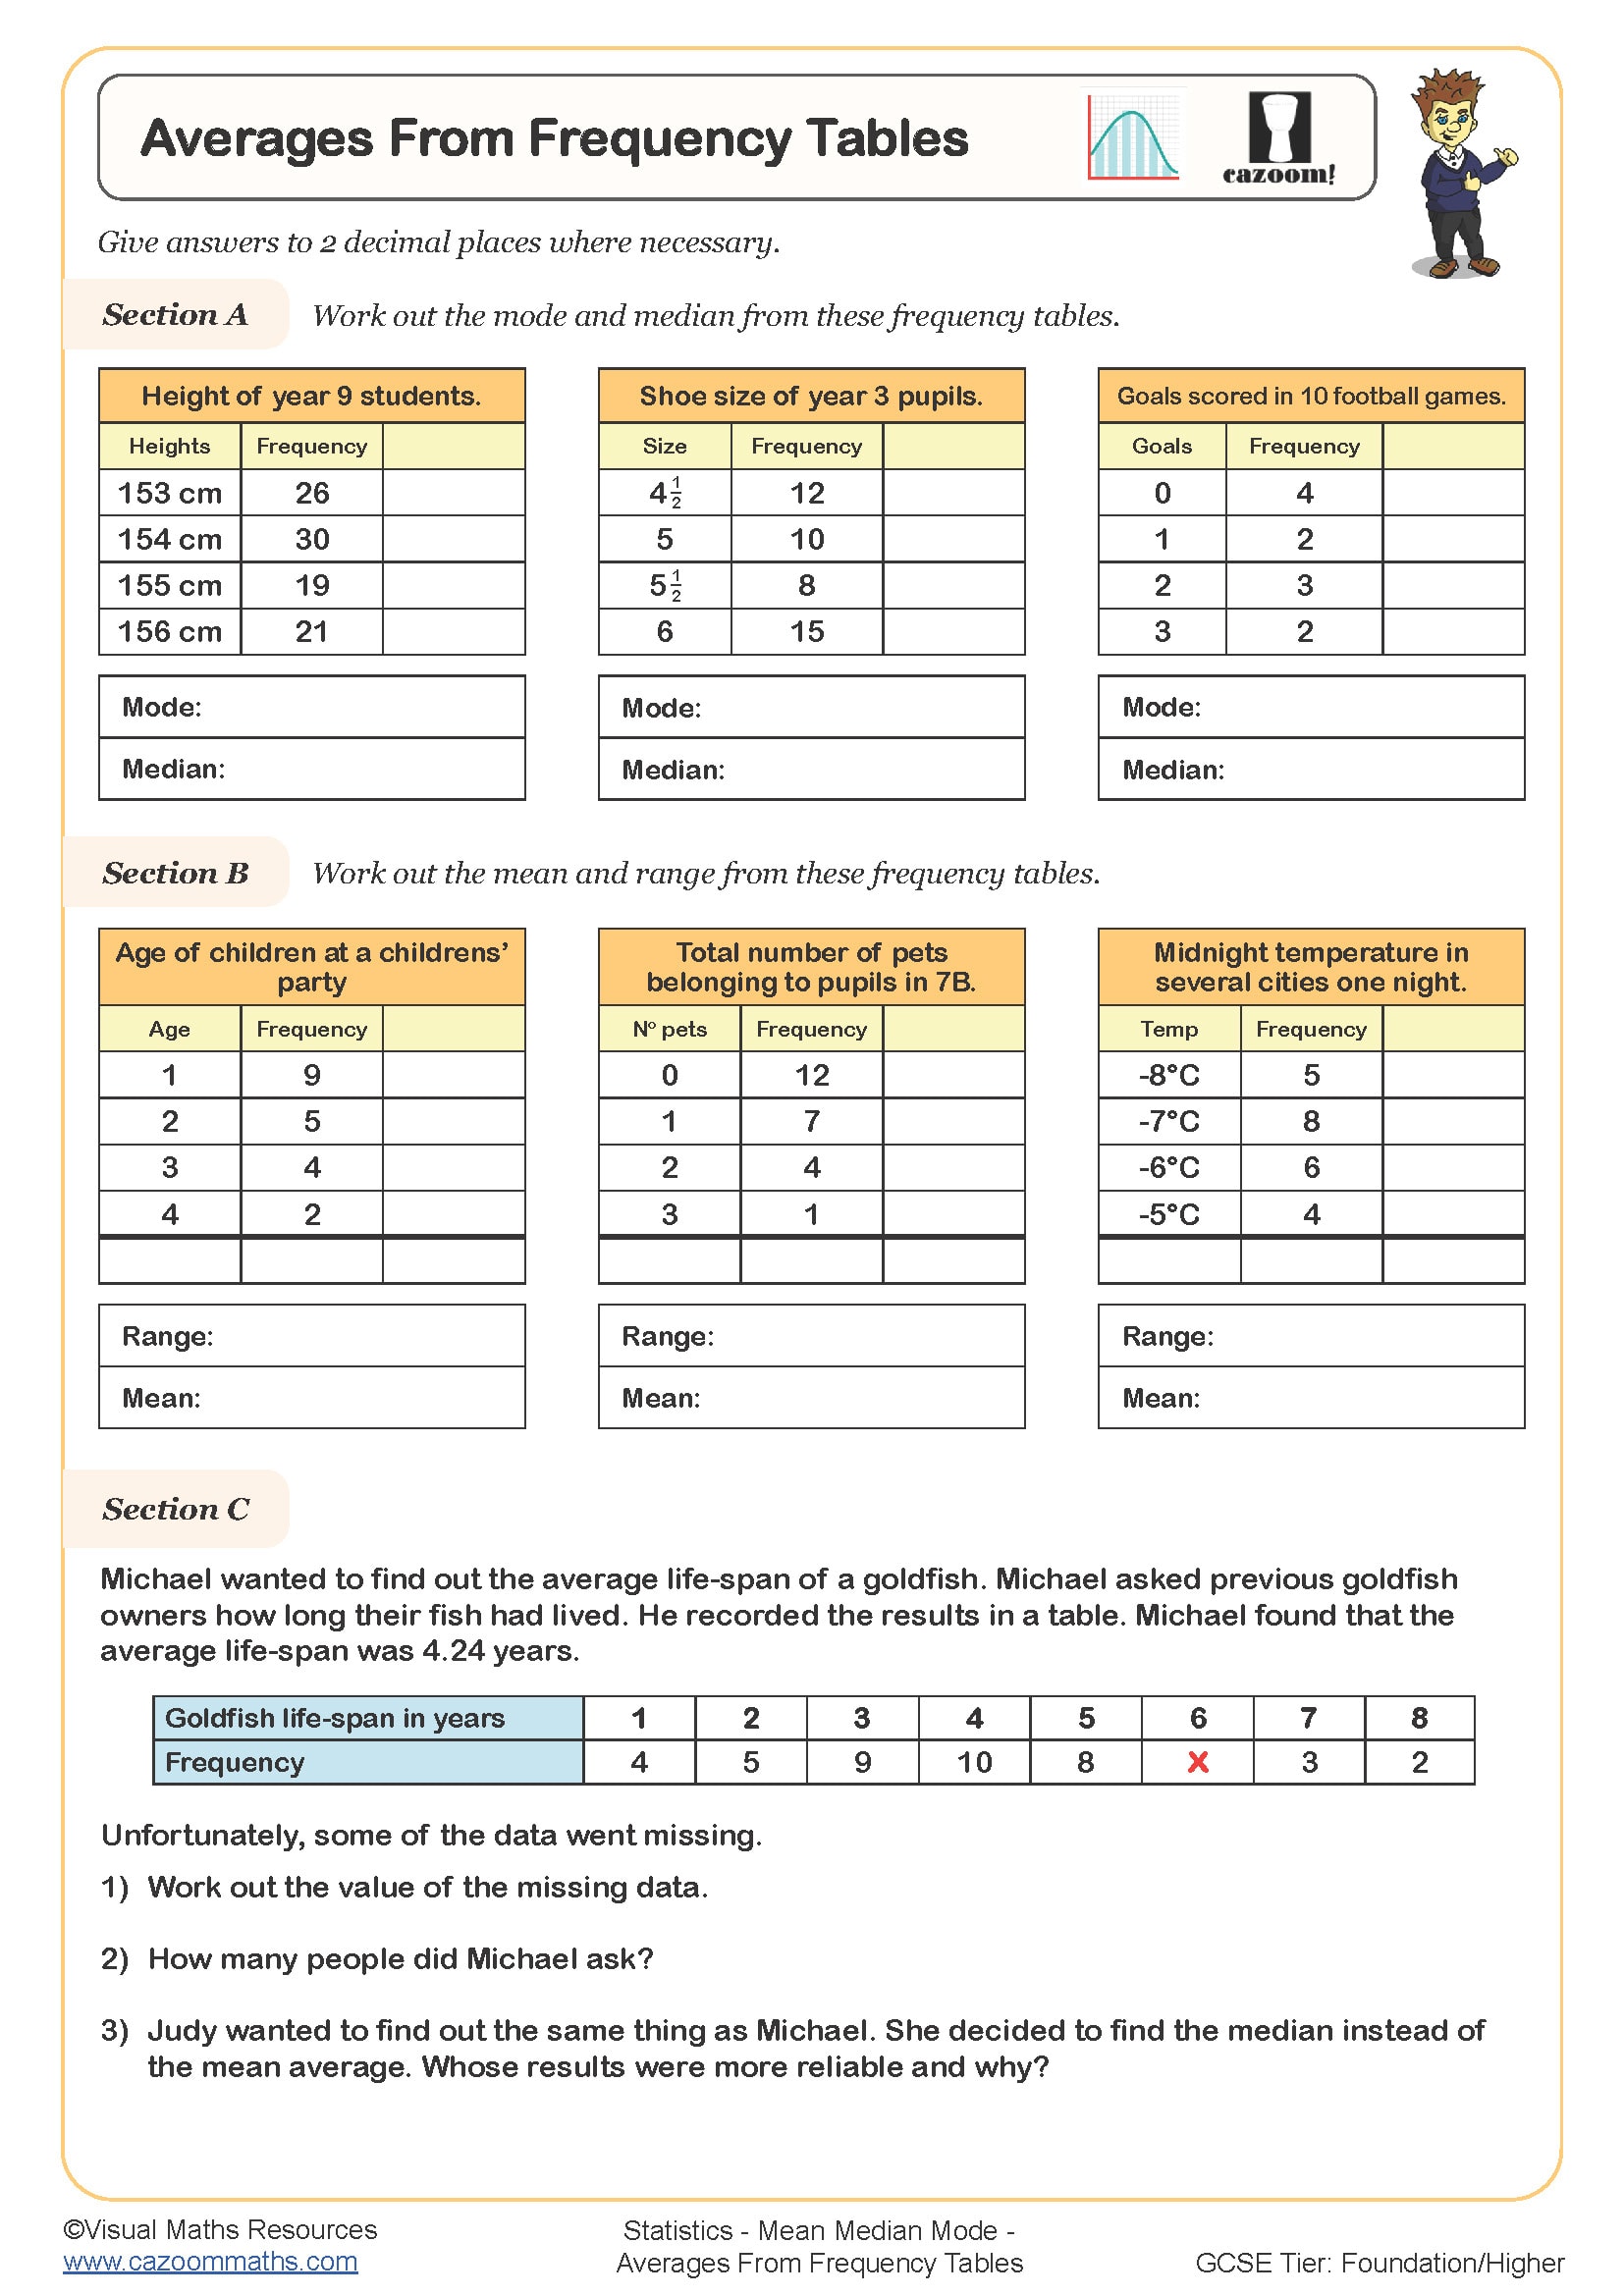
Averages from Frequency Tables
Year groups: 8, 9
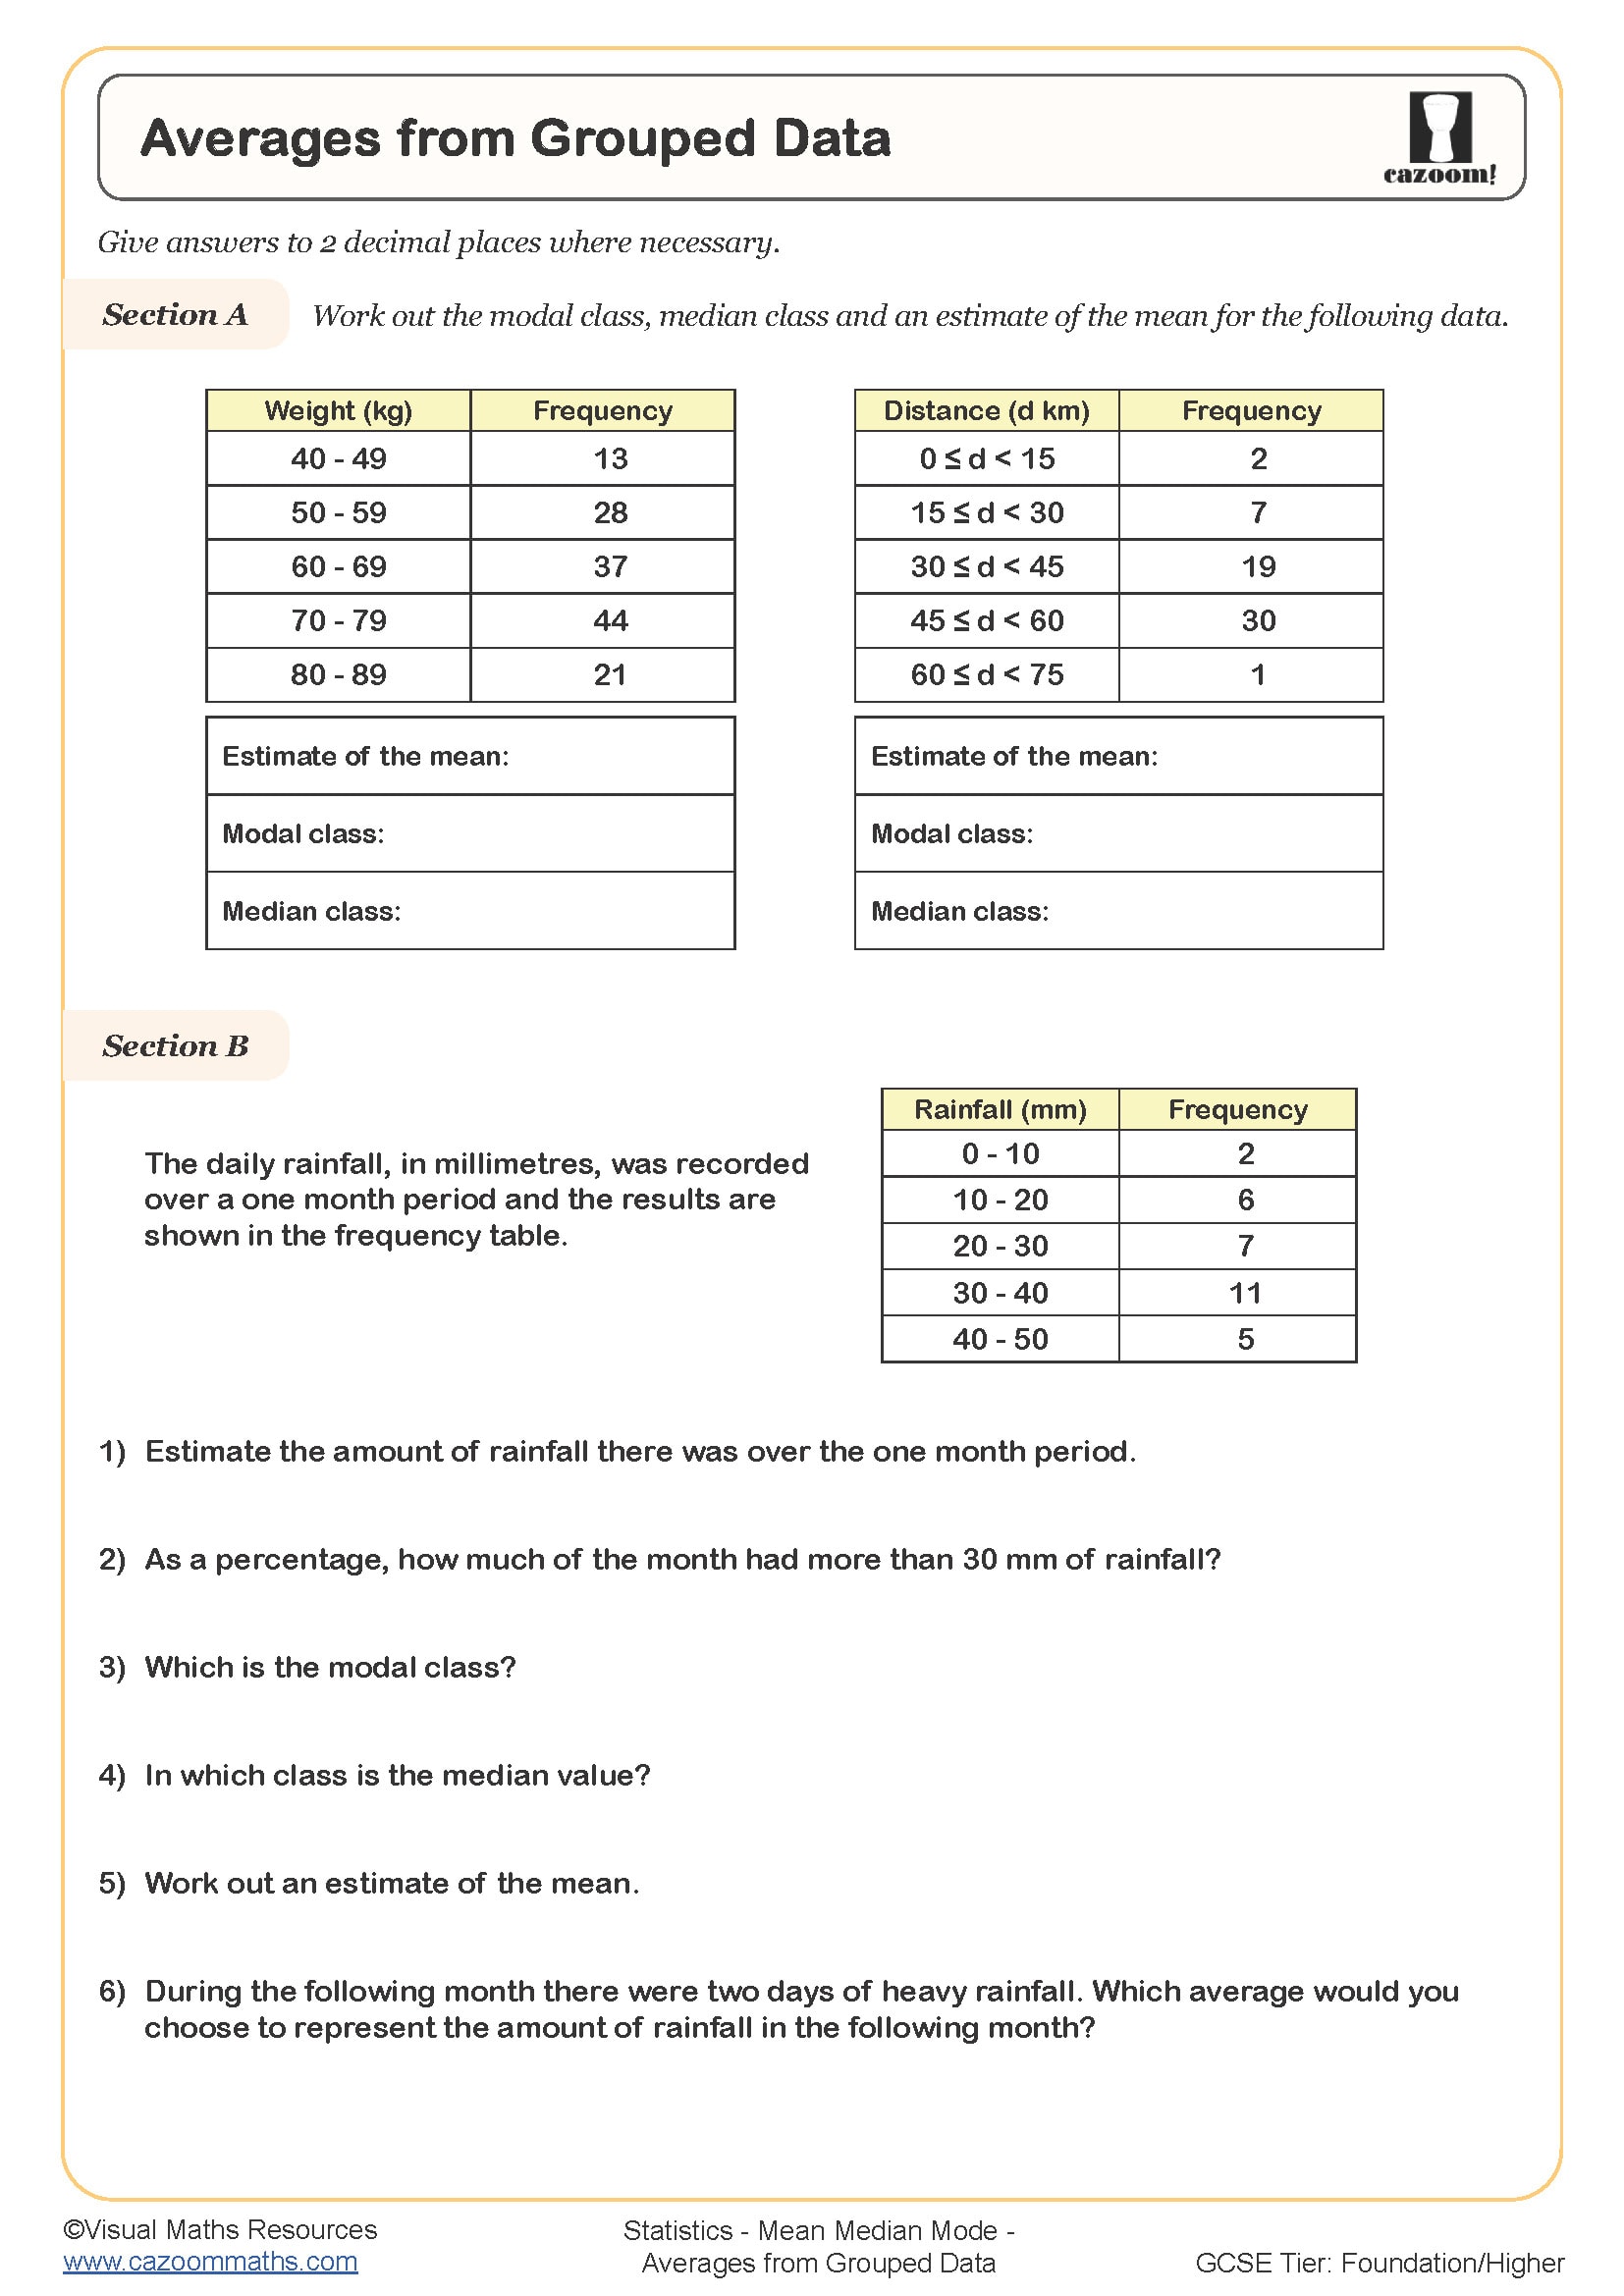
Averages from Grouped Data
Year groups: 8, 9
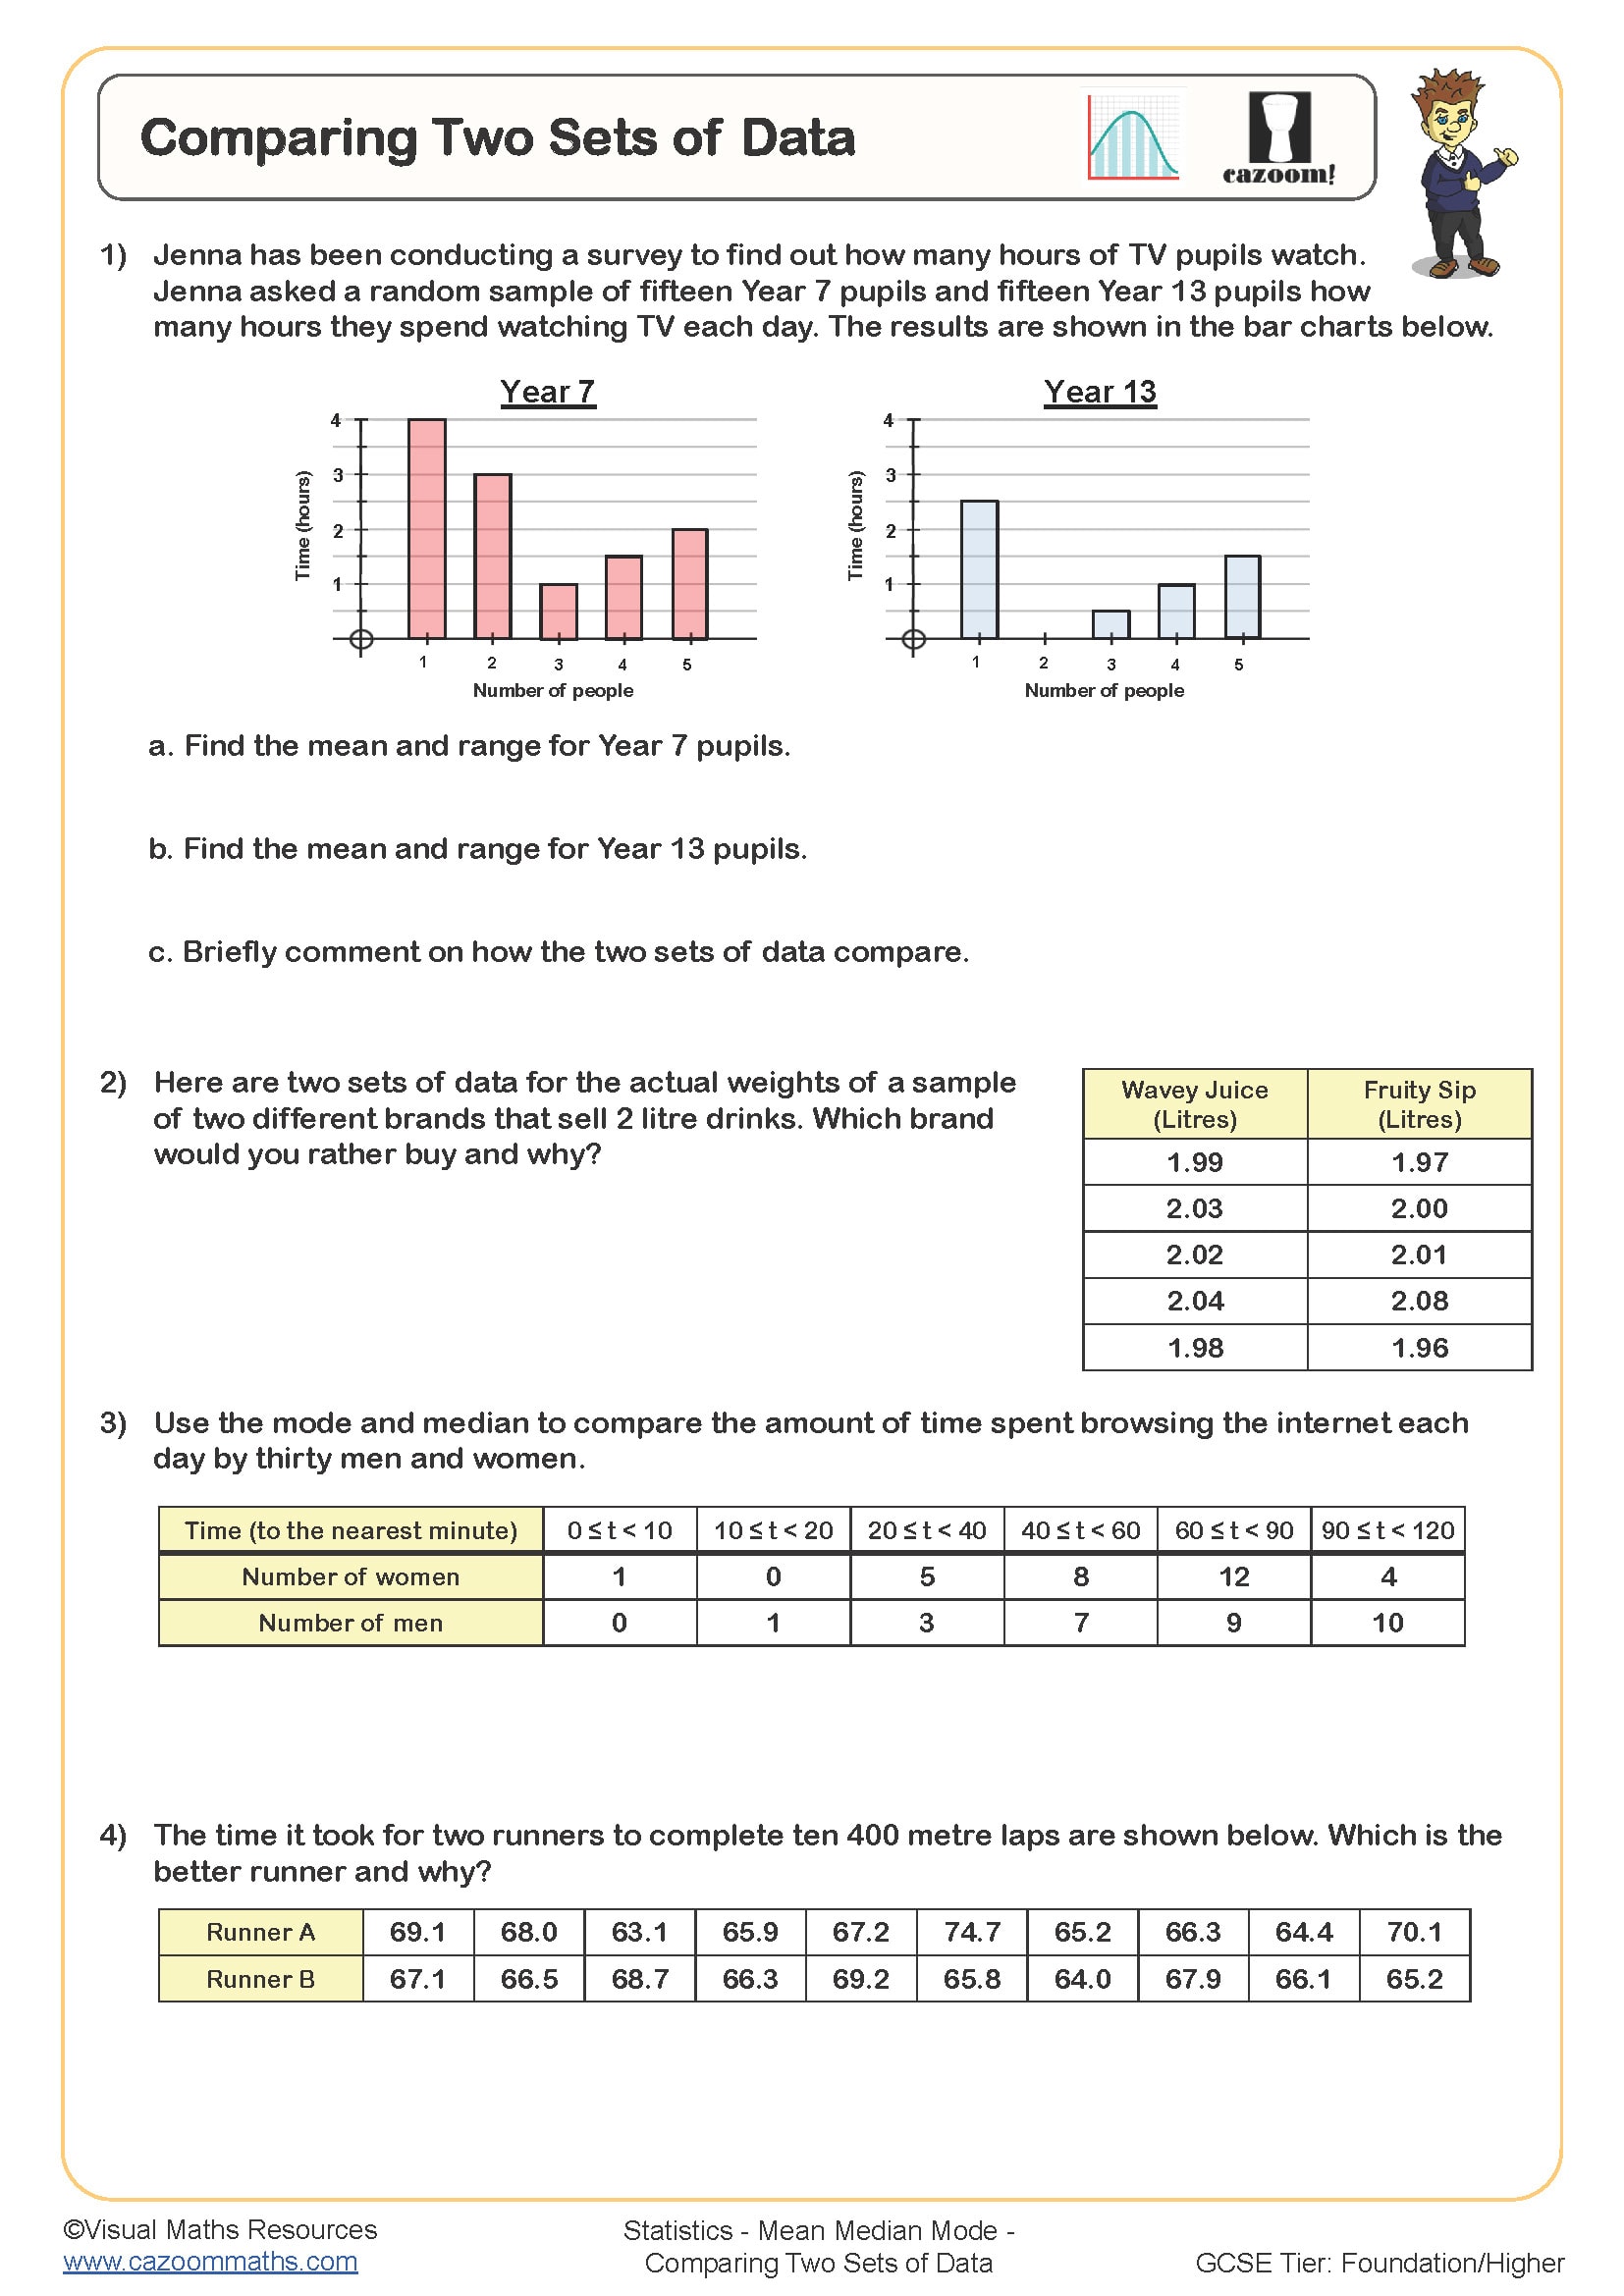
Comparing Two Sets of Data
Year groups: 8, 9
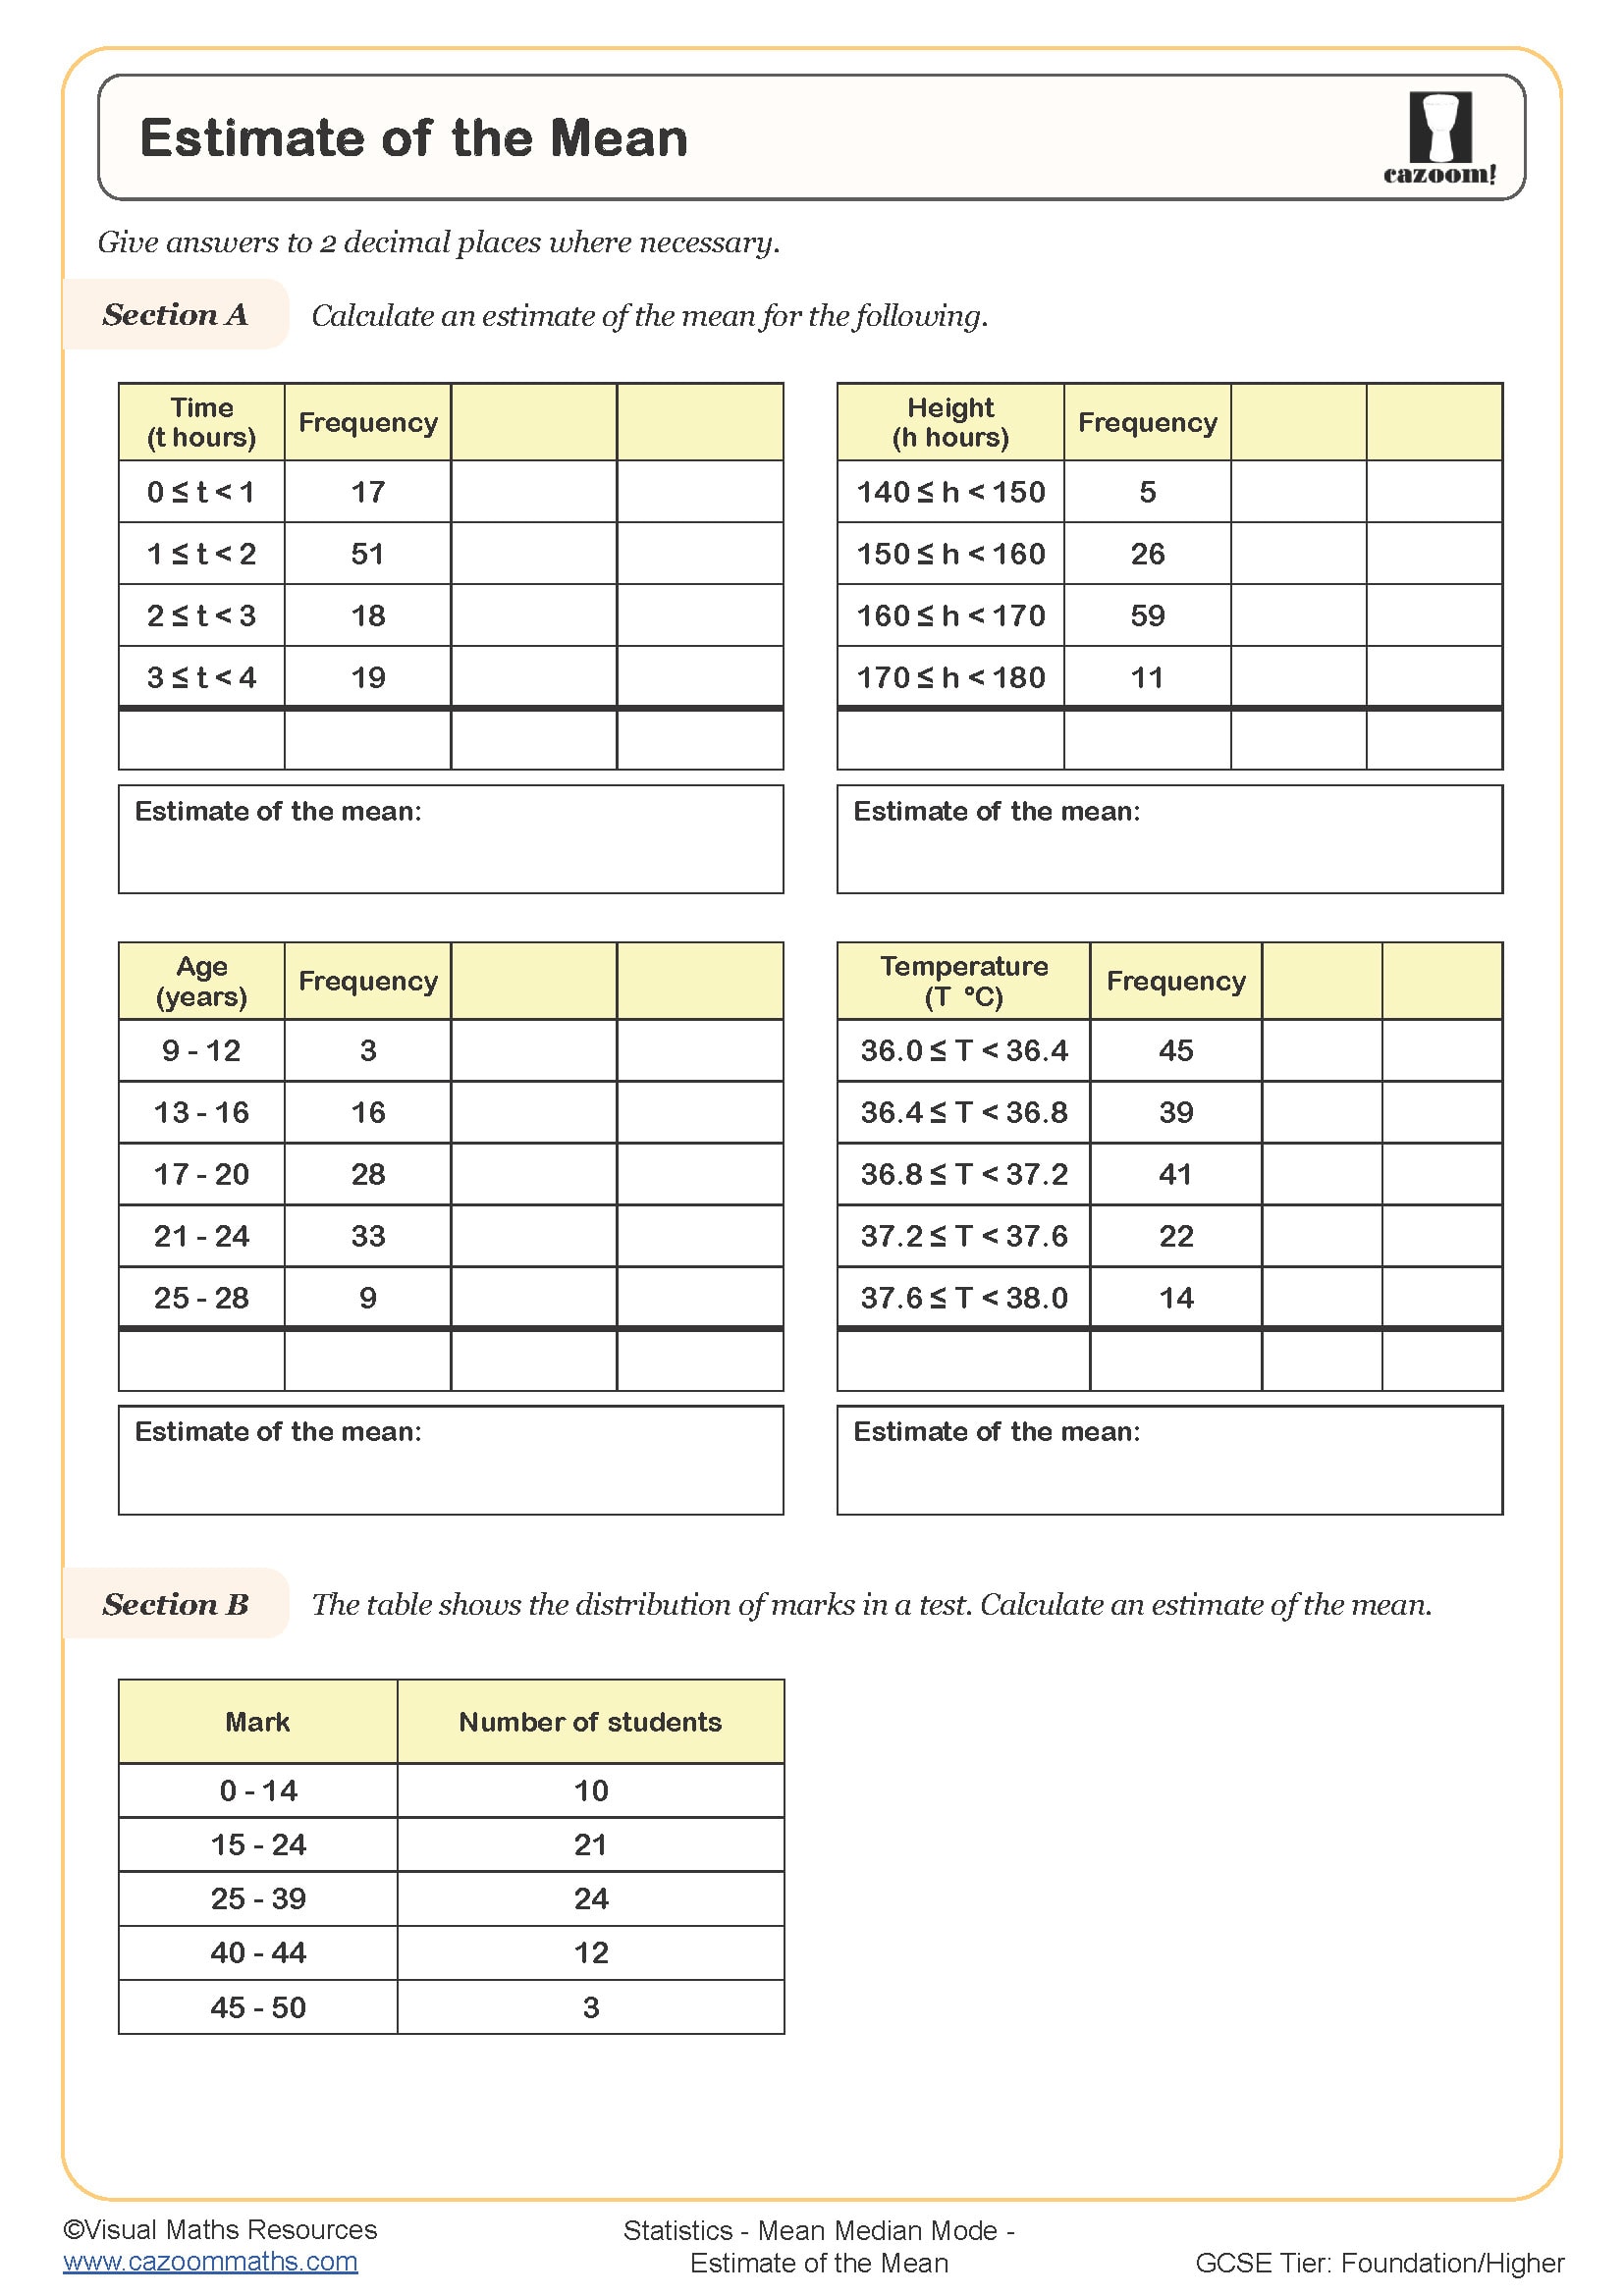
Estimate of the Mean
Year groups: 8, 9
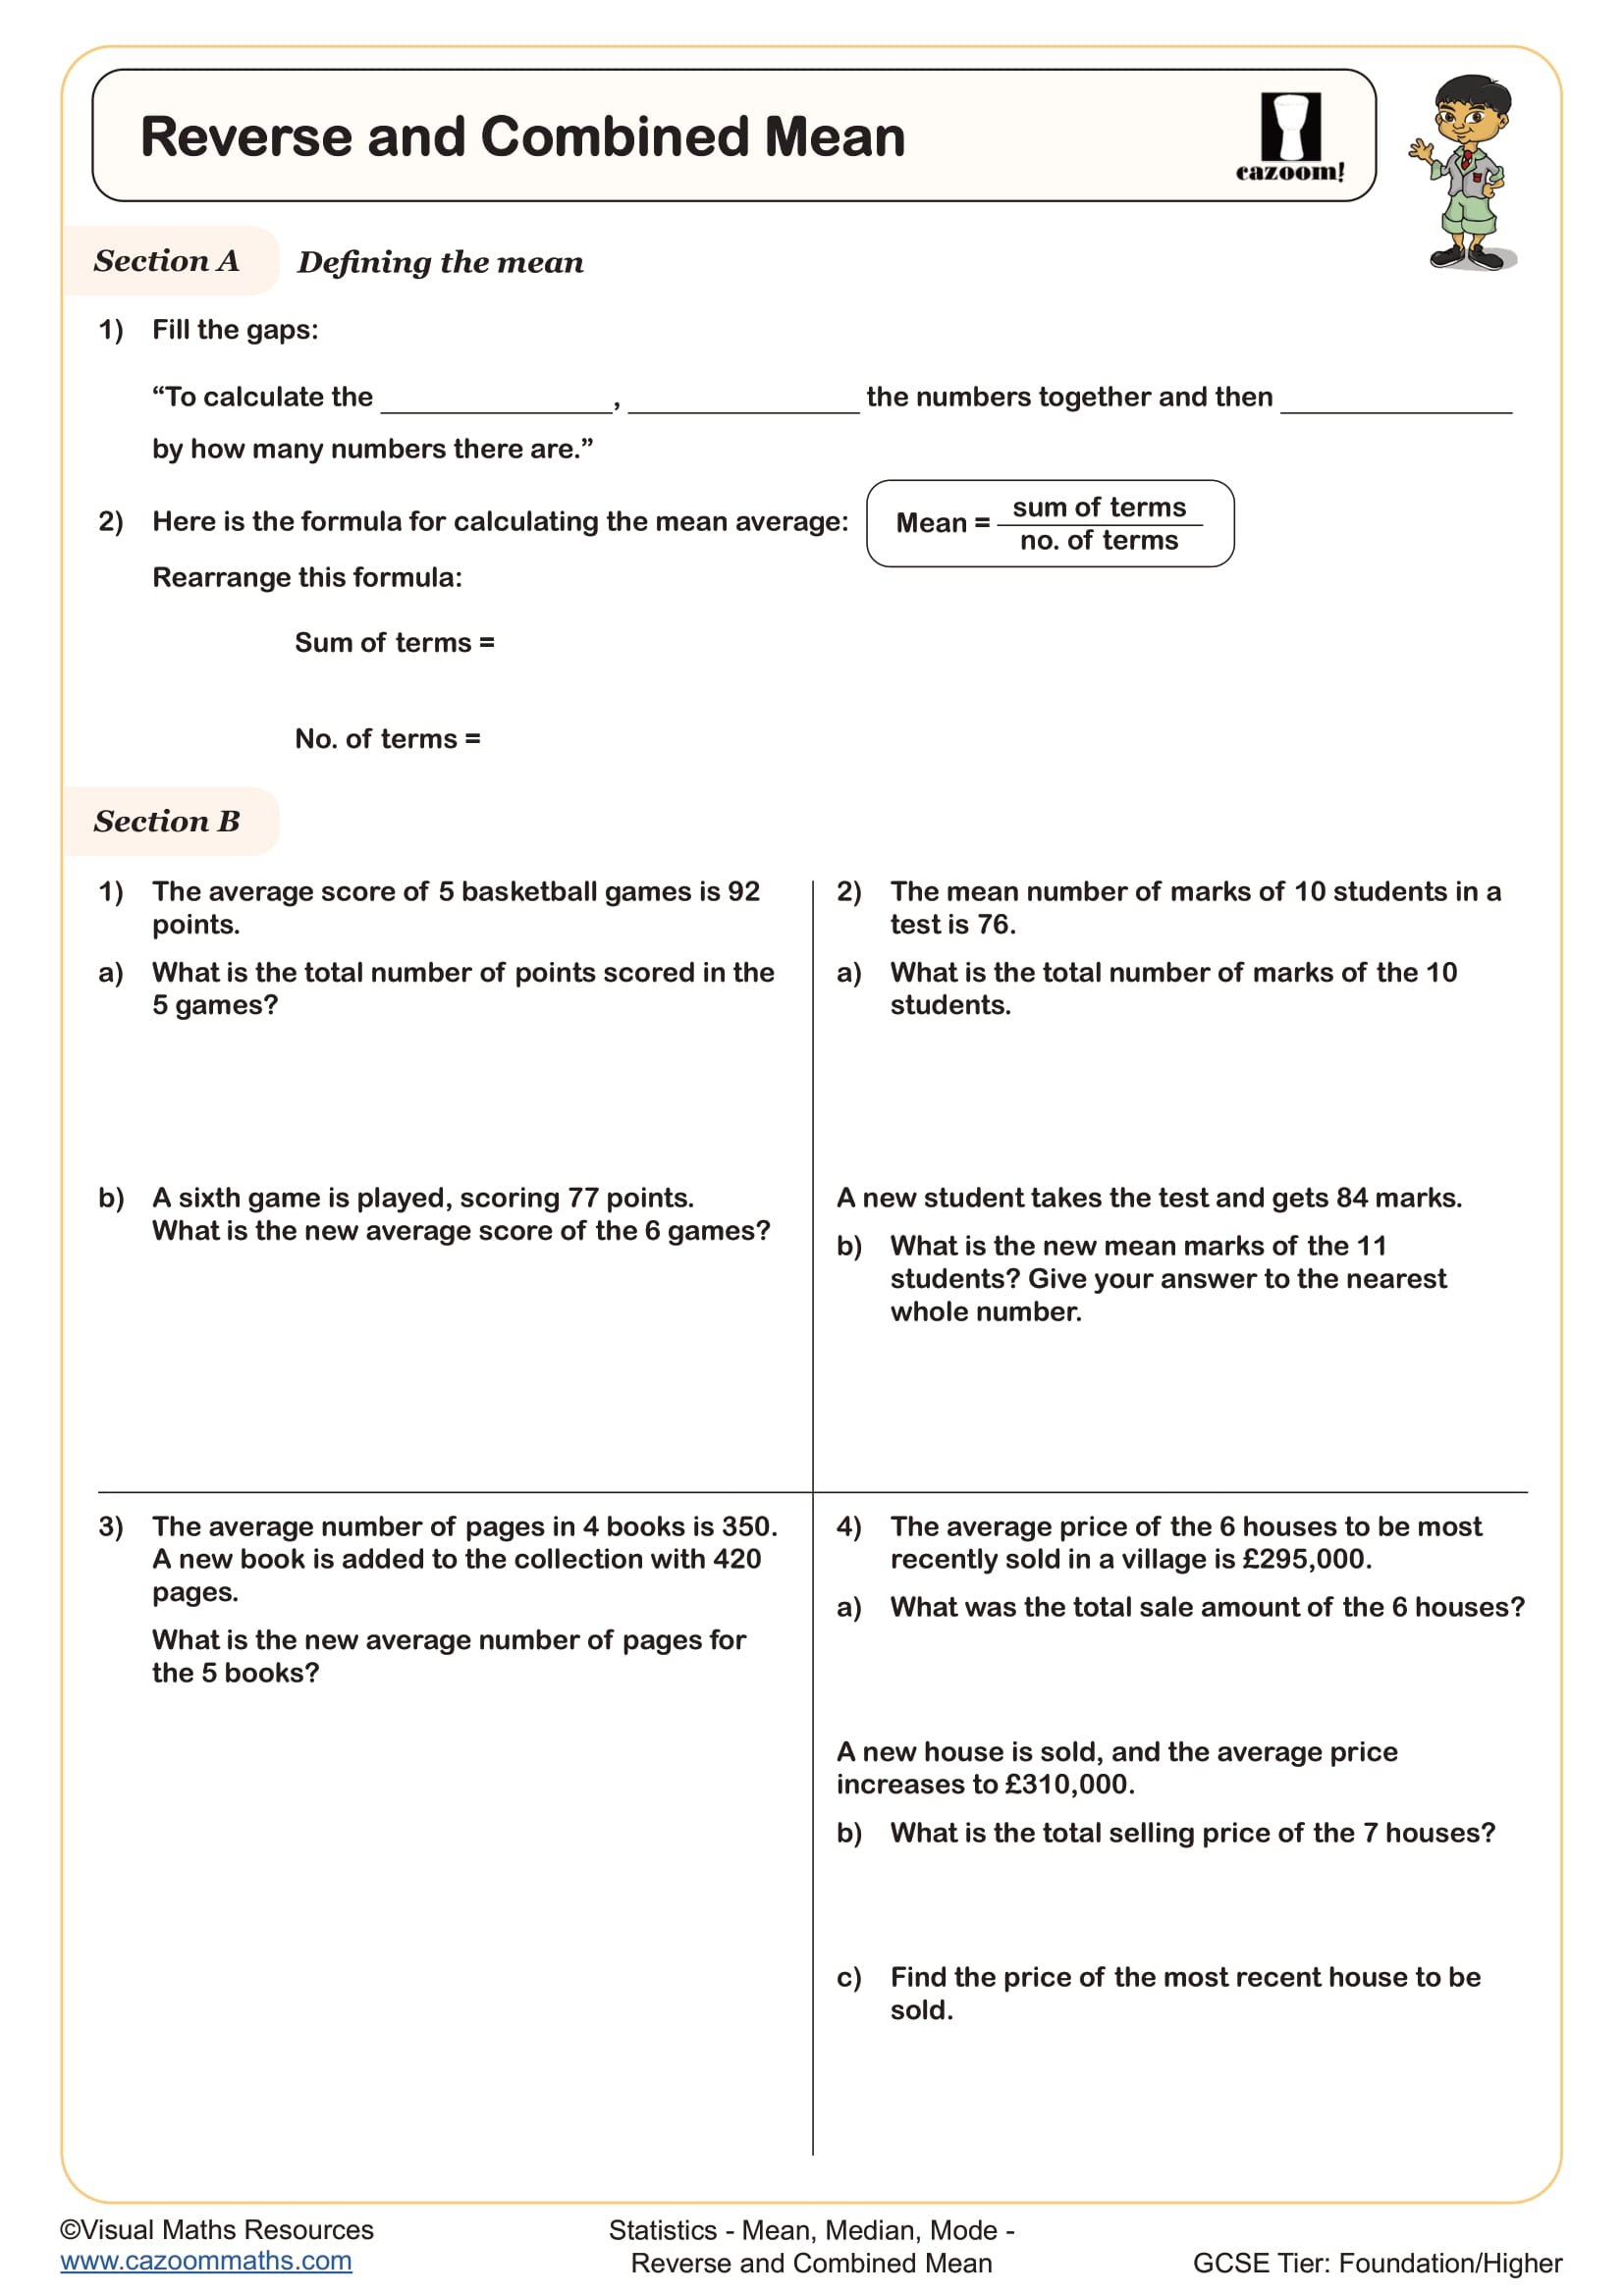
Reverse and Combined Mean
Year groups: 9, 10
All worksheets are created by the team of experienced teachers at Cazoom Maths.
What makes an effective mean median mode worksheet for KS3 and KS4 students?
An effective mean median and mode worksheet balances procedural practice with conceptual understanding, starting with clear datasets before introducing complications like missing values or frequency tables. The National Curriculum expects students to calculate these measures accurately and understand when each is most appropriate - mean for normally distributed data, median for skewed distributions, and mode for categorical data.
Teachers notice that students often confuse median calculation when datasets contain even numbers of values, frequently taking the middle two values rather than their average. Quality mean median and mode worksheets address this by providing explicit worked examples and varied practice questions that reinforce the 'average of middle two' rule, alongside explanations of why this method maintains the median's position as the central value.
Which year groups benefit most from mean median mode range worksheets?
Year 7 students typically encounter these concepts for the first time, requiring mean mode median worksheet resources that emphasise clear step-by-step methods with whole number datasets. By Year 8, students handle decimal values and begin comparing different measures, whilst Years 9-11 work with frequency tables, grouped data, and examination-style questions that demand statistical reasoning.
Progression becomes crucial around Year 9 when students must justify which average best represents a dataset - a skill that appears regularly in GCSE statistics questions. Teachers observe that students who master basic calculations in Years 7-8 but lack conceptual understanding struggle with these higher-level applications, making mean mode median range worksheet collections that embed reasoning throughout particularly valuable for sustained learning.
How do students typically struggle with range calculations in statistics work?
Range appears deceptively simple compared to the three averages, yet students frequently make errors by confusing range with other measures or misidentifying the highest and lowest values in complex datasets. Teachers notice this particularly when data appears in frequency tables, where students might use frequency values rather than the actual data values for their range calculation.
Another common misconception involves negative numbers - students often calculate range incorrectly when datasets include negative values, forgetting that range equals highest value minus lowest value regardless of sign. Well-structured mean median mode range worksheets address this by including datasets with negative temperatures, elevations below sea level, and profit/loss scenarios that reinforce proper range calculation whilst connecting to real-world applications students understand.
How can teachers use these worksheets to improve GCSE statistics performance?
Teachers report best results when using these worksheets diagnostically first - identifying which students confuse concepts versus those who make procedural errors. This informs targeted intervention, with some students needing conceptual reinforcement whilst others require calculation practice. The answer sheets enable peer assessment sessions where students explain their methods, deepening understanding through mathematical discourse.
Successful GCSE preparation involves regular low-stakes practice throughout Years 10-11 rather than intensive revision. Teachers often assign one mean median mode range worksheet weekly as starter activities, building fluency whilst maintaining focus on interpretation skills. This approach particularly benefits students who struggle with statistics questions under exam pressure, as automated recall of basic calculations frees cognitive load for the reasoning and explanation skills that distinguish higher GCSE grades.
How do You Find the Median of a Set of Numbers?
The median is the middle number in a set of data. You find the median of a set of numbers by putting all of the numbers in order from least to greatest. Numbers can then be crossed out starting with the lowest, then the highest, then the lowest and so on. As numbers are crossed off, you will be left with one number in the middle. That number is the median. This measure of central tendency is another way to get an idea of what the average of the set of data is. One of the best things about finding the median as compared to the mean is that the median will throw out any outlier numbers in the calculation. Those same outlier numbers are factored in when calculating the mean.
Students may find it helpful to calculate the median score for their spelling or maths tests to see how it compares to the mean. If a student has had a few really good, or really bad scores, the median will give a more accurate picture of how they are actually doing in a particular class.
How do You Find the Mode of a Set of Numbers?
You find the mode of a set of numbers by simply looking at which number within the set occurs the most often. For there to be a mode, a number has to occur more than once. That means it is possible for a set of numbers to have no mode, or to have more than one mode. If there were three 4’s and three 5’s in a set of numbers, and no other number occurred more than three times, there would be two different modes. The mode is a useful number to look at when trying to find trends within a group. If a student wants to know how many books classmates read during a certain month, looking at the mode of that set of numbers would be a quick way to see what is typical for the class.
Students can also use the mode to quickly make decisions based on what others around them are doing. A question about what movie classmates are going to, or which video game they are playing at home would quickly reveal a mode. That could help students decide what movies to see or what games to play based on their popularity.
The Laerd Statistics Group states, “The mean, median and mode are all valid measures of central tendency, but under different conditions, some measures of central tendency become more appropriate to use than others.” This is why it is vital for students to know and understand how to calculate each of these three measures. Knowing how to calculate each one will help students to understand when each measure is most appropriate as well.