Probability Worksheets
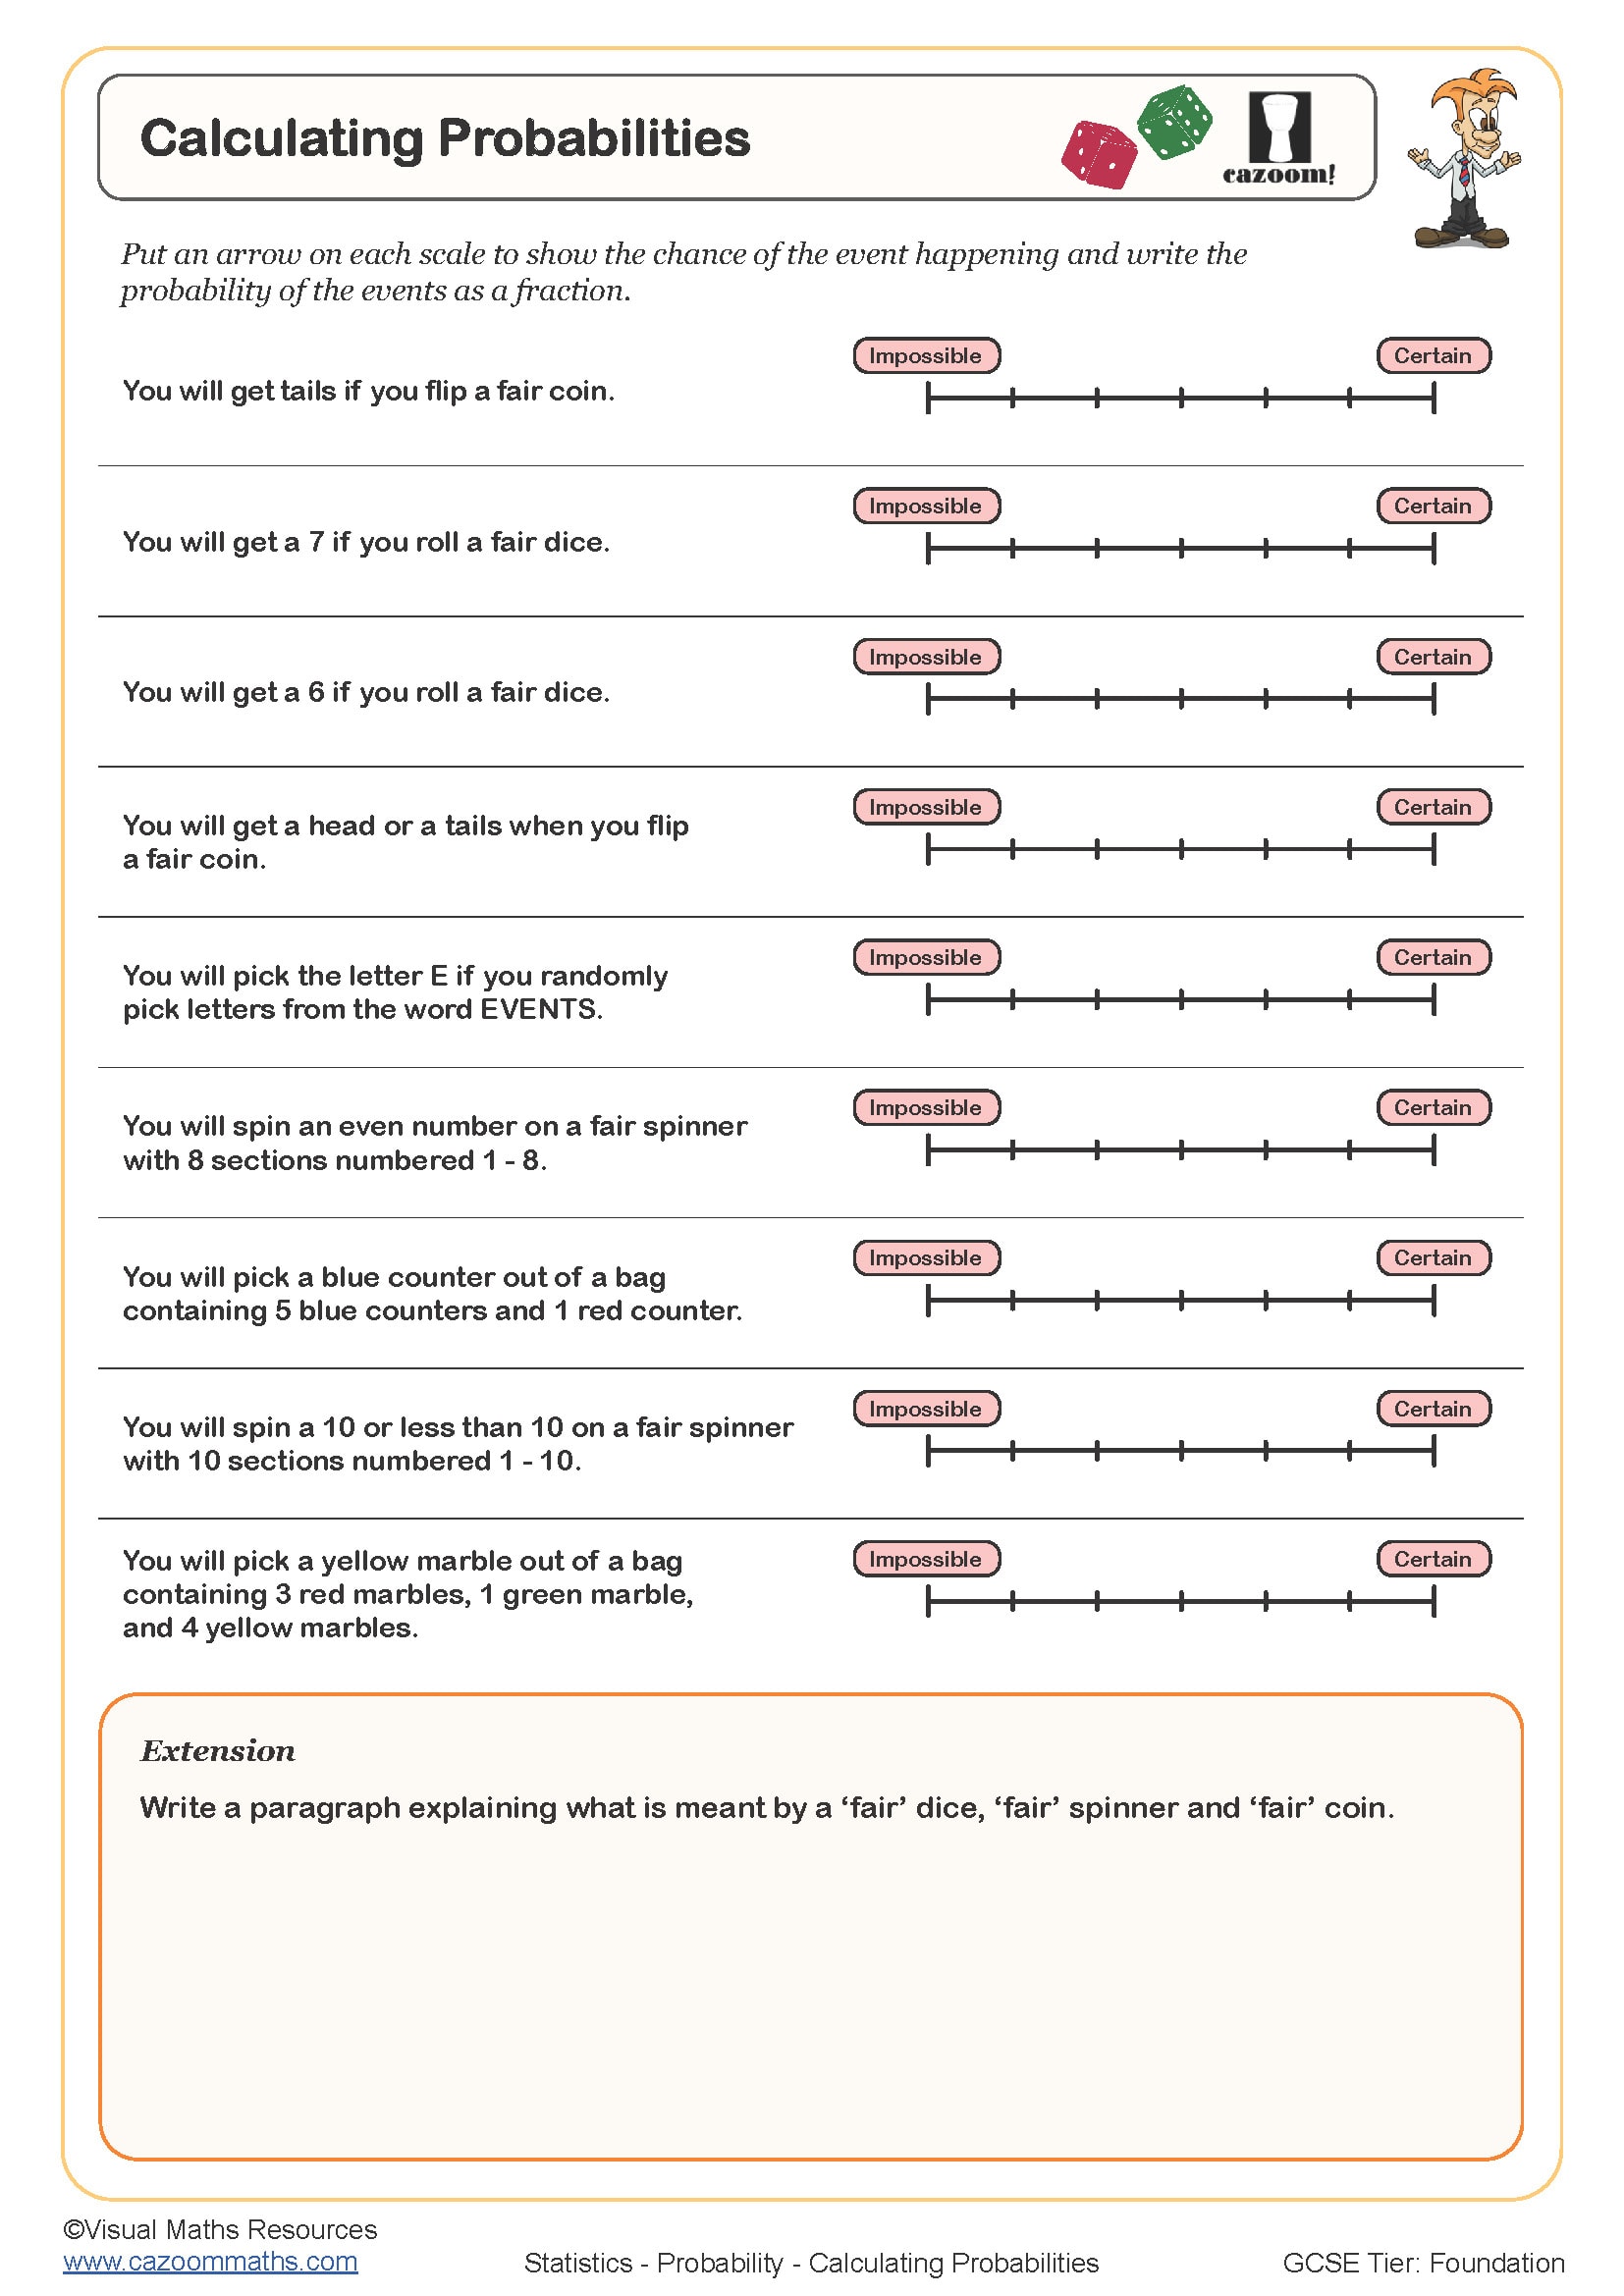
Calculating Probabilities
Year groups: 7
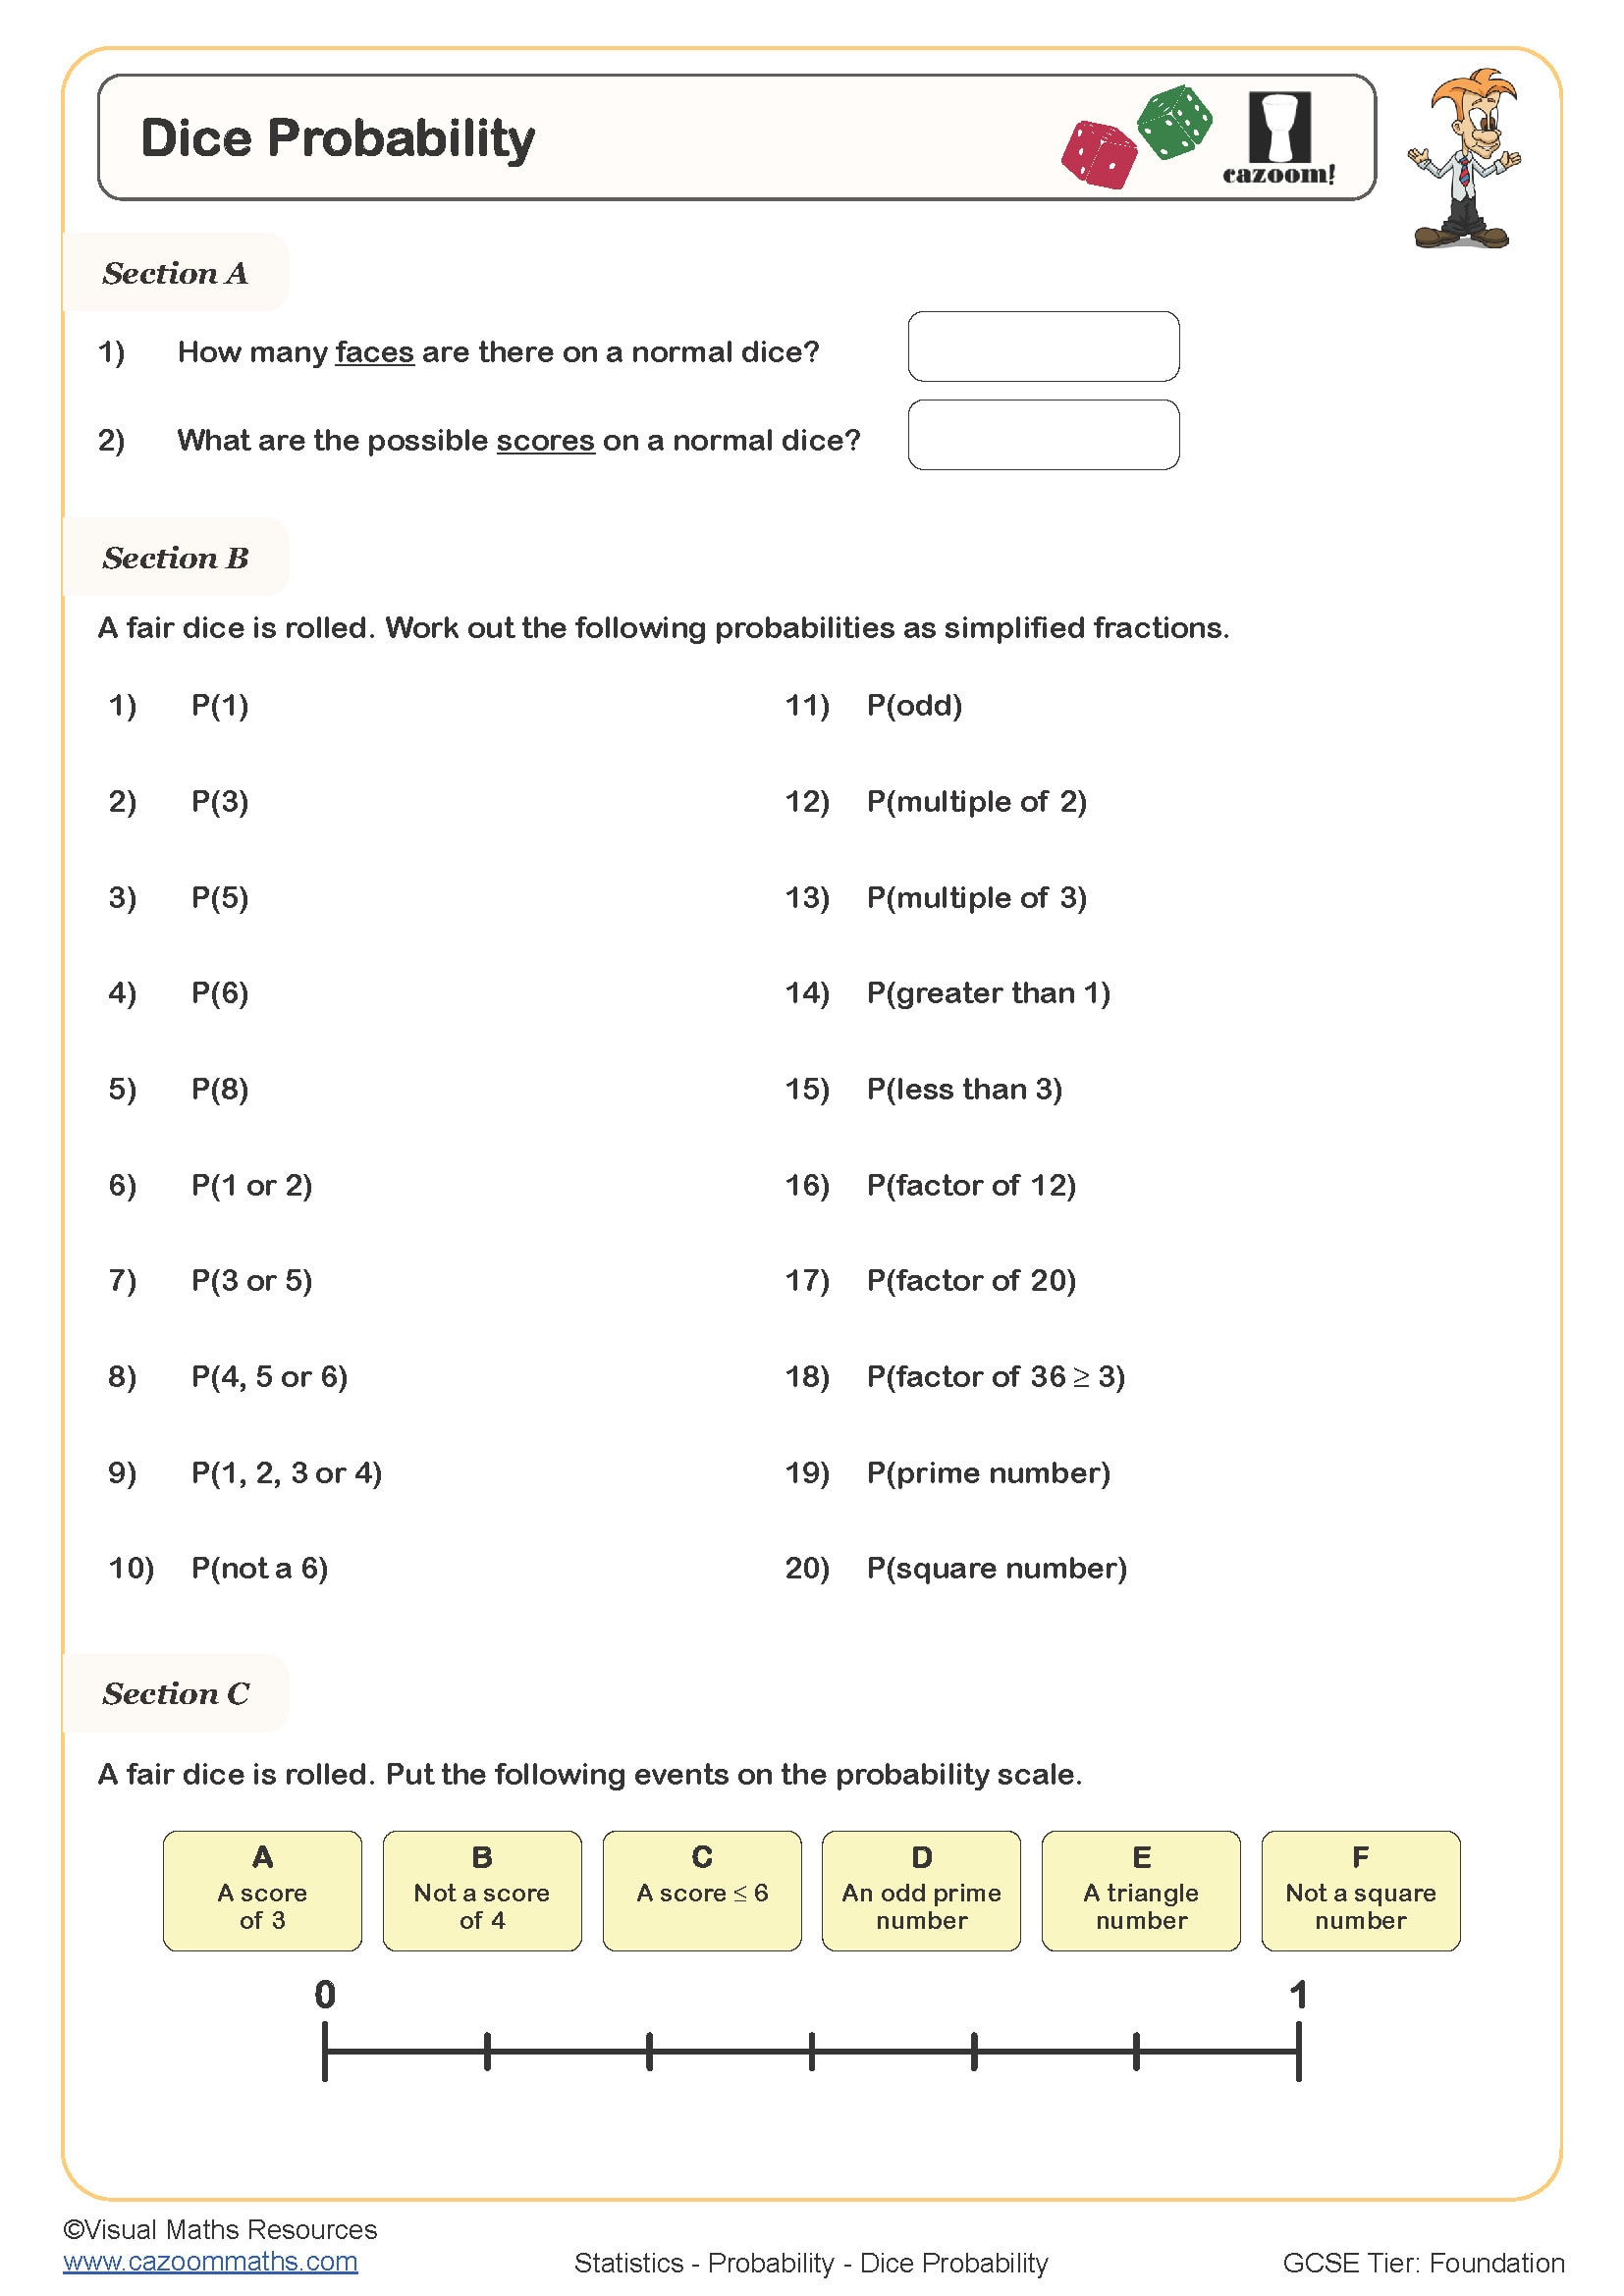
Dice Probability
Year groups: 7, 8
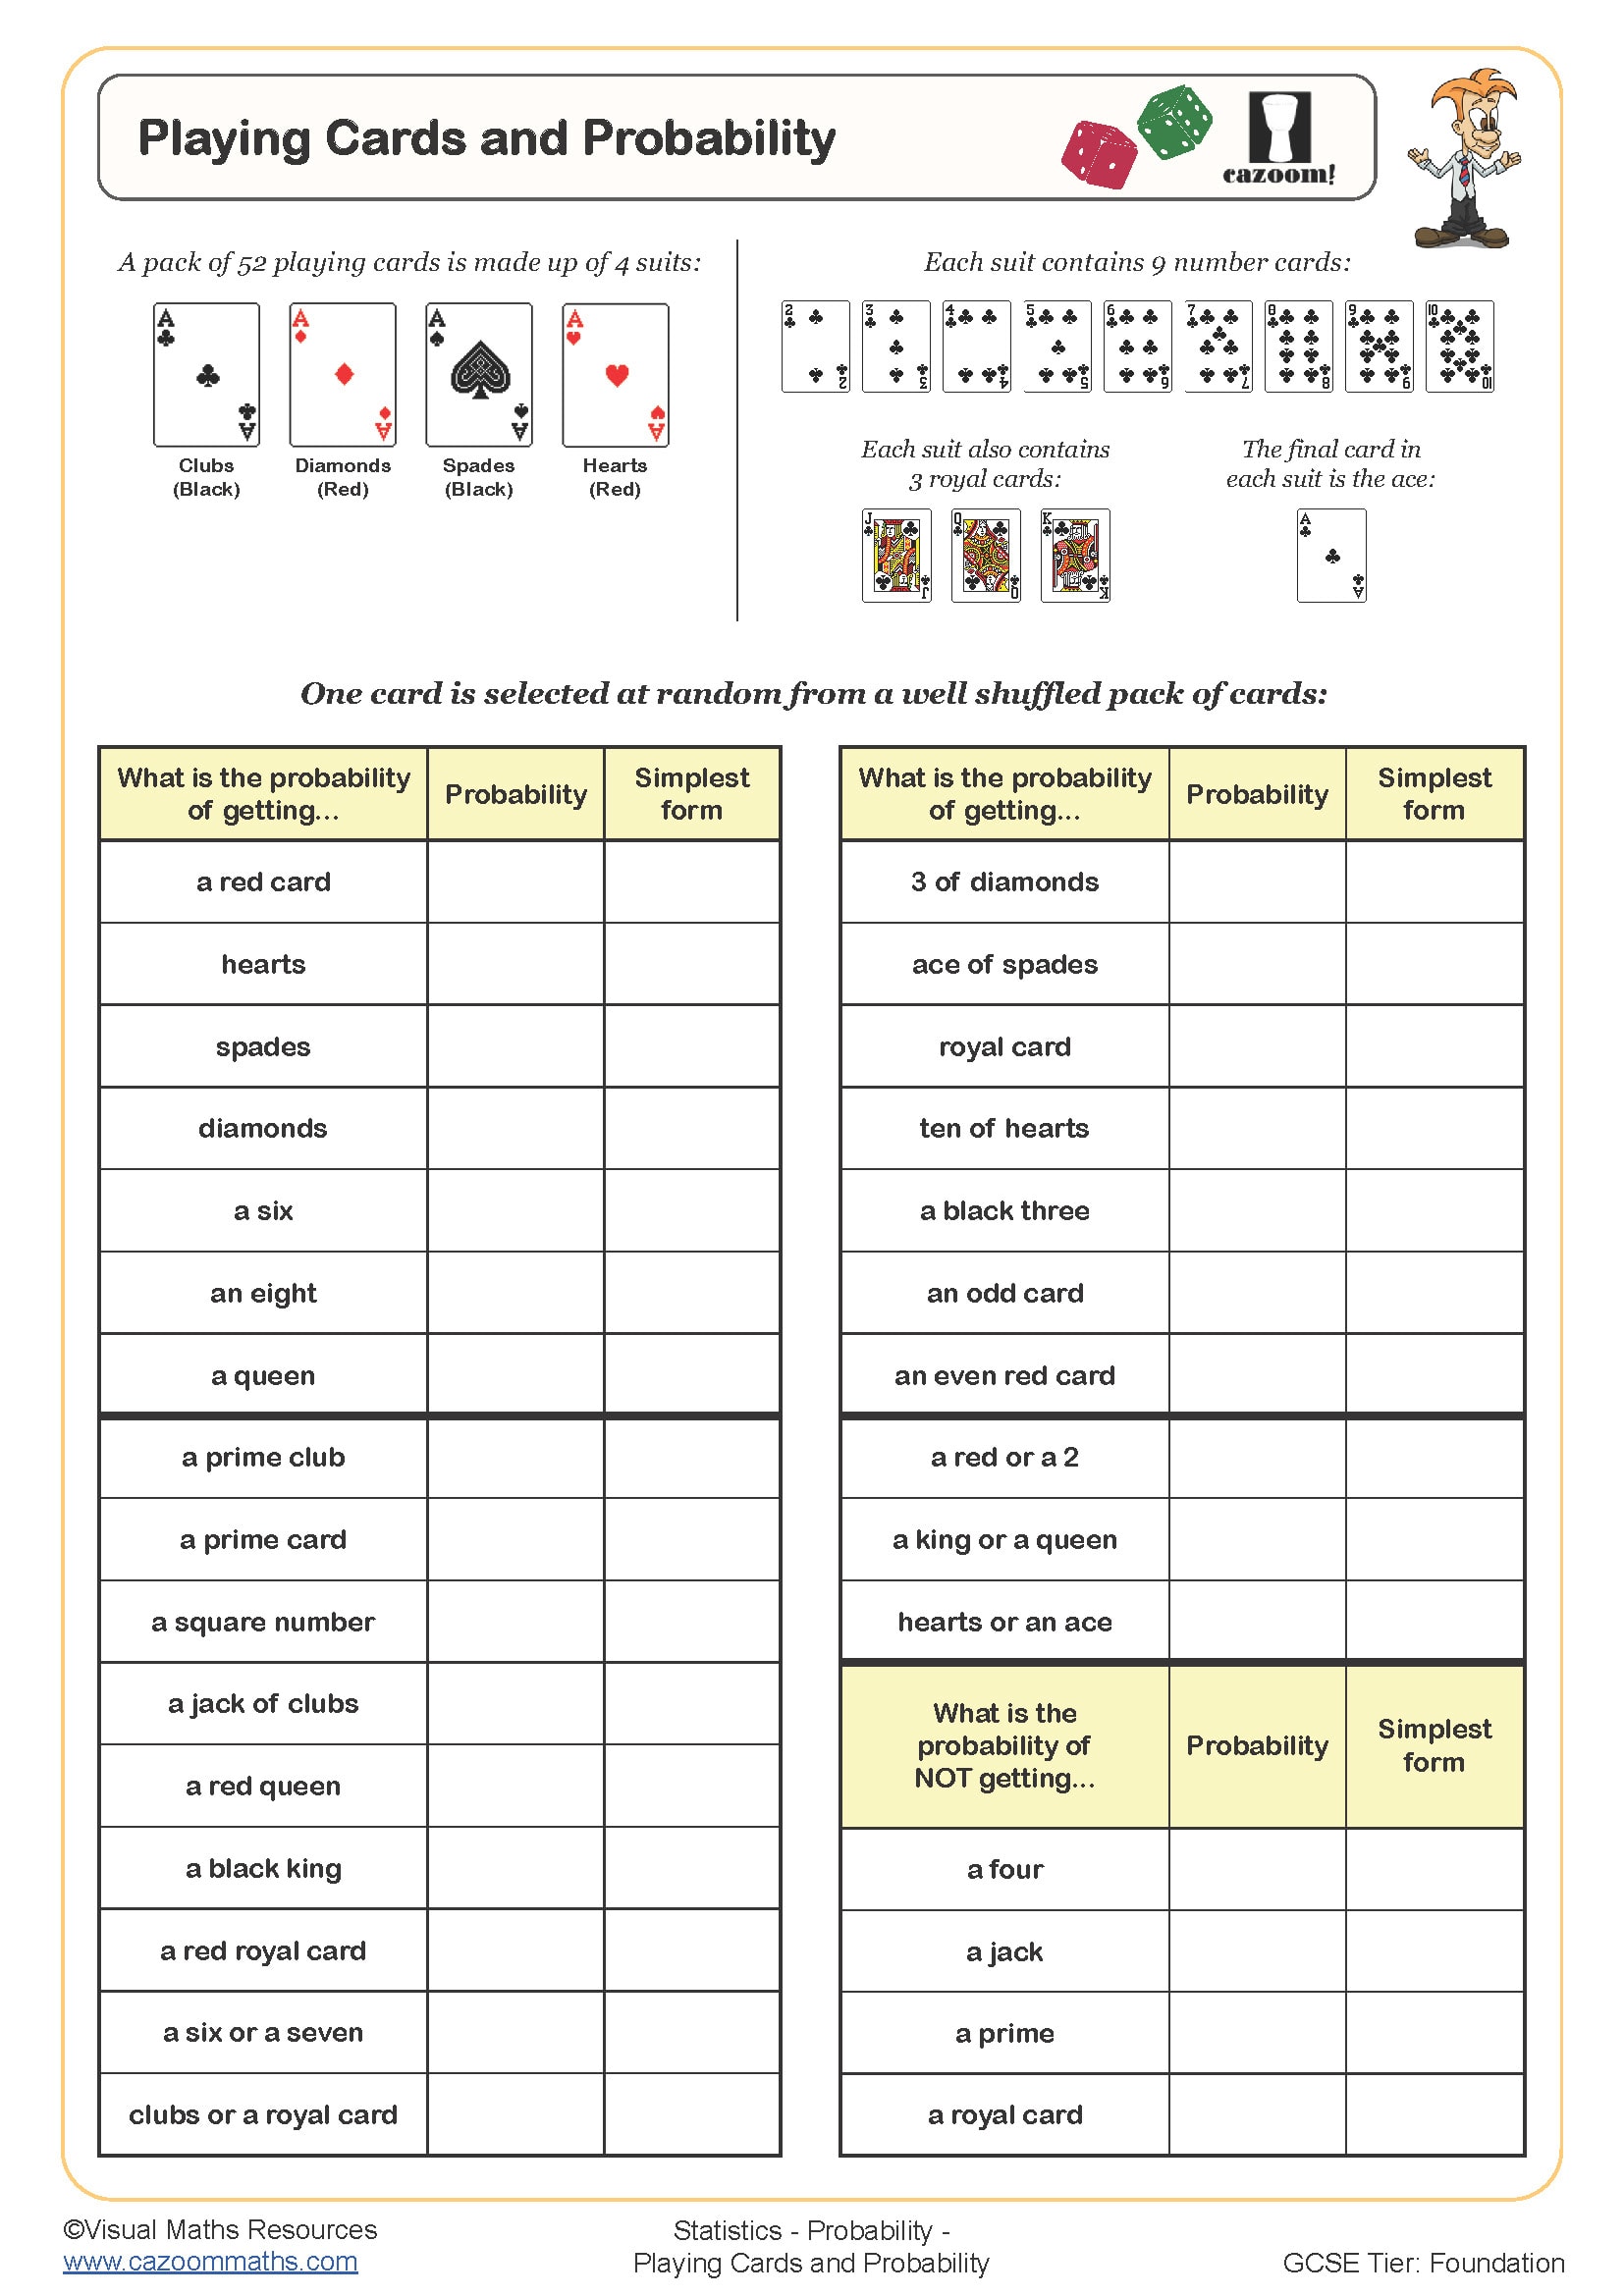
Playing Cards and Probability
Year groups: 7, 8, 9
Probability Statements - True or False
Year groups: 7, 8, 9
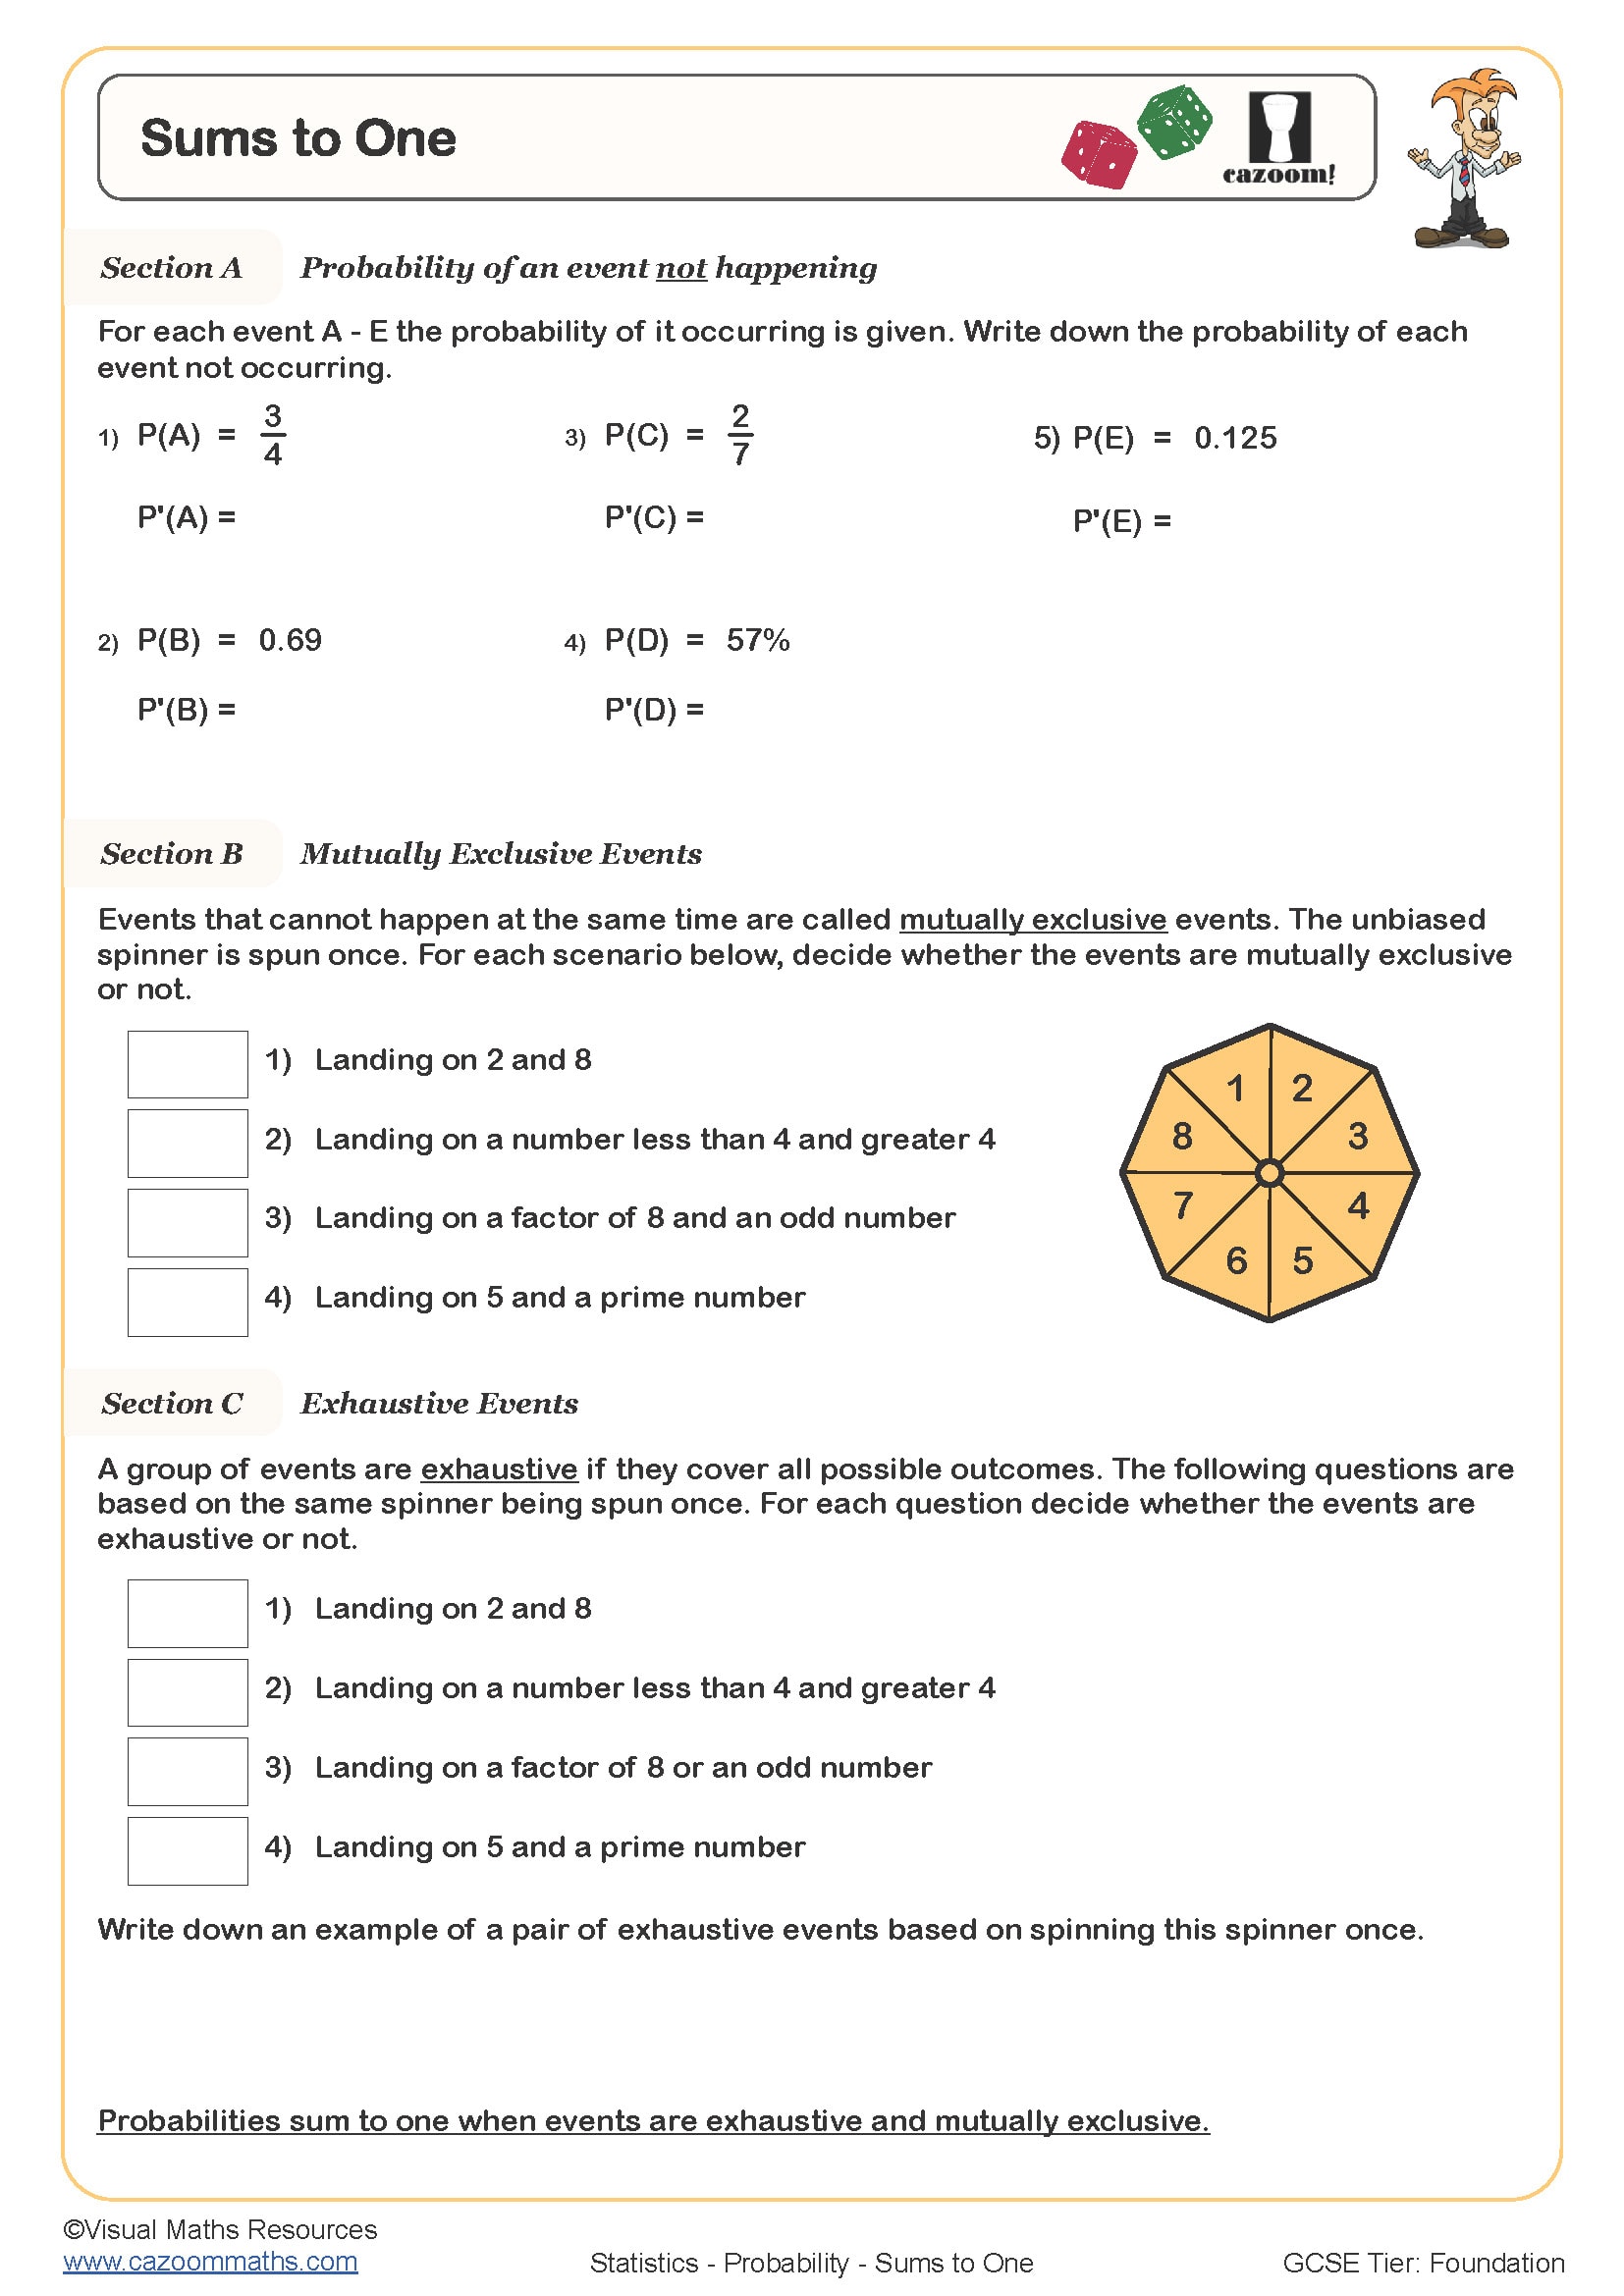
Sums to One
Year groups: 7, 8, 9
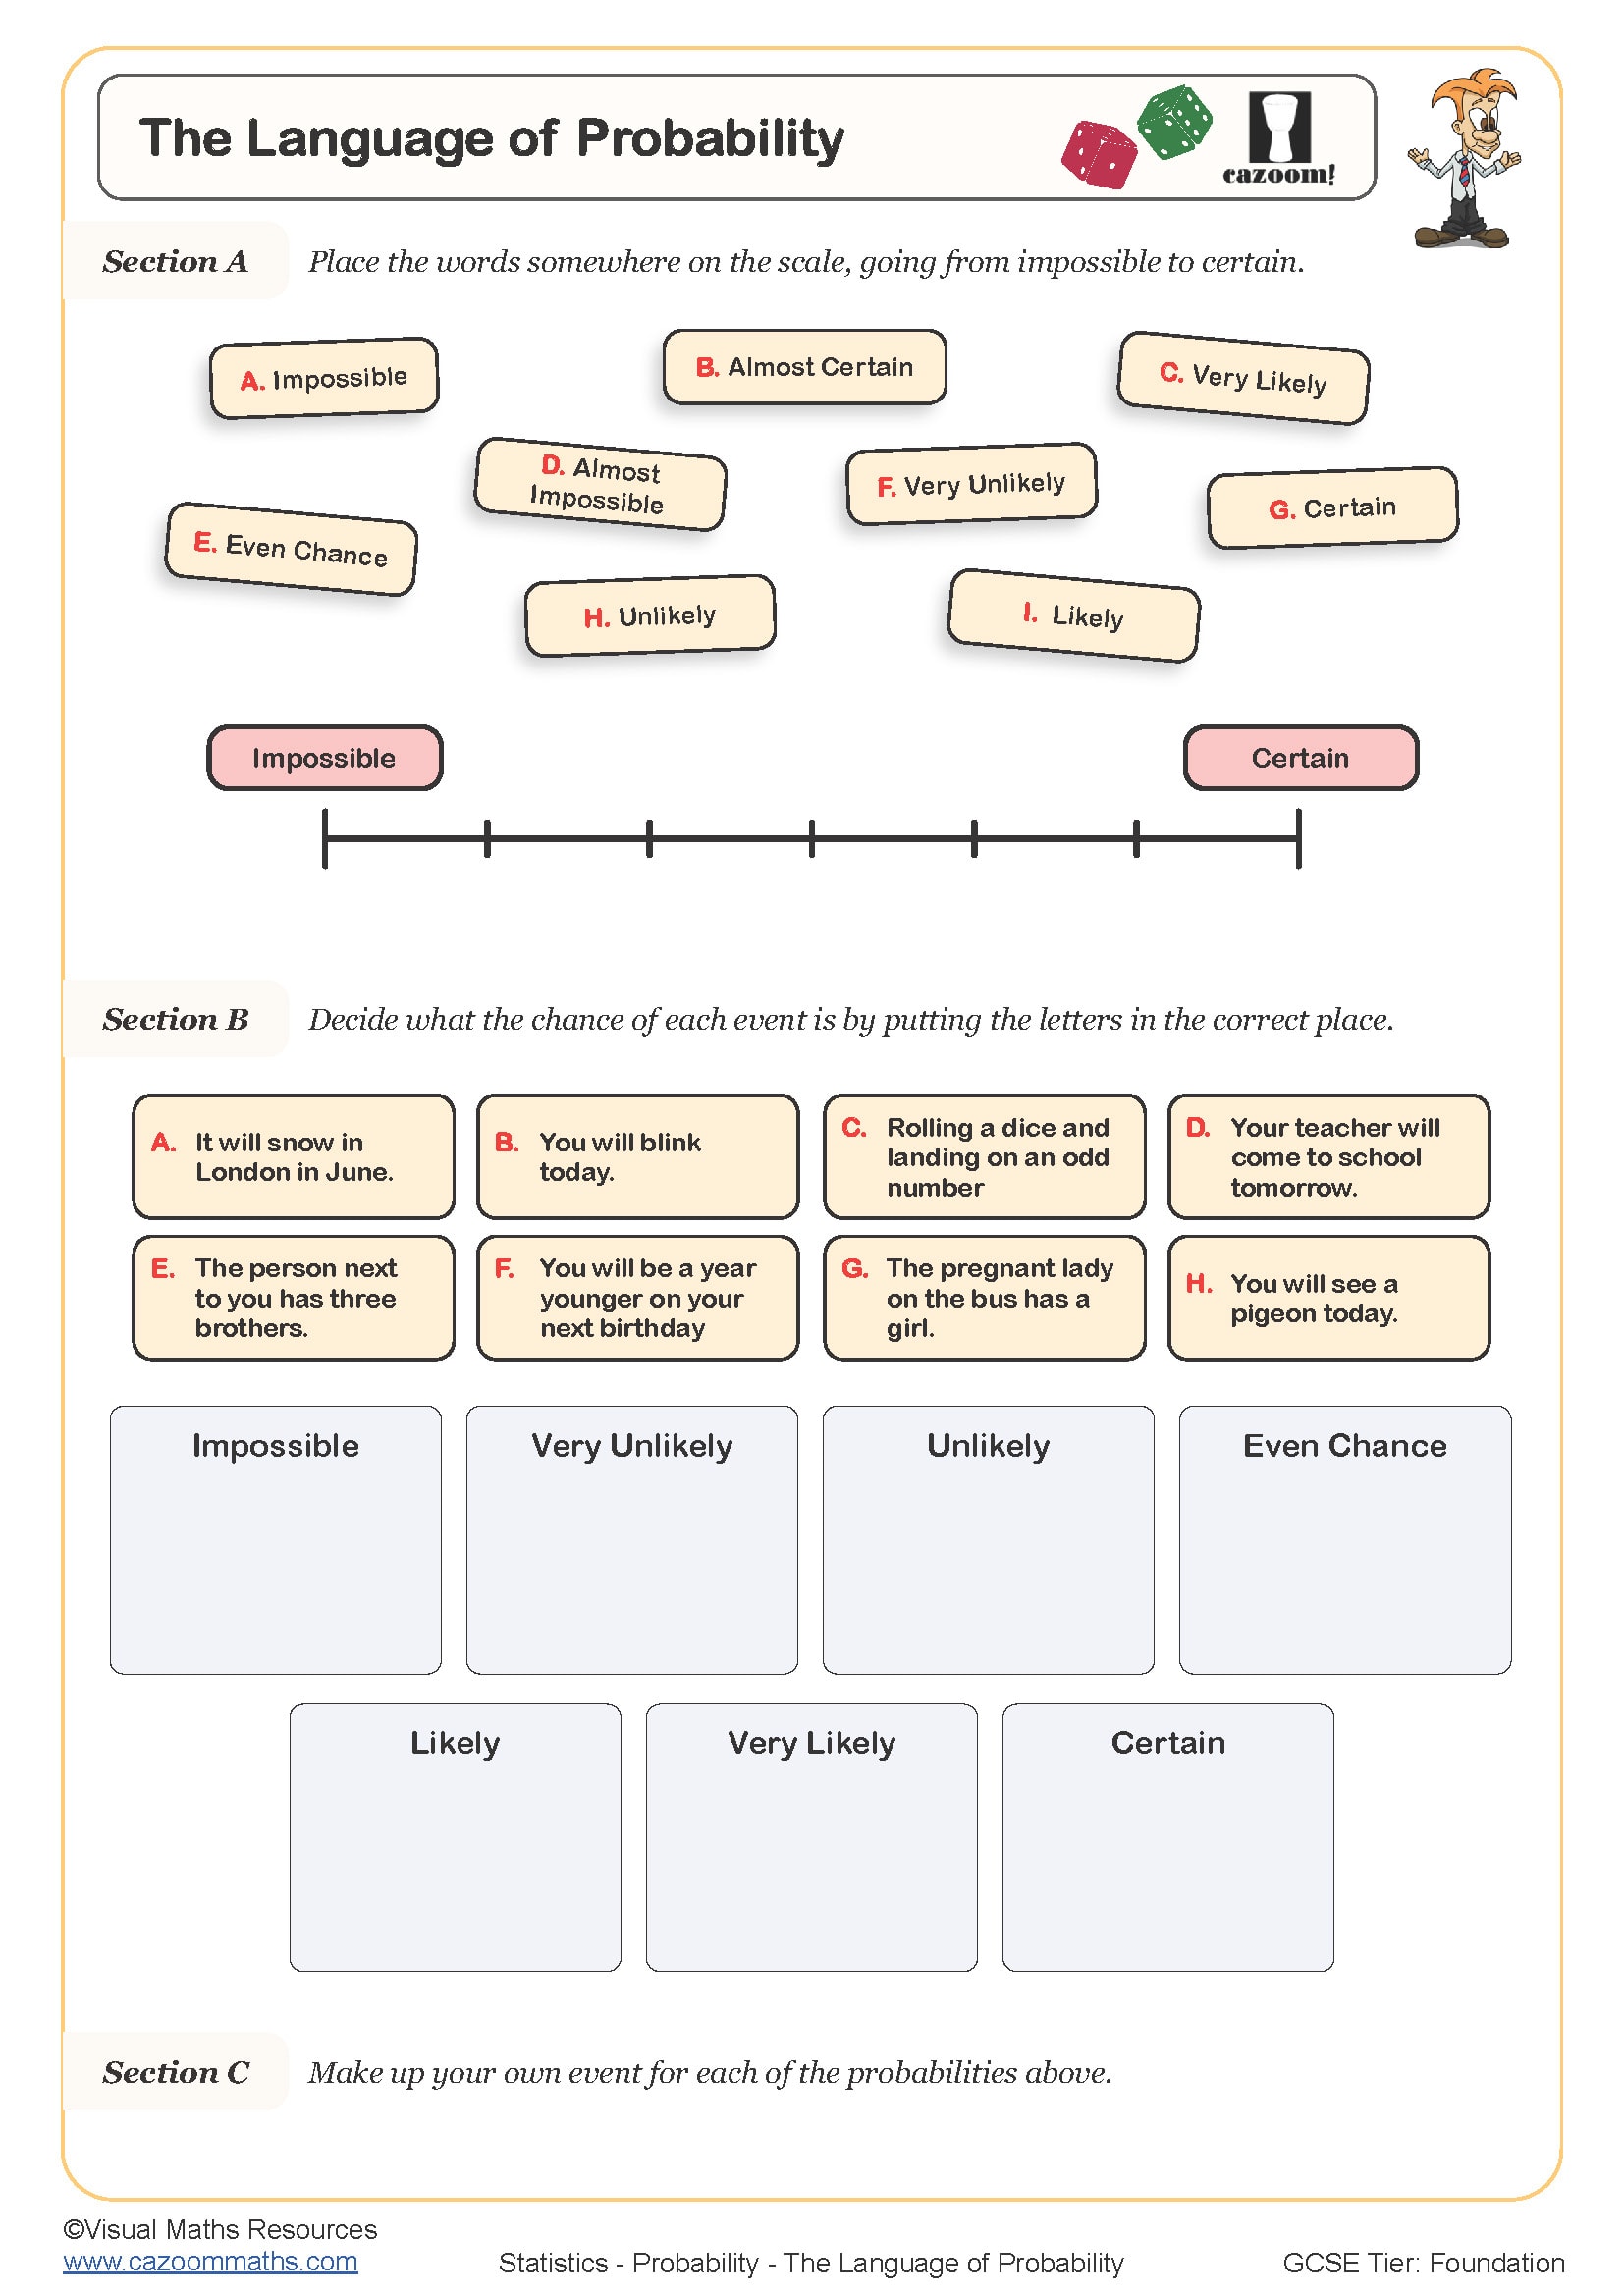
The Language of Probability
Year groups: 7
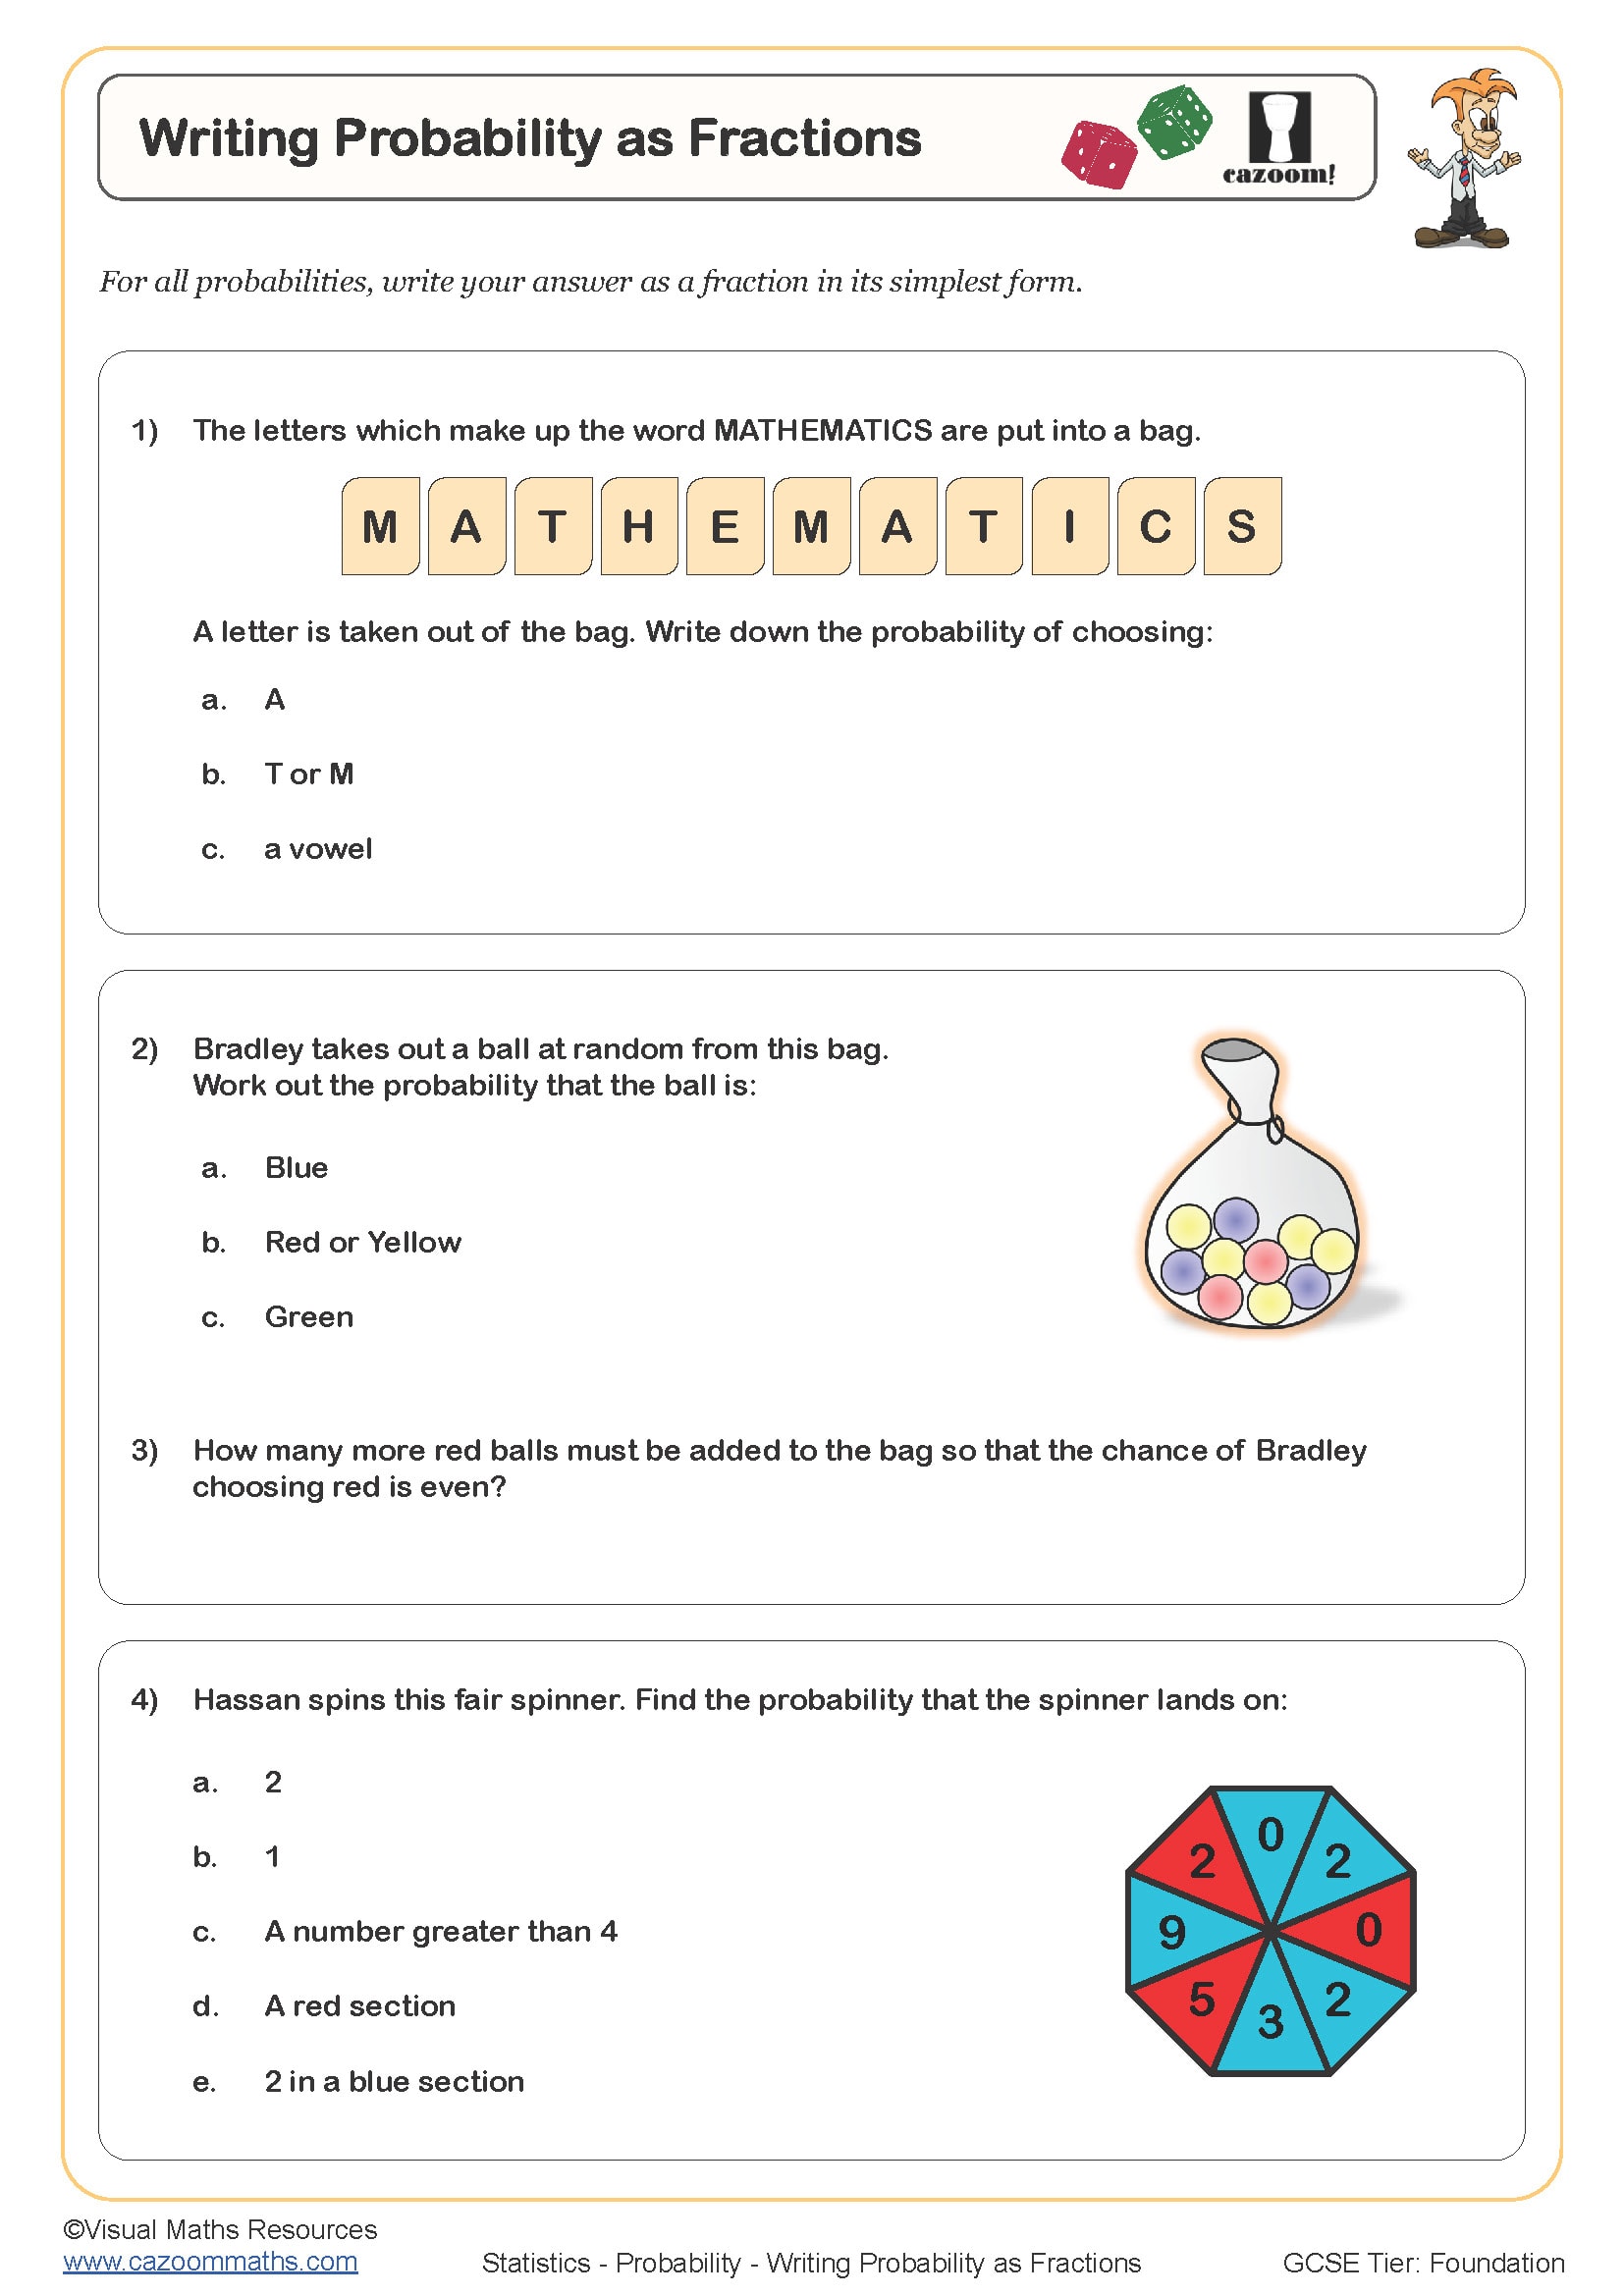
Writing Probabilty as Fractions
Year groups: 7, 8
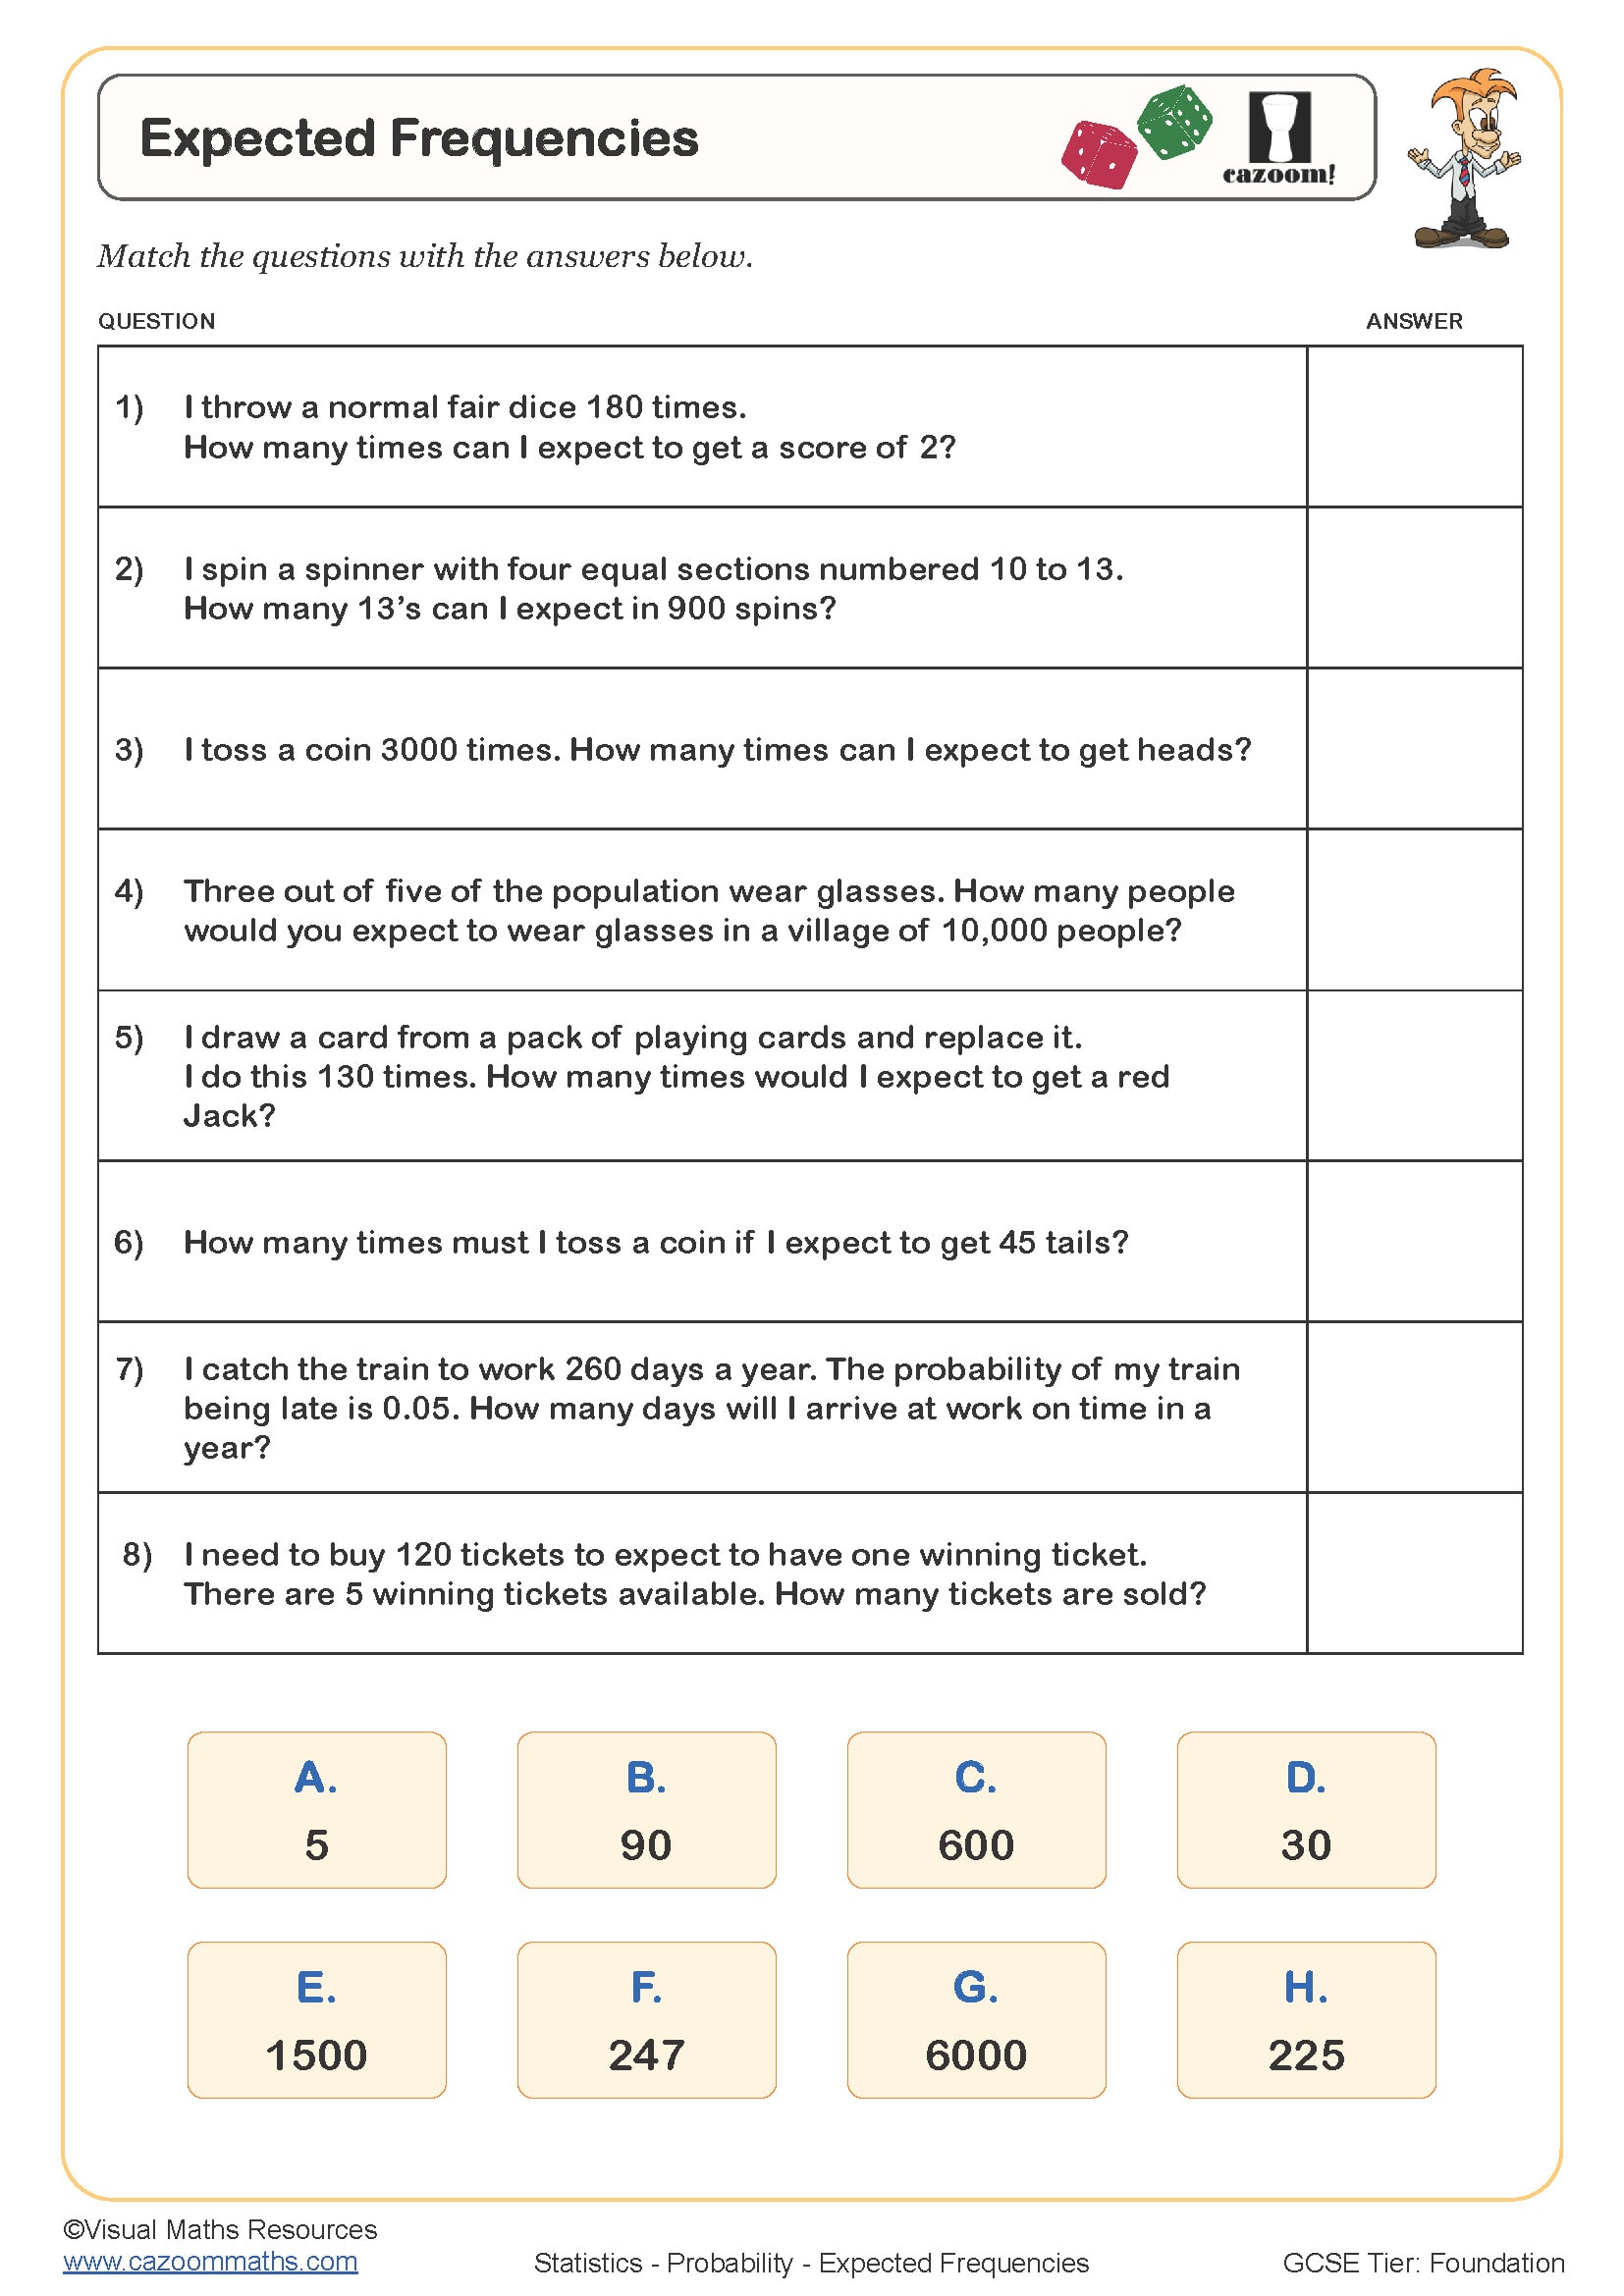
Expected Frequencies
Year groups: 8, 9, 10
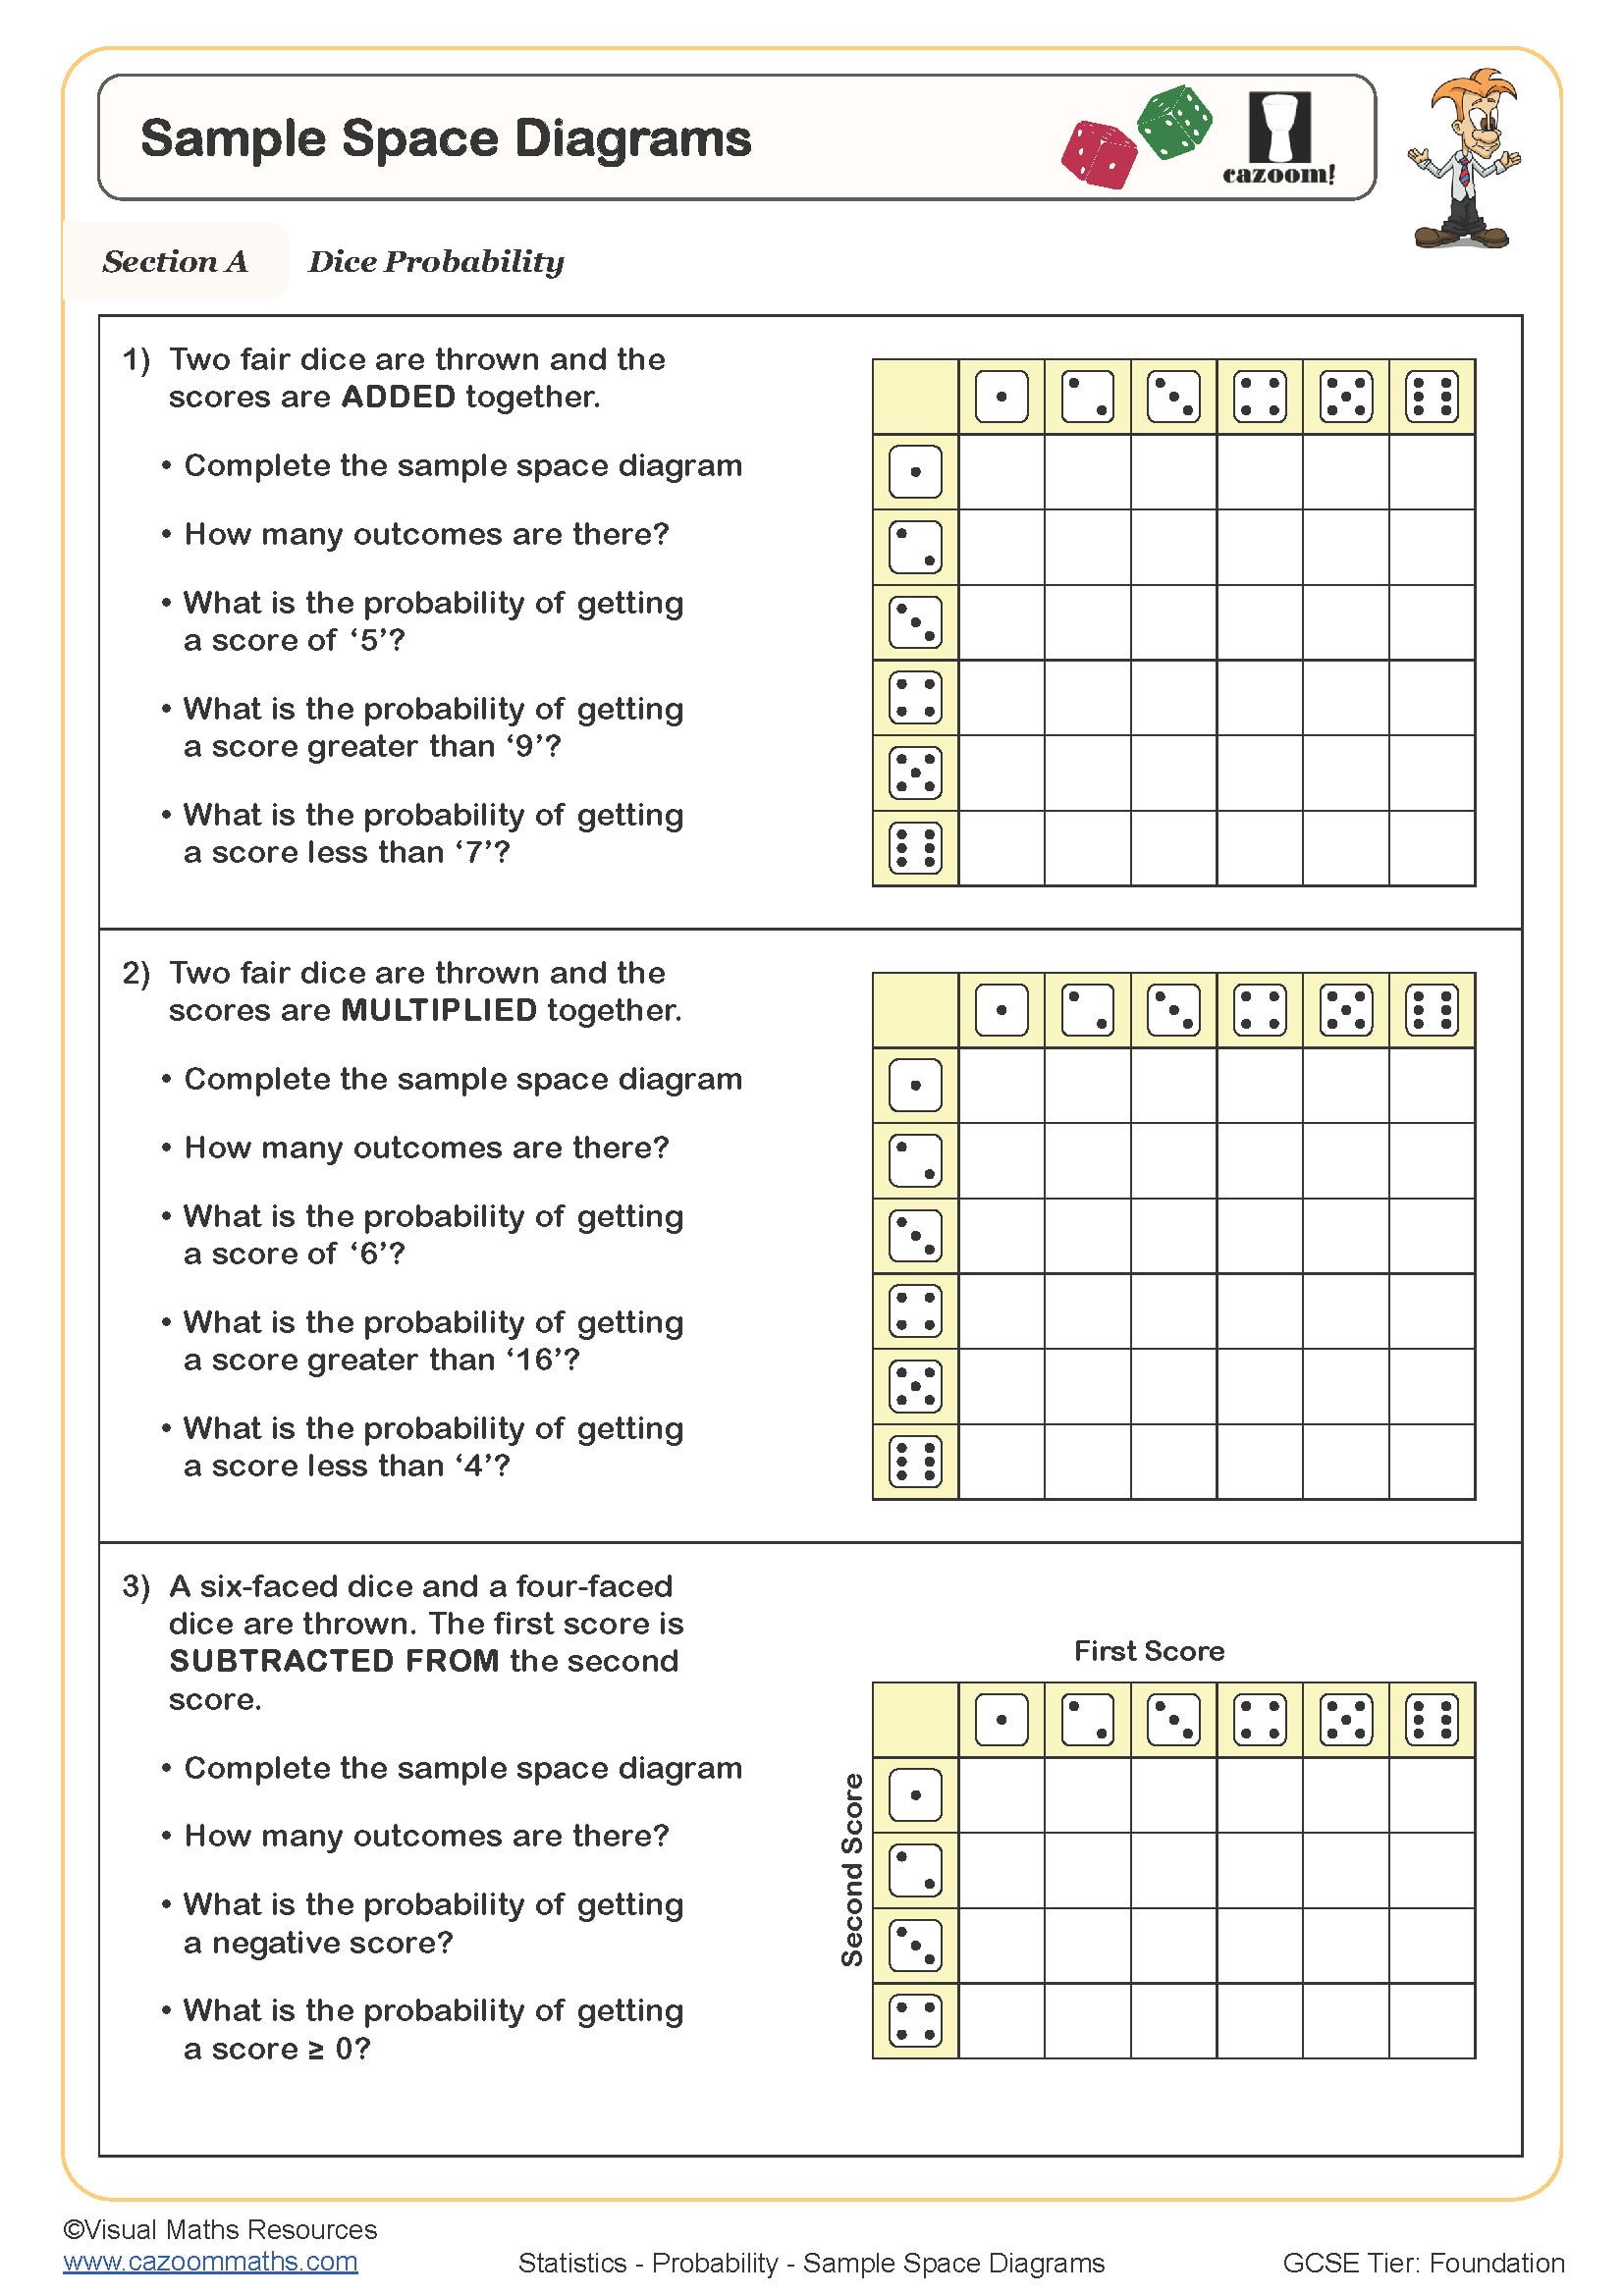
Sample Space Diagrams
Year groups: 8, 9, 10
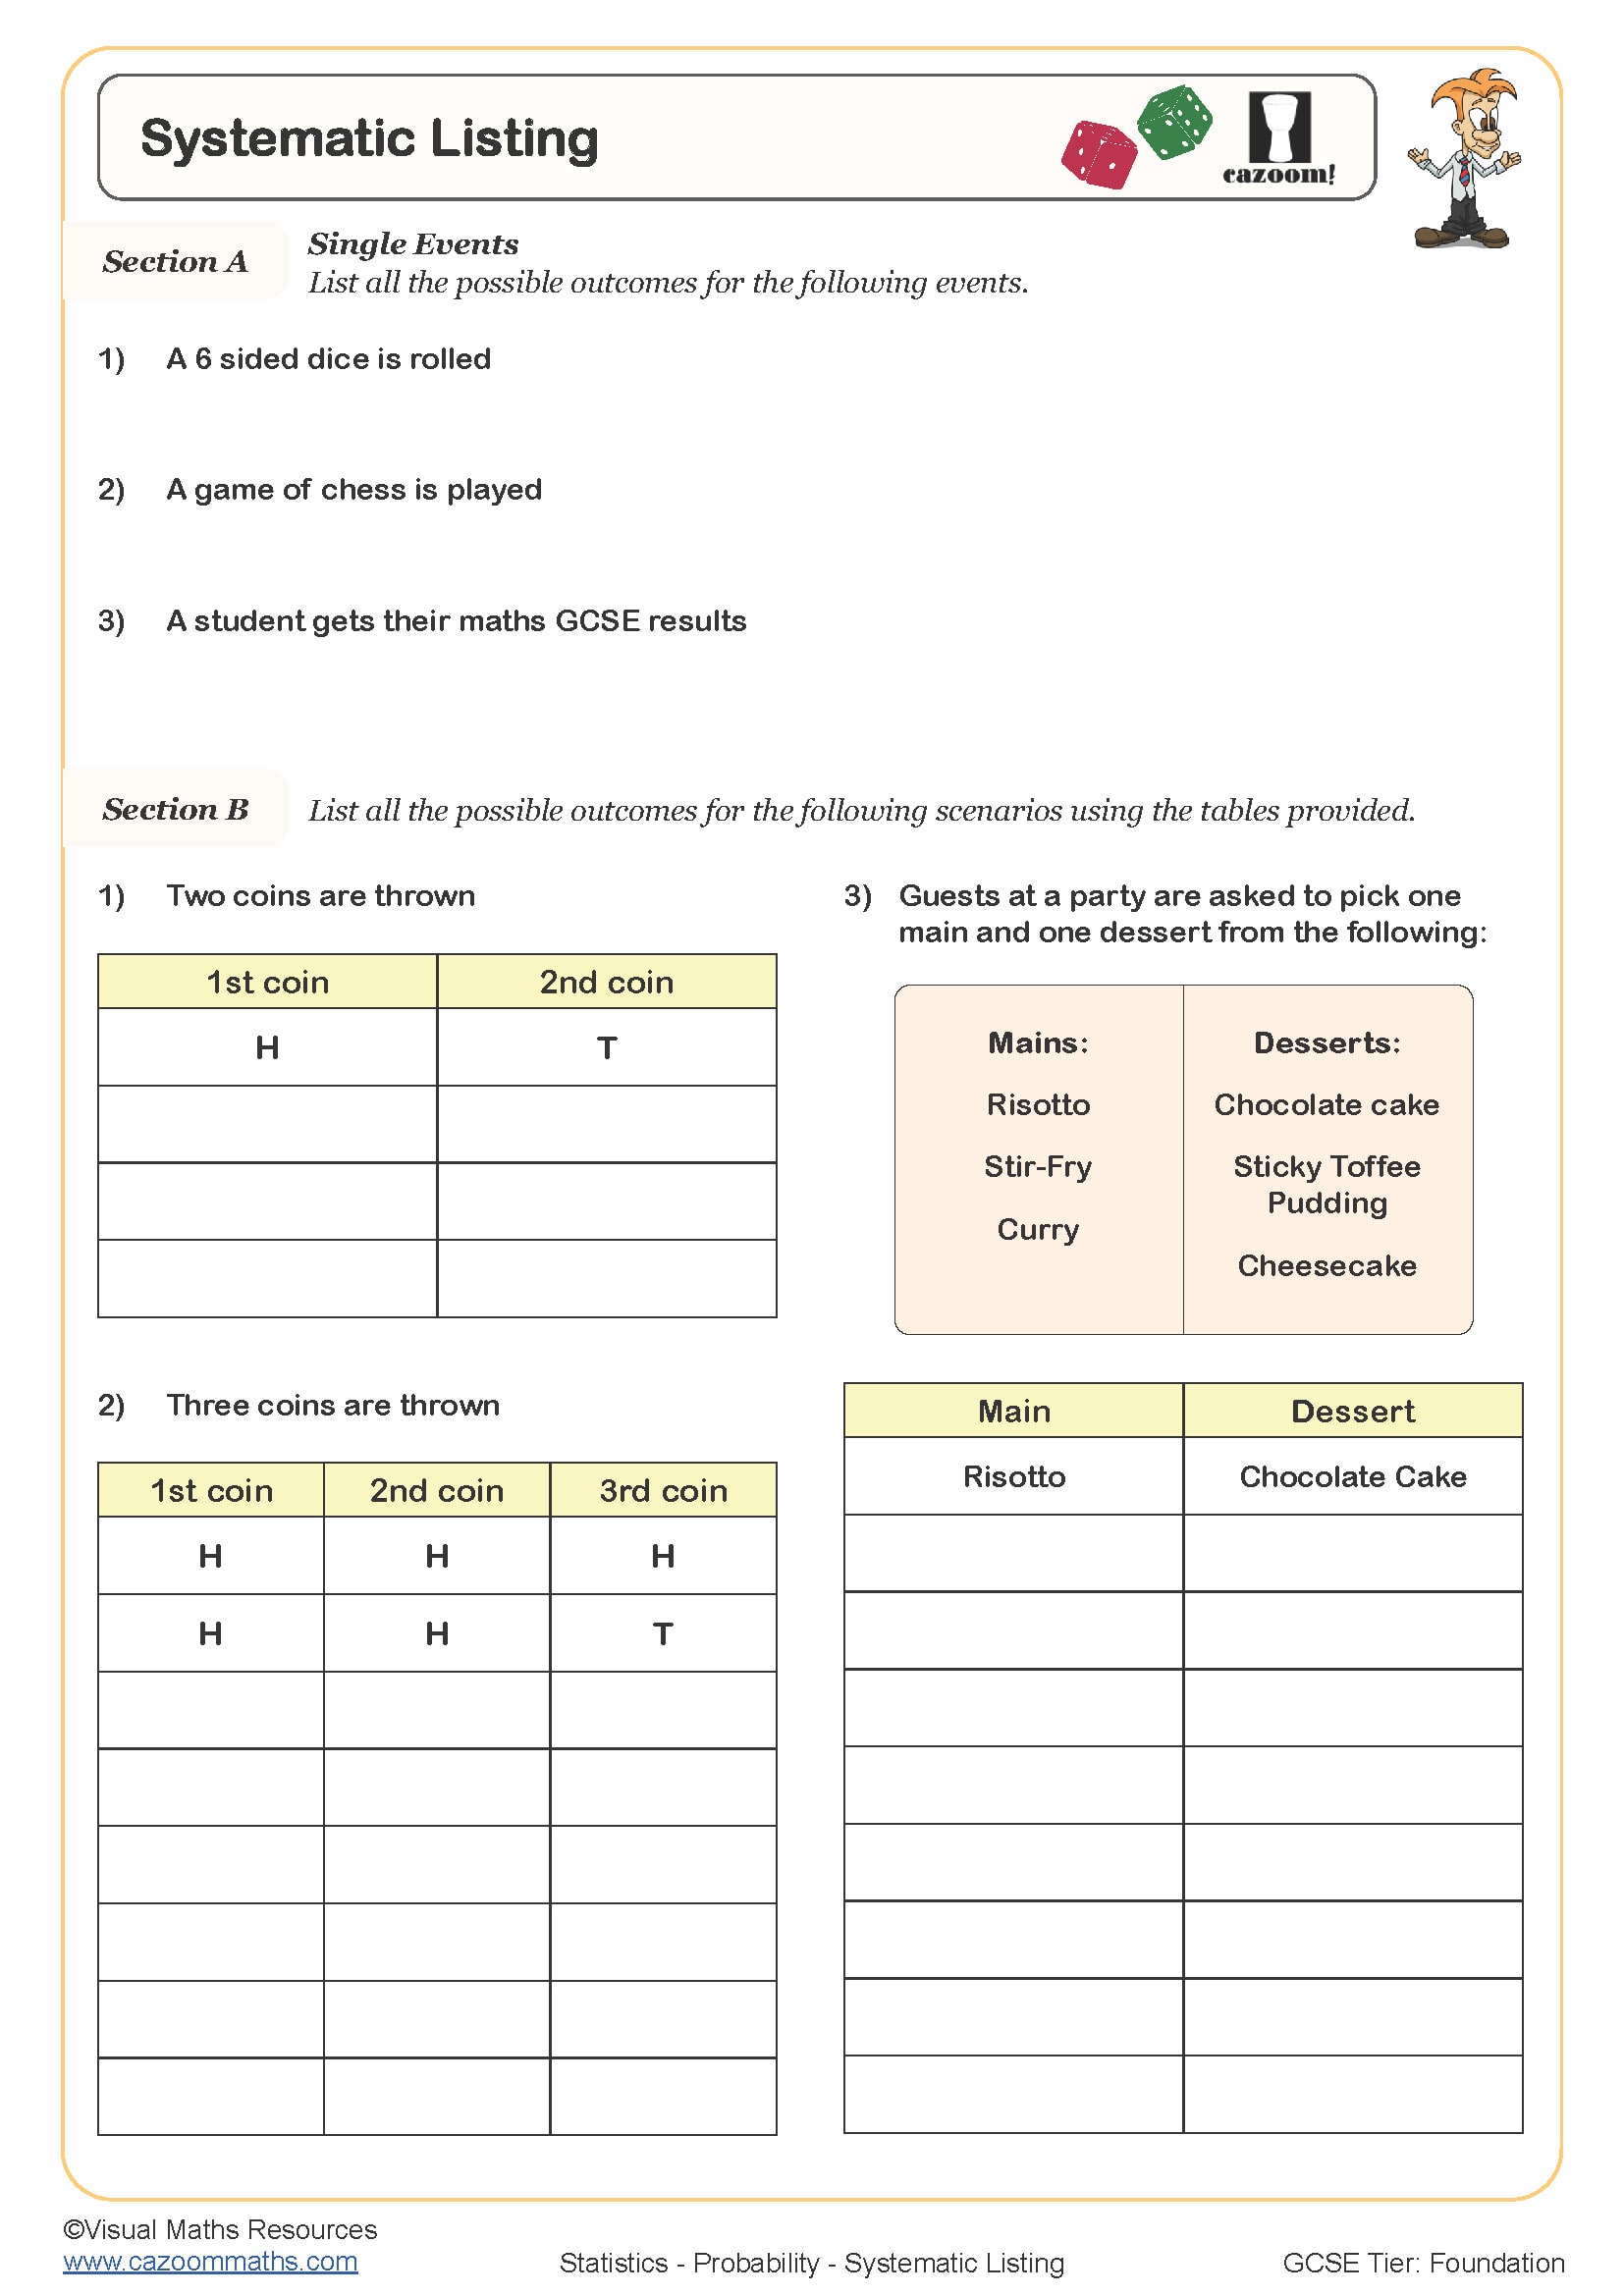
Systematic Listing
Year groups: 8, 9, 10
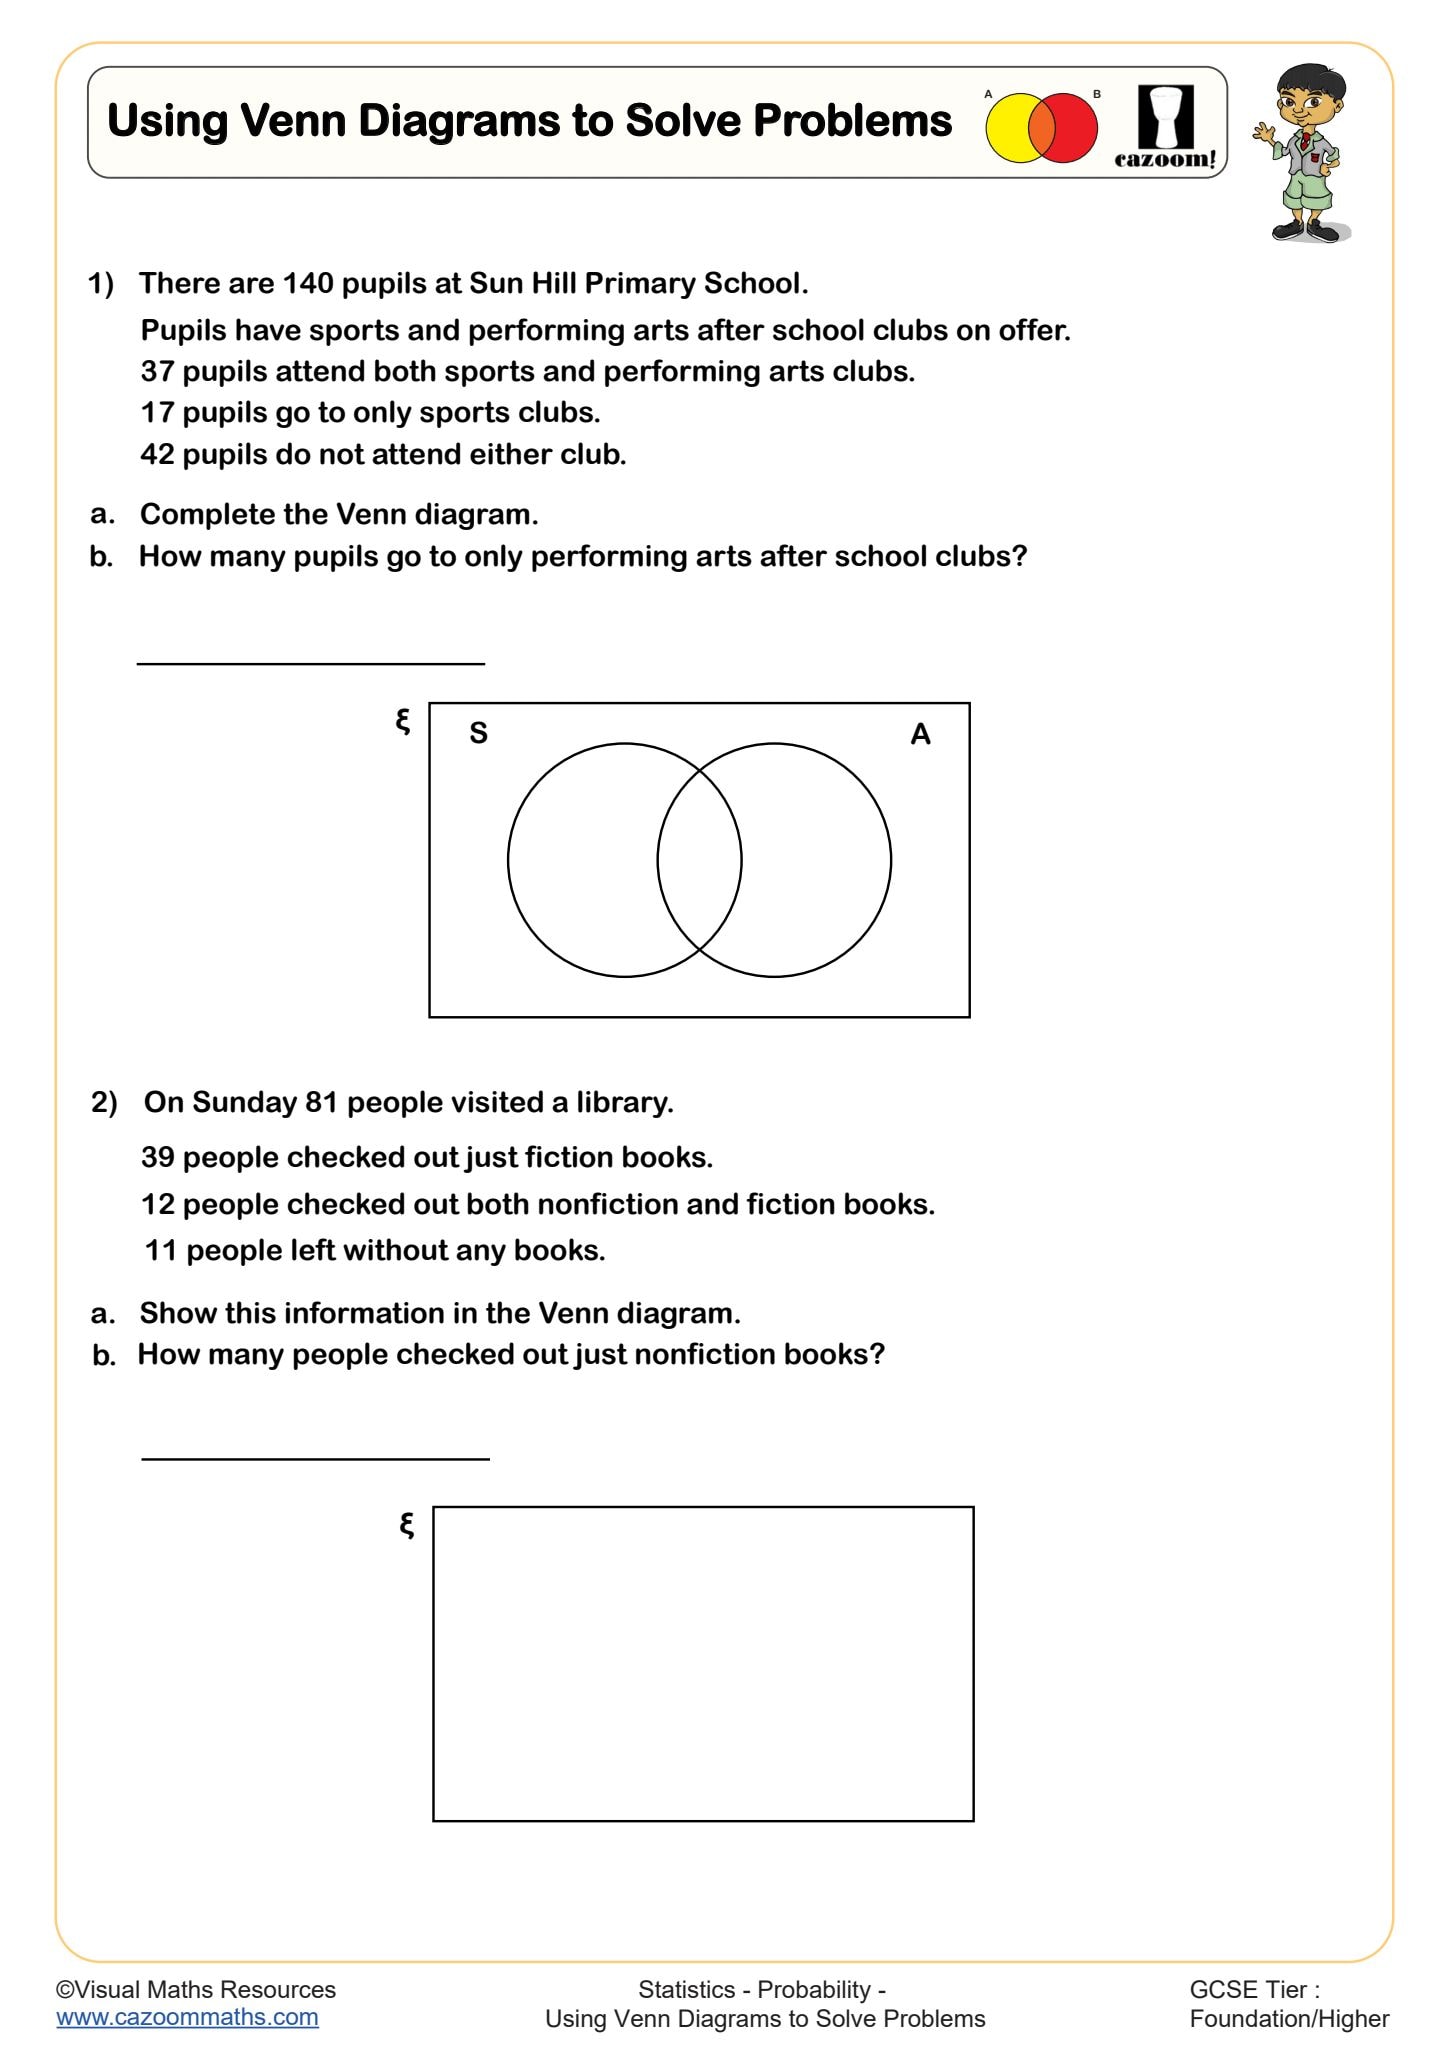
Using Venn Diagrams to Solve Problems
Year groups: 8, 9
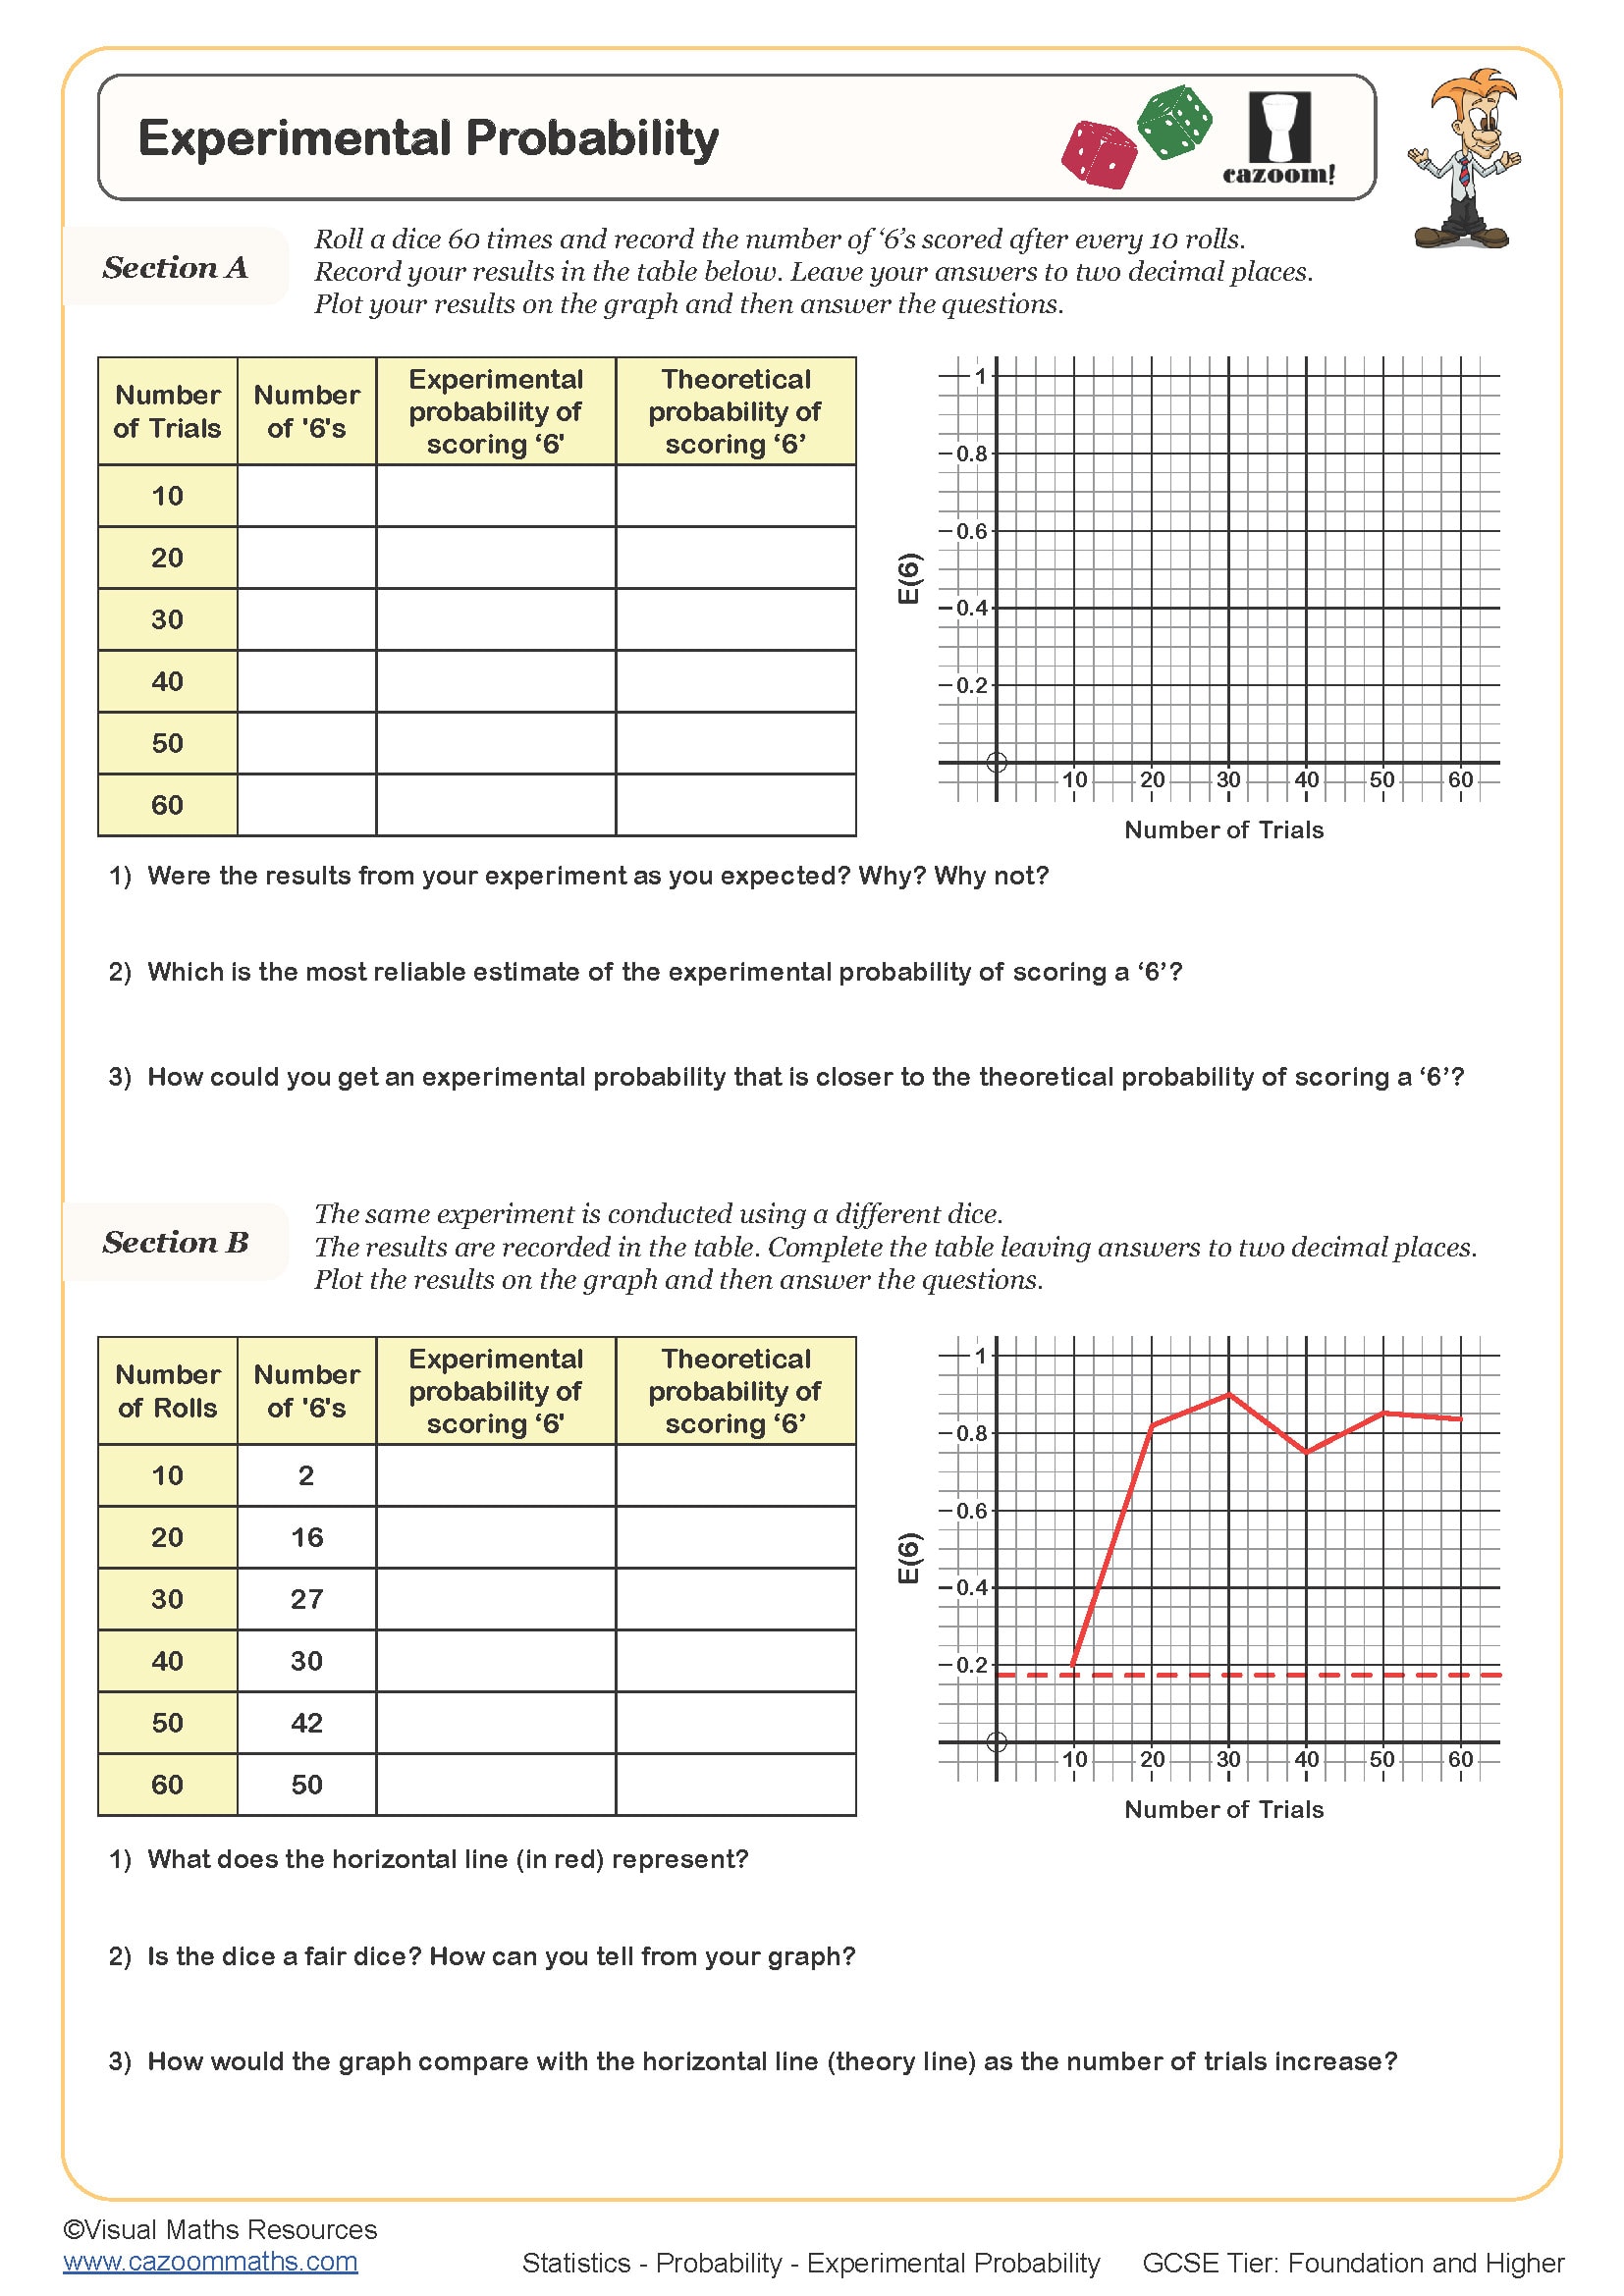
Experimental Probability
Year groups: 9, 10, 11
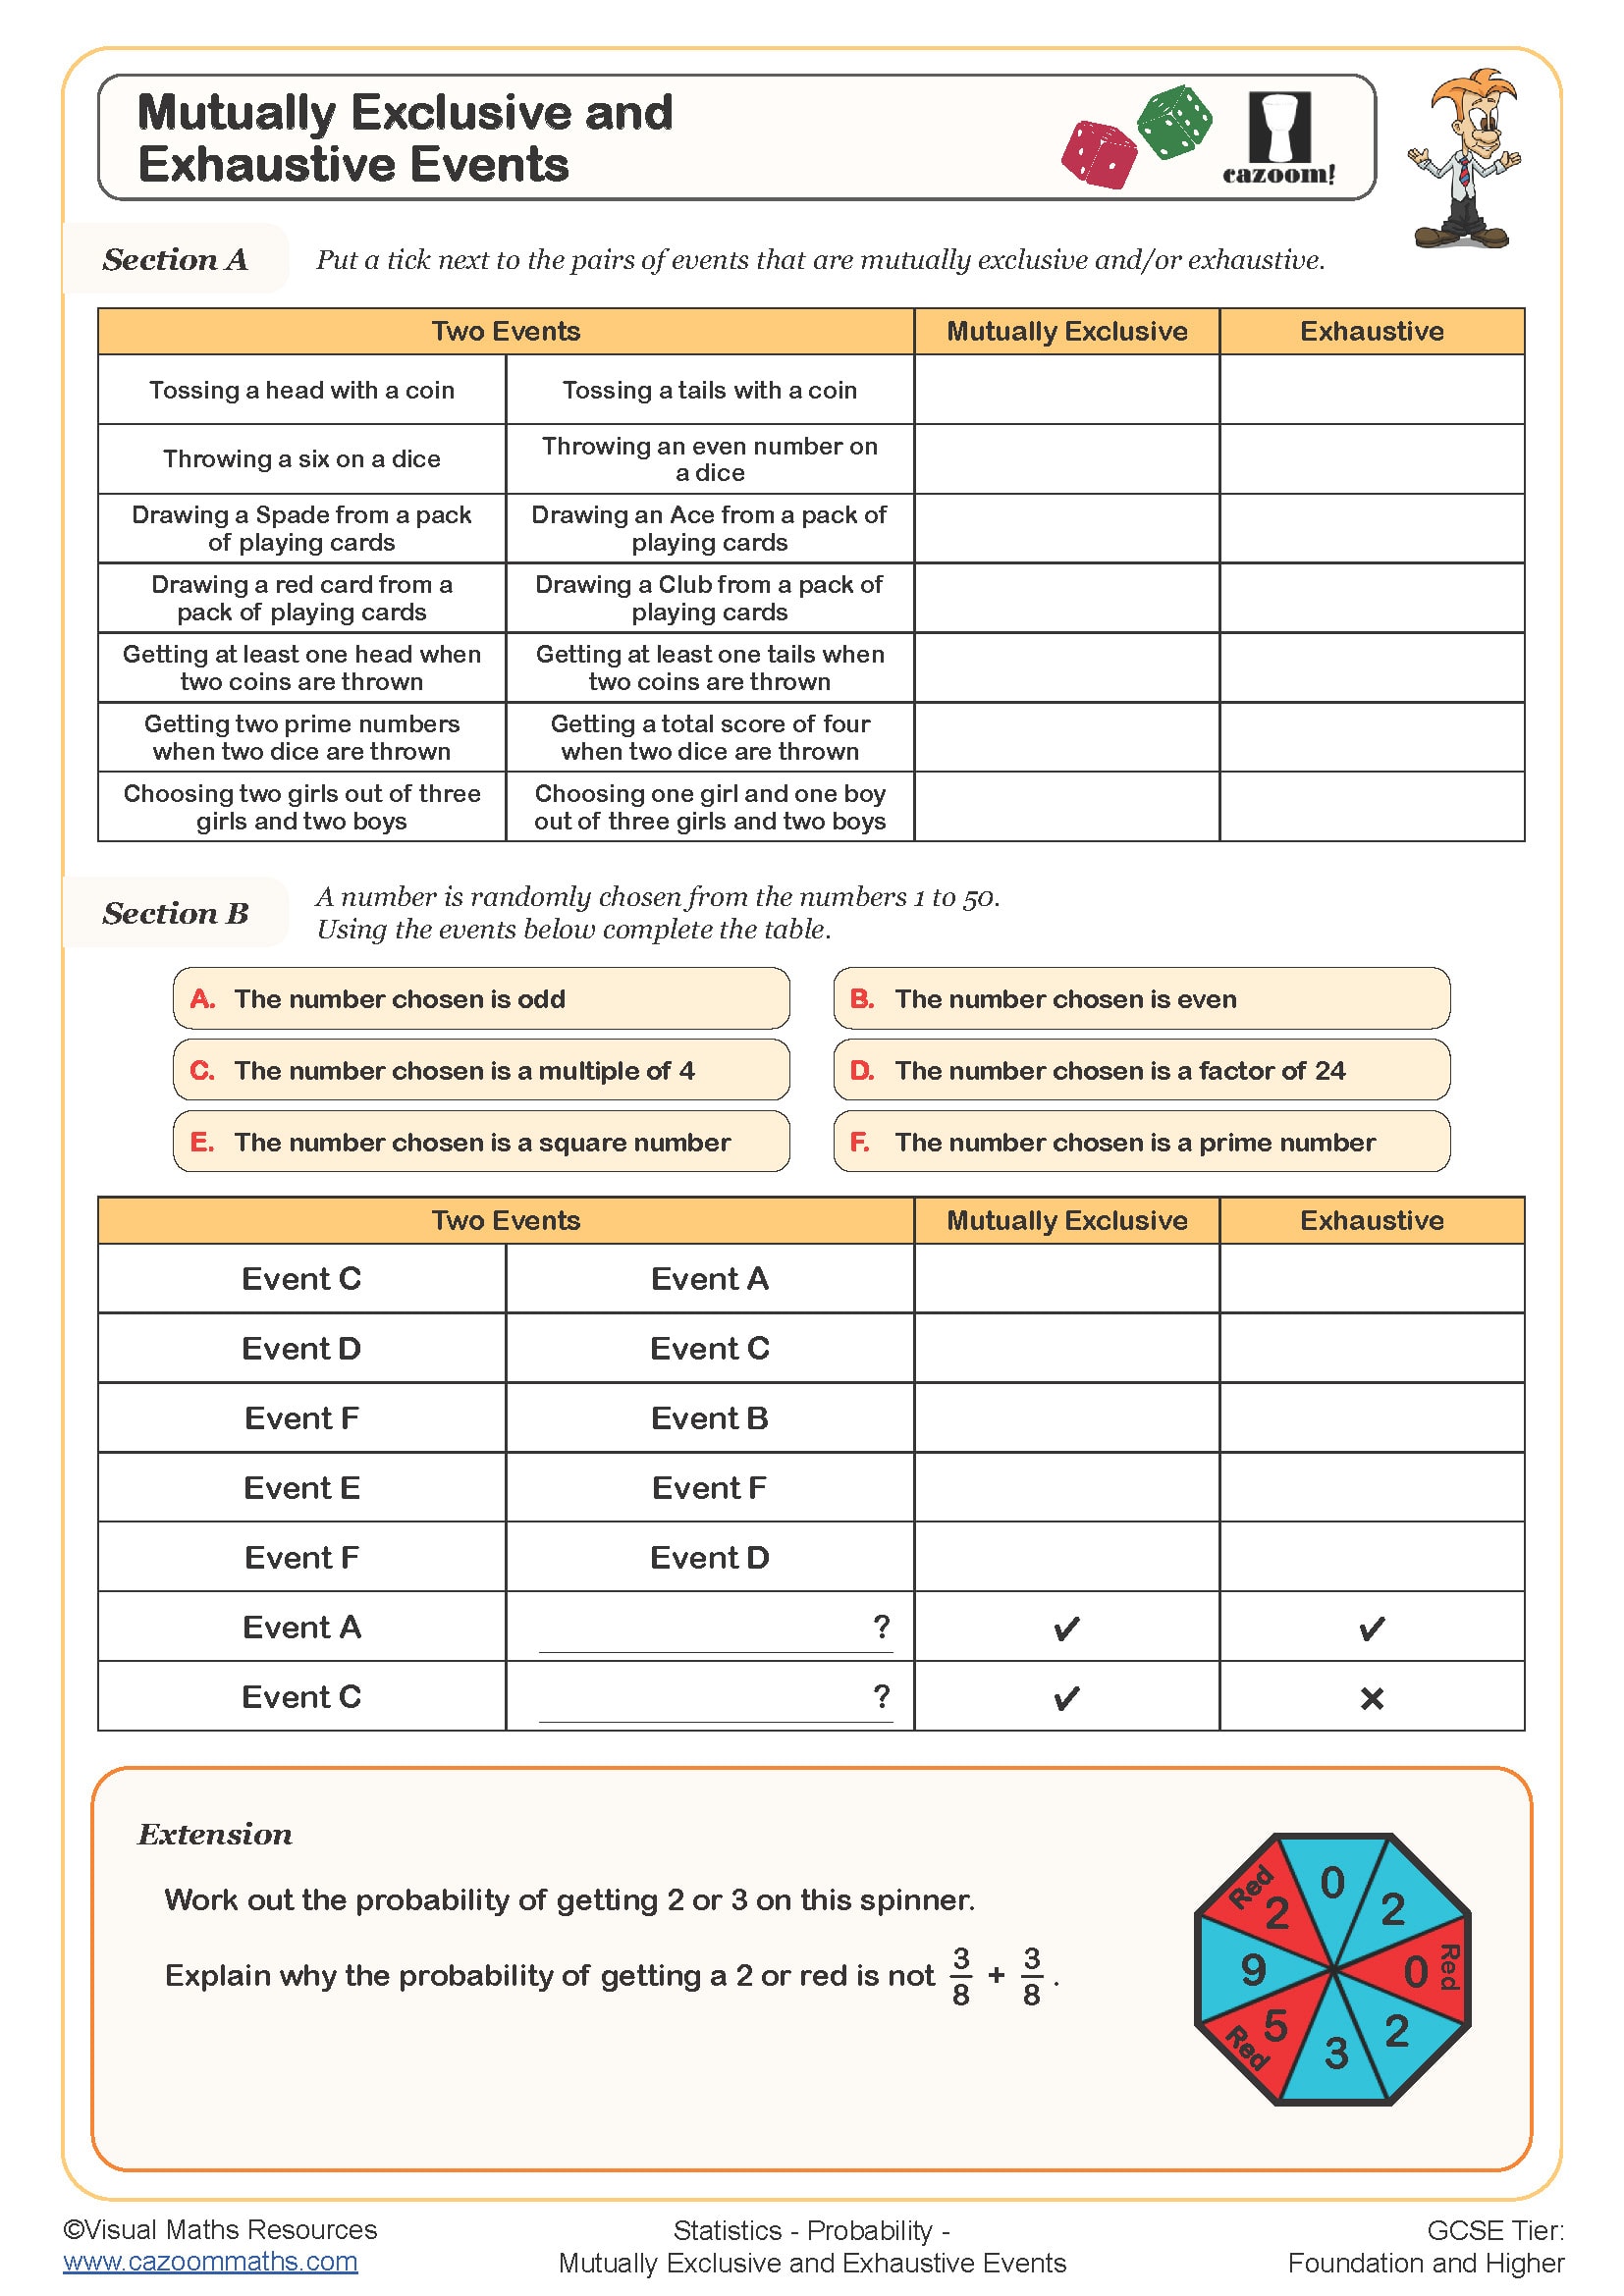
Mutually Exclusive and Exhaustive Events
Year groups: 9, 10, 11
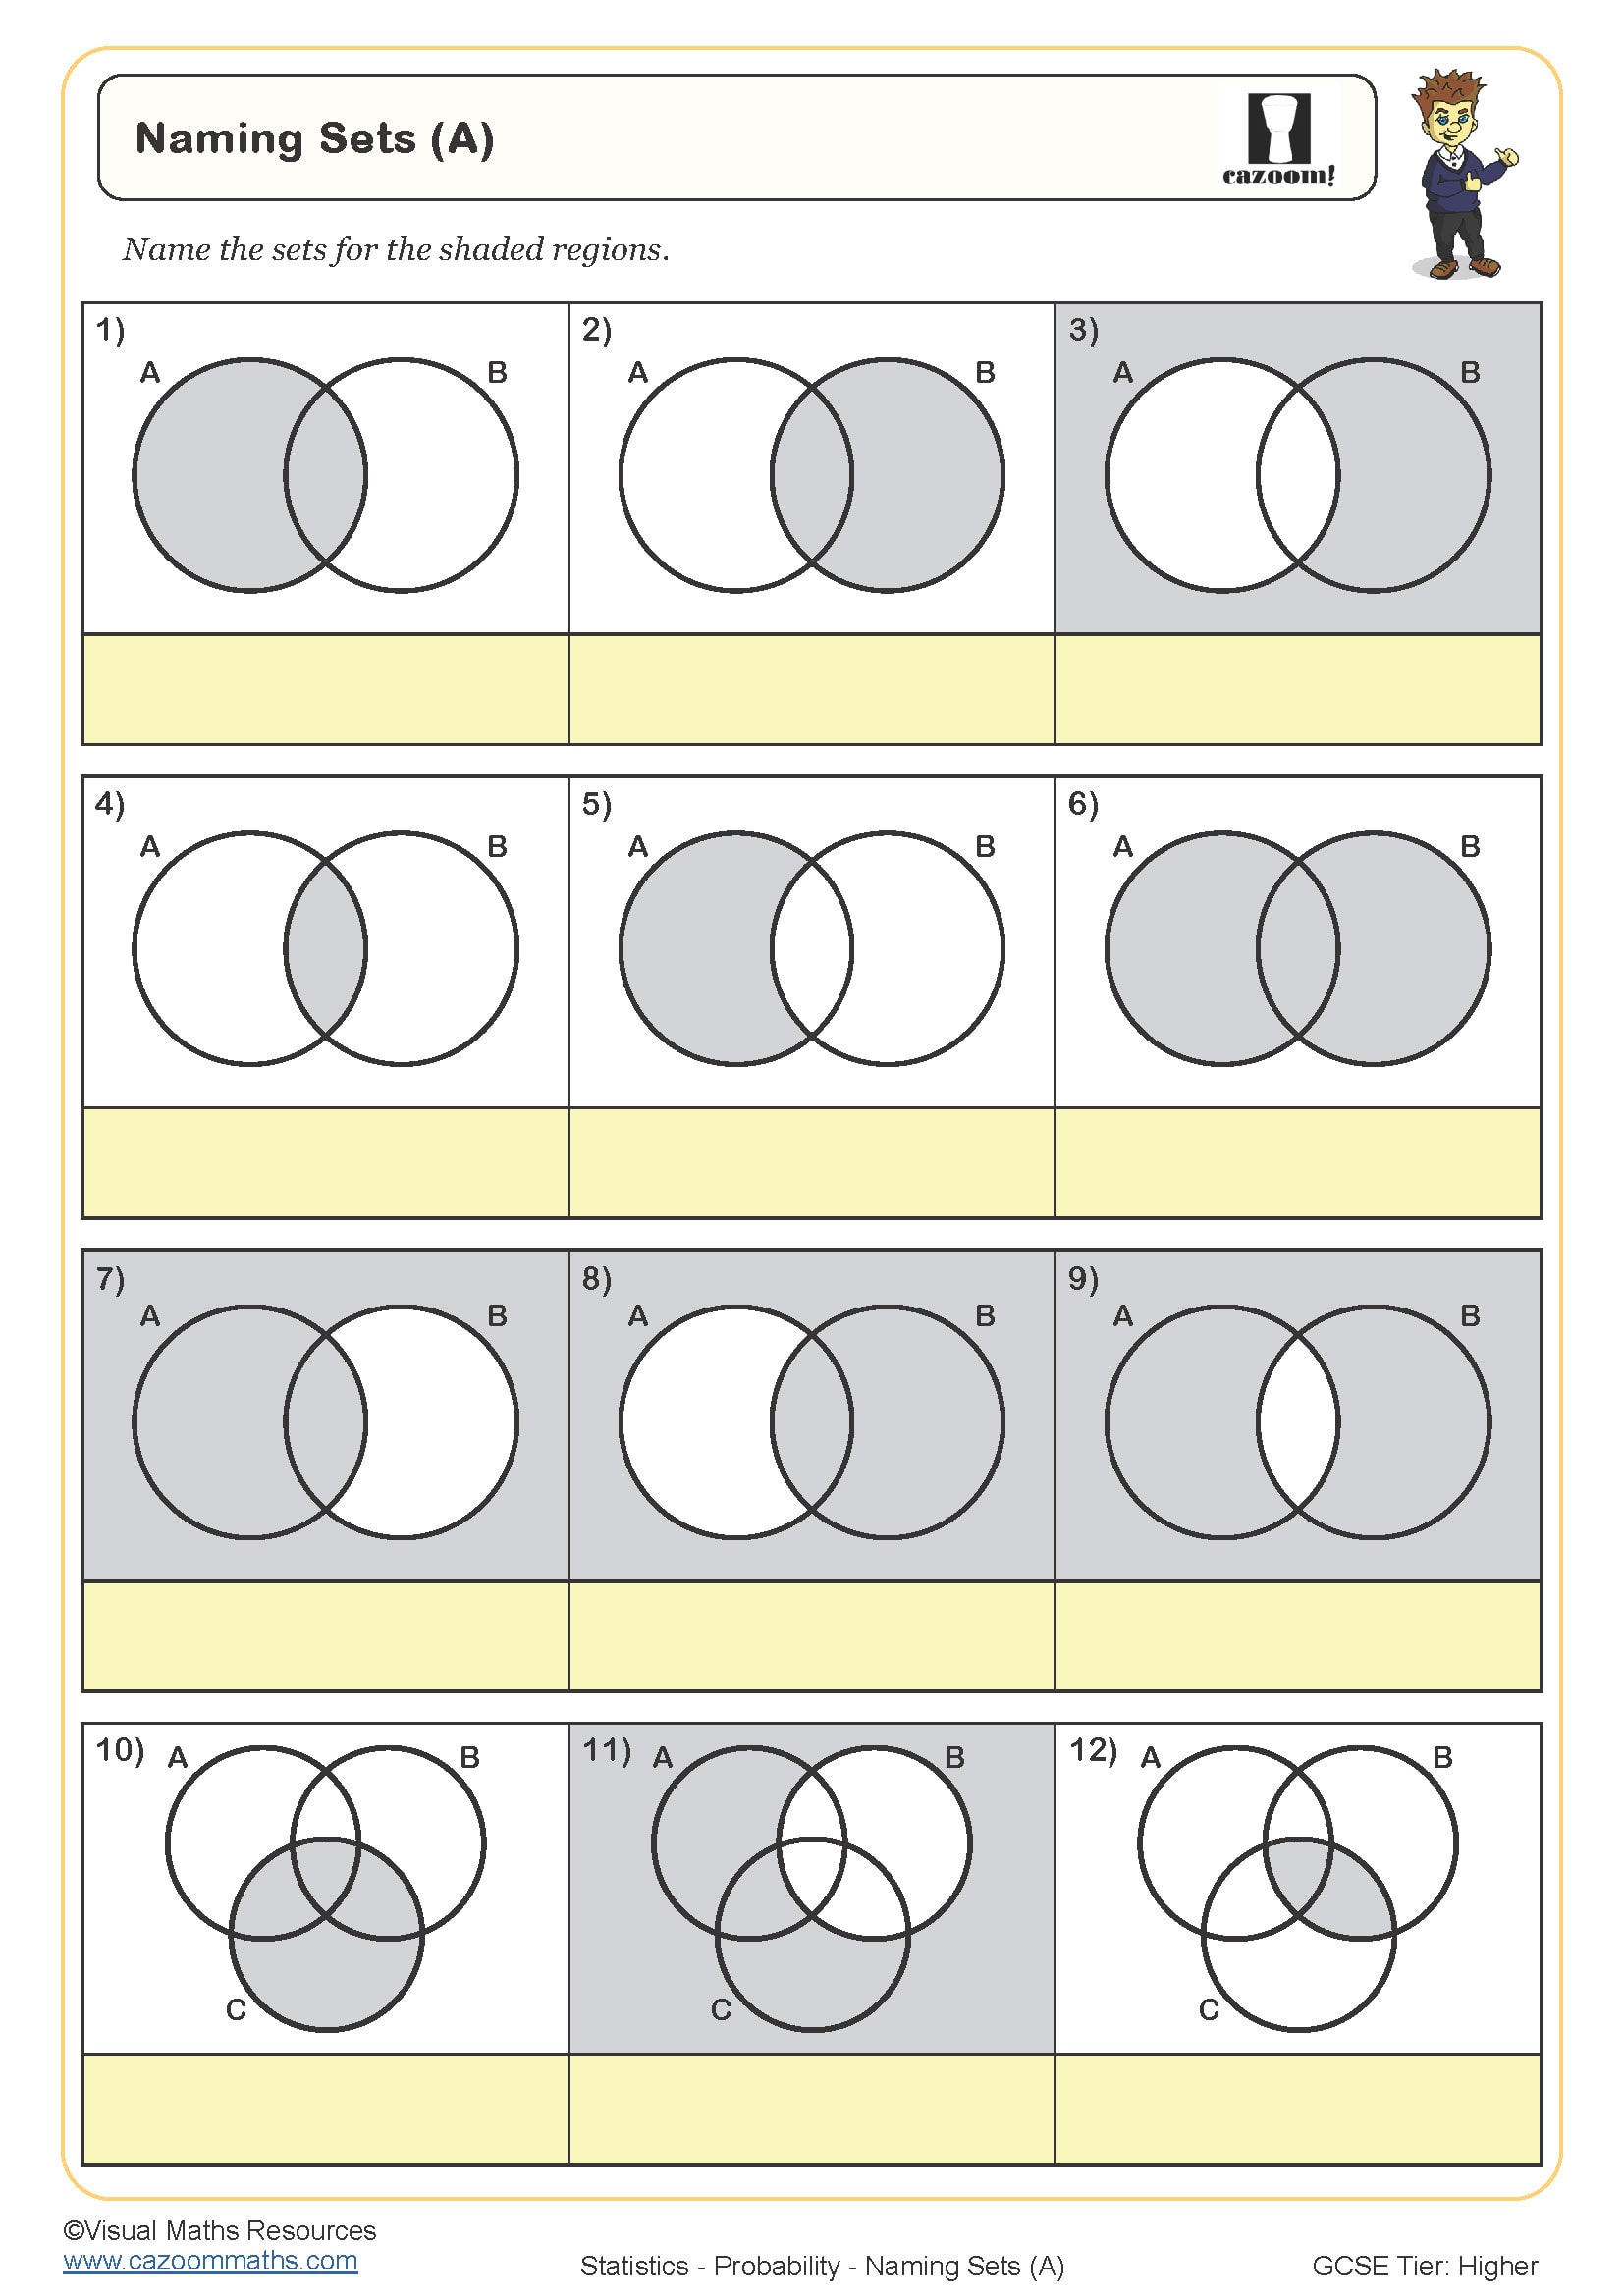
Naming Sets (A)
Year groups: 9, 10
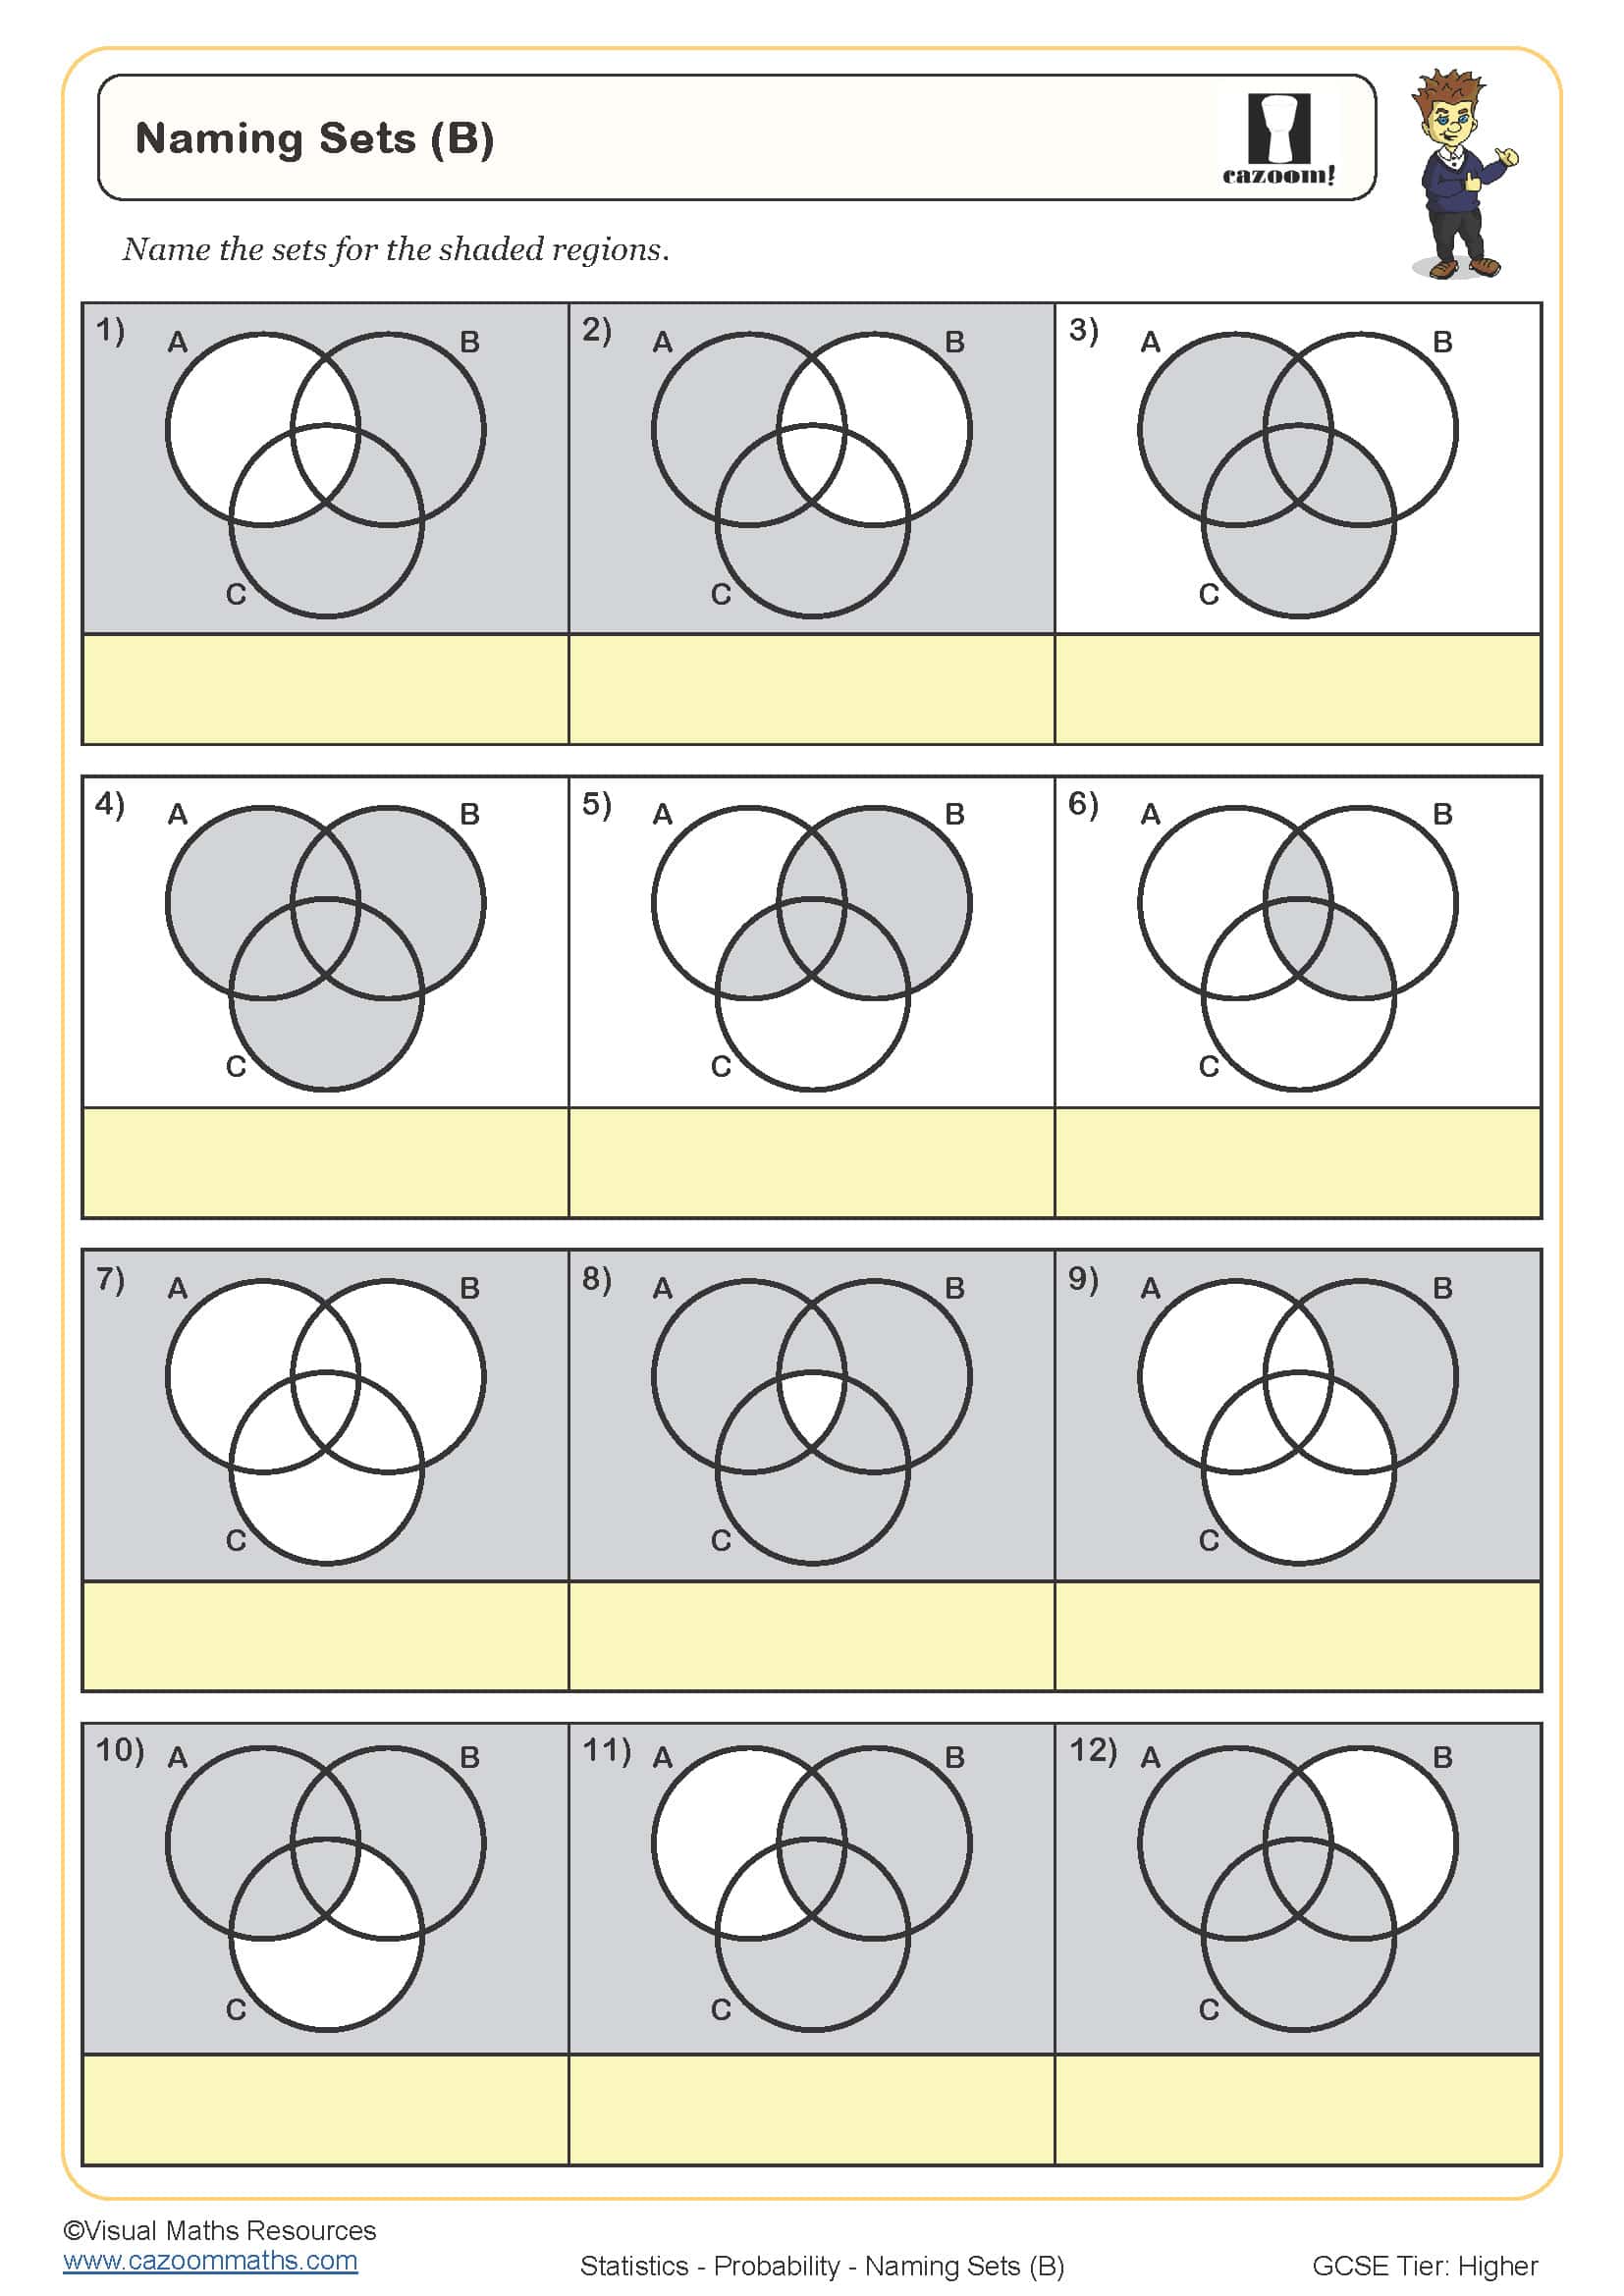
Naming Sets (B)
Year groups: 9, 10
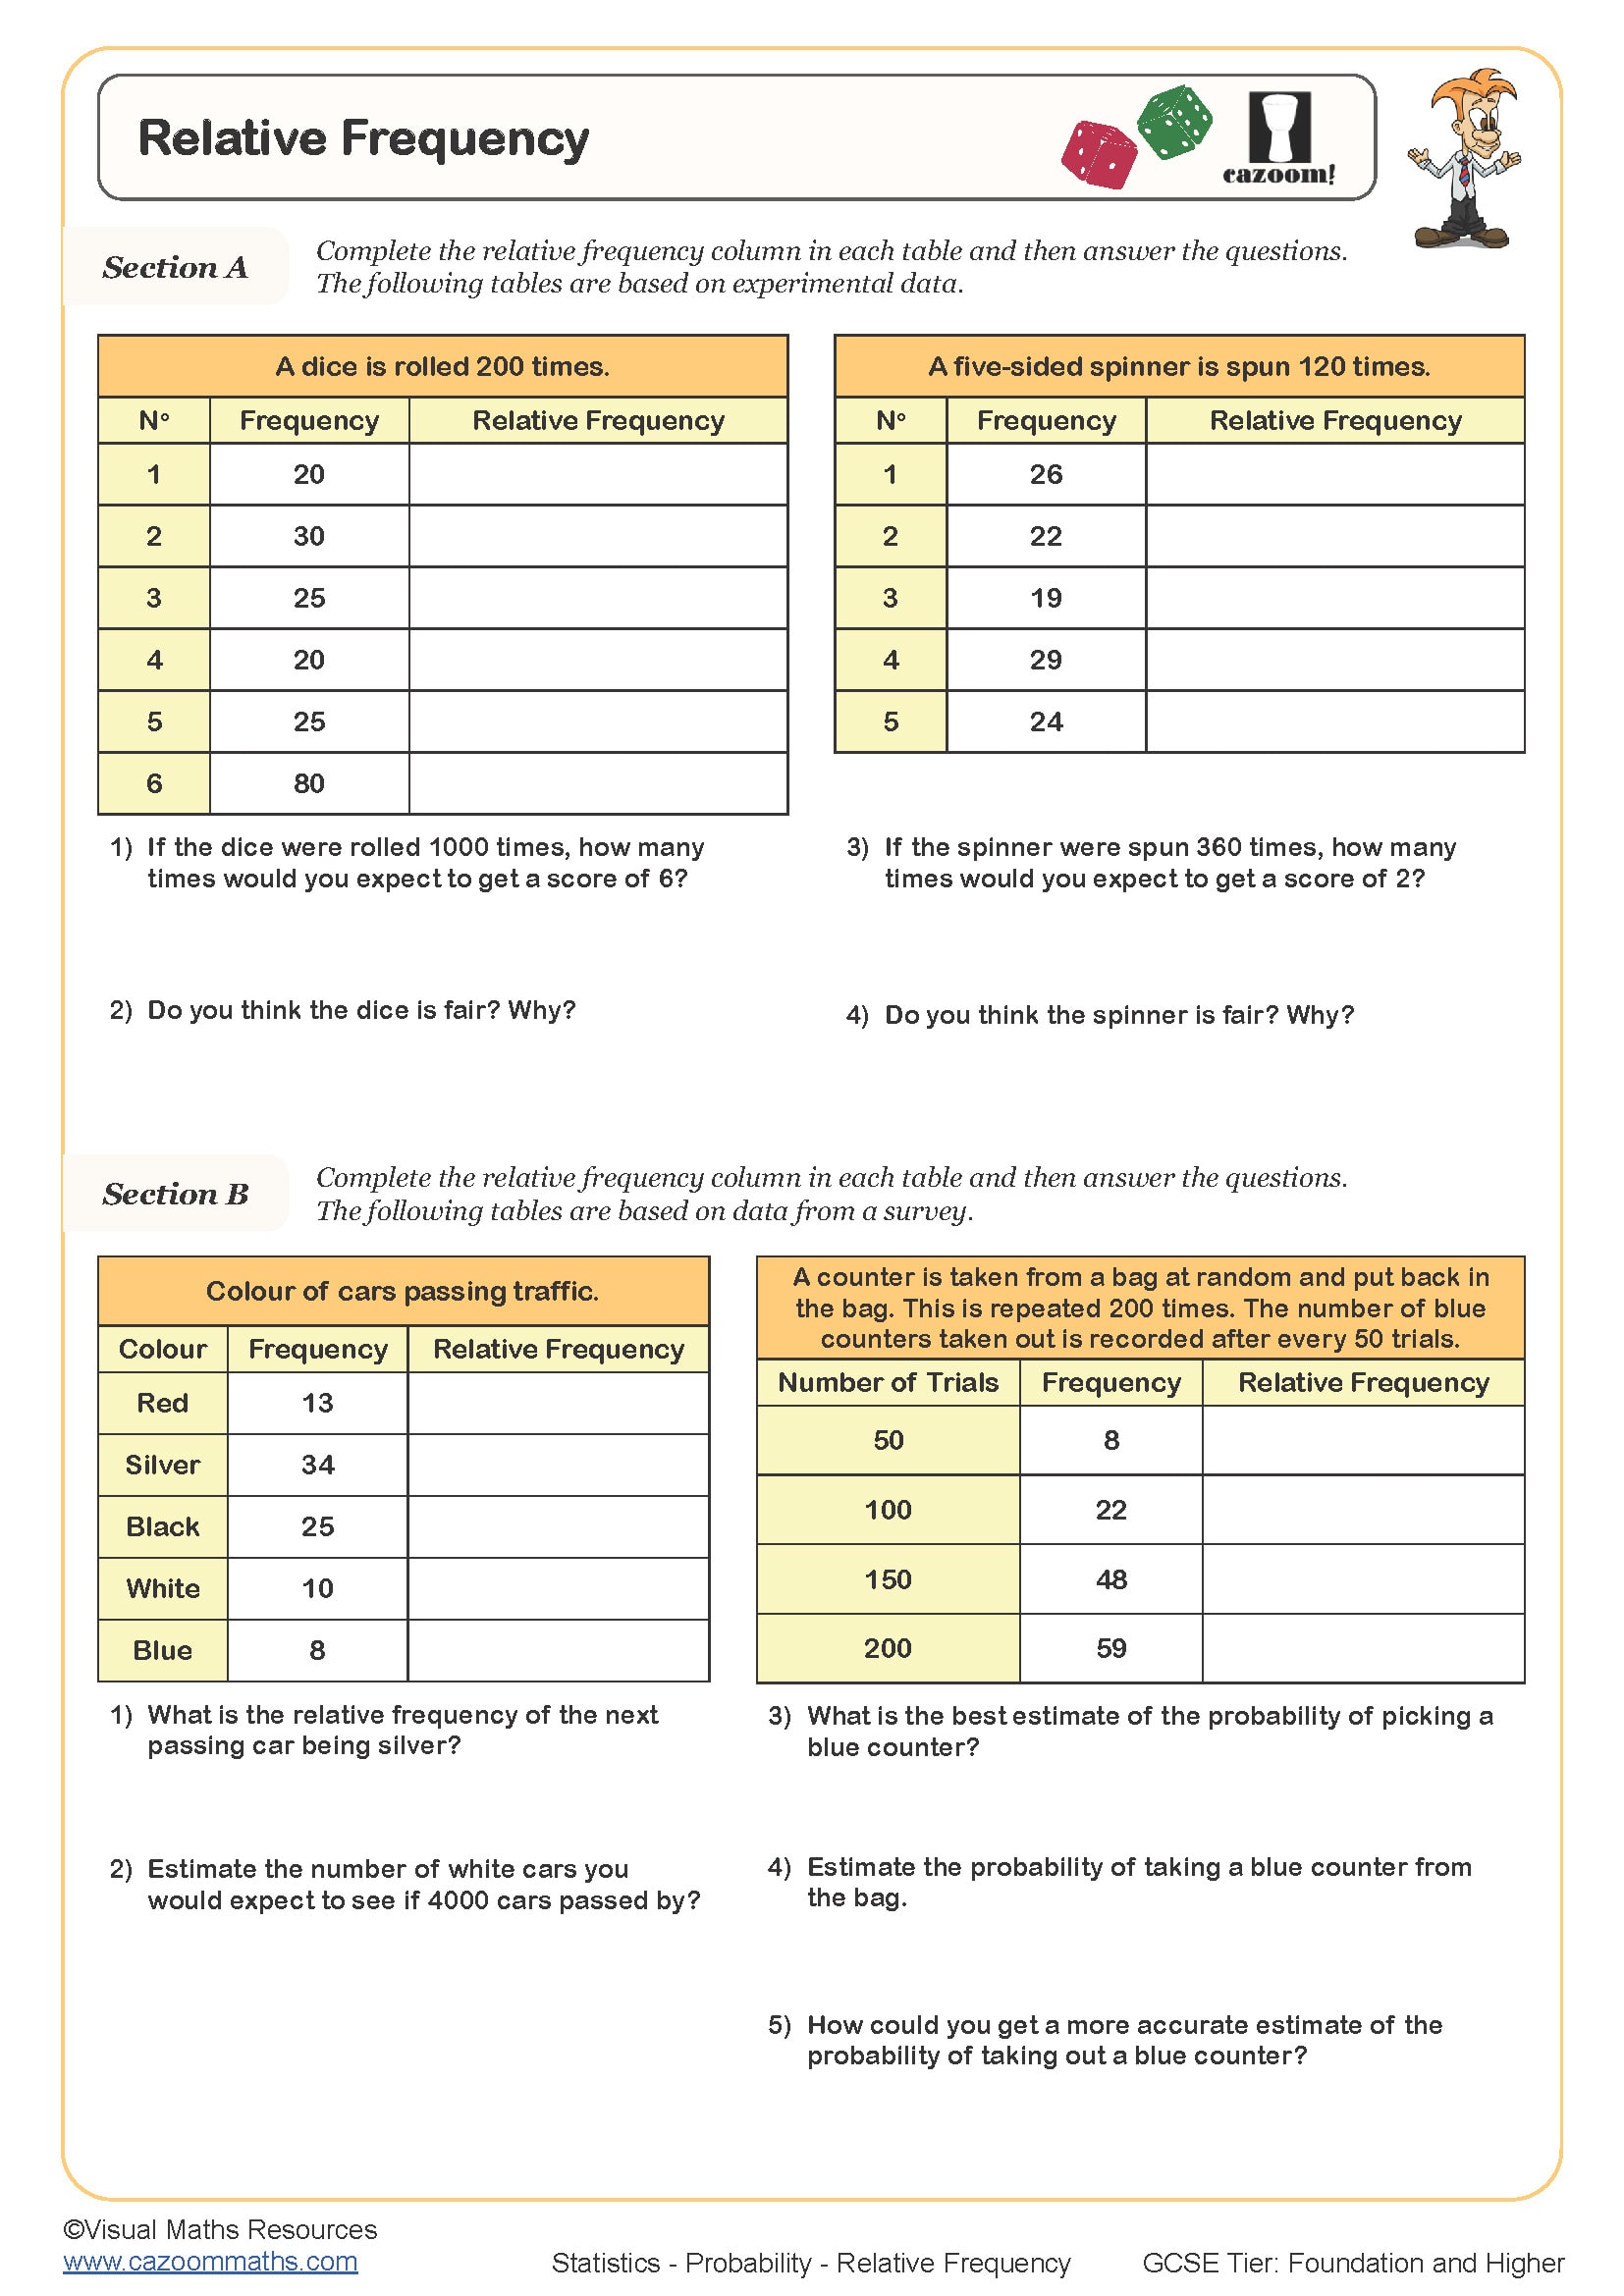
Relative Frequency
Year groups: 9, 10, 11
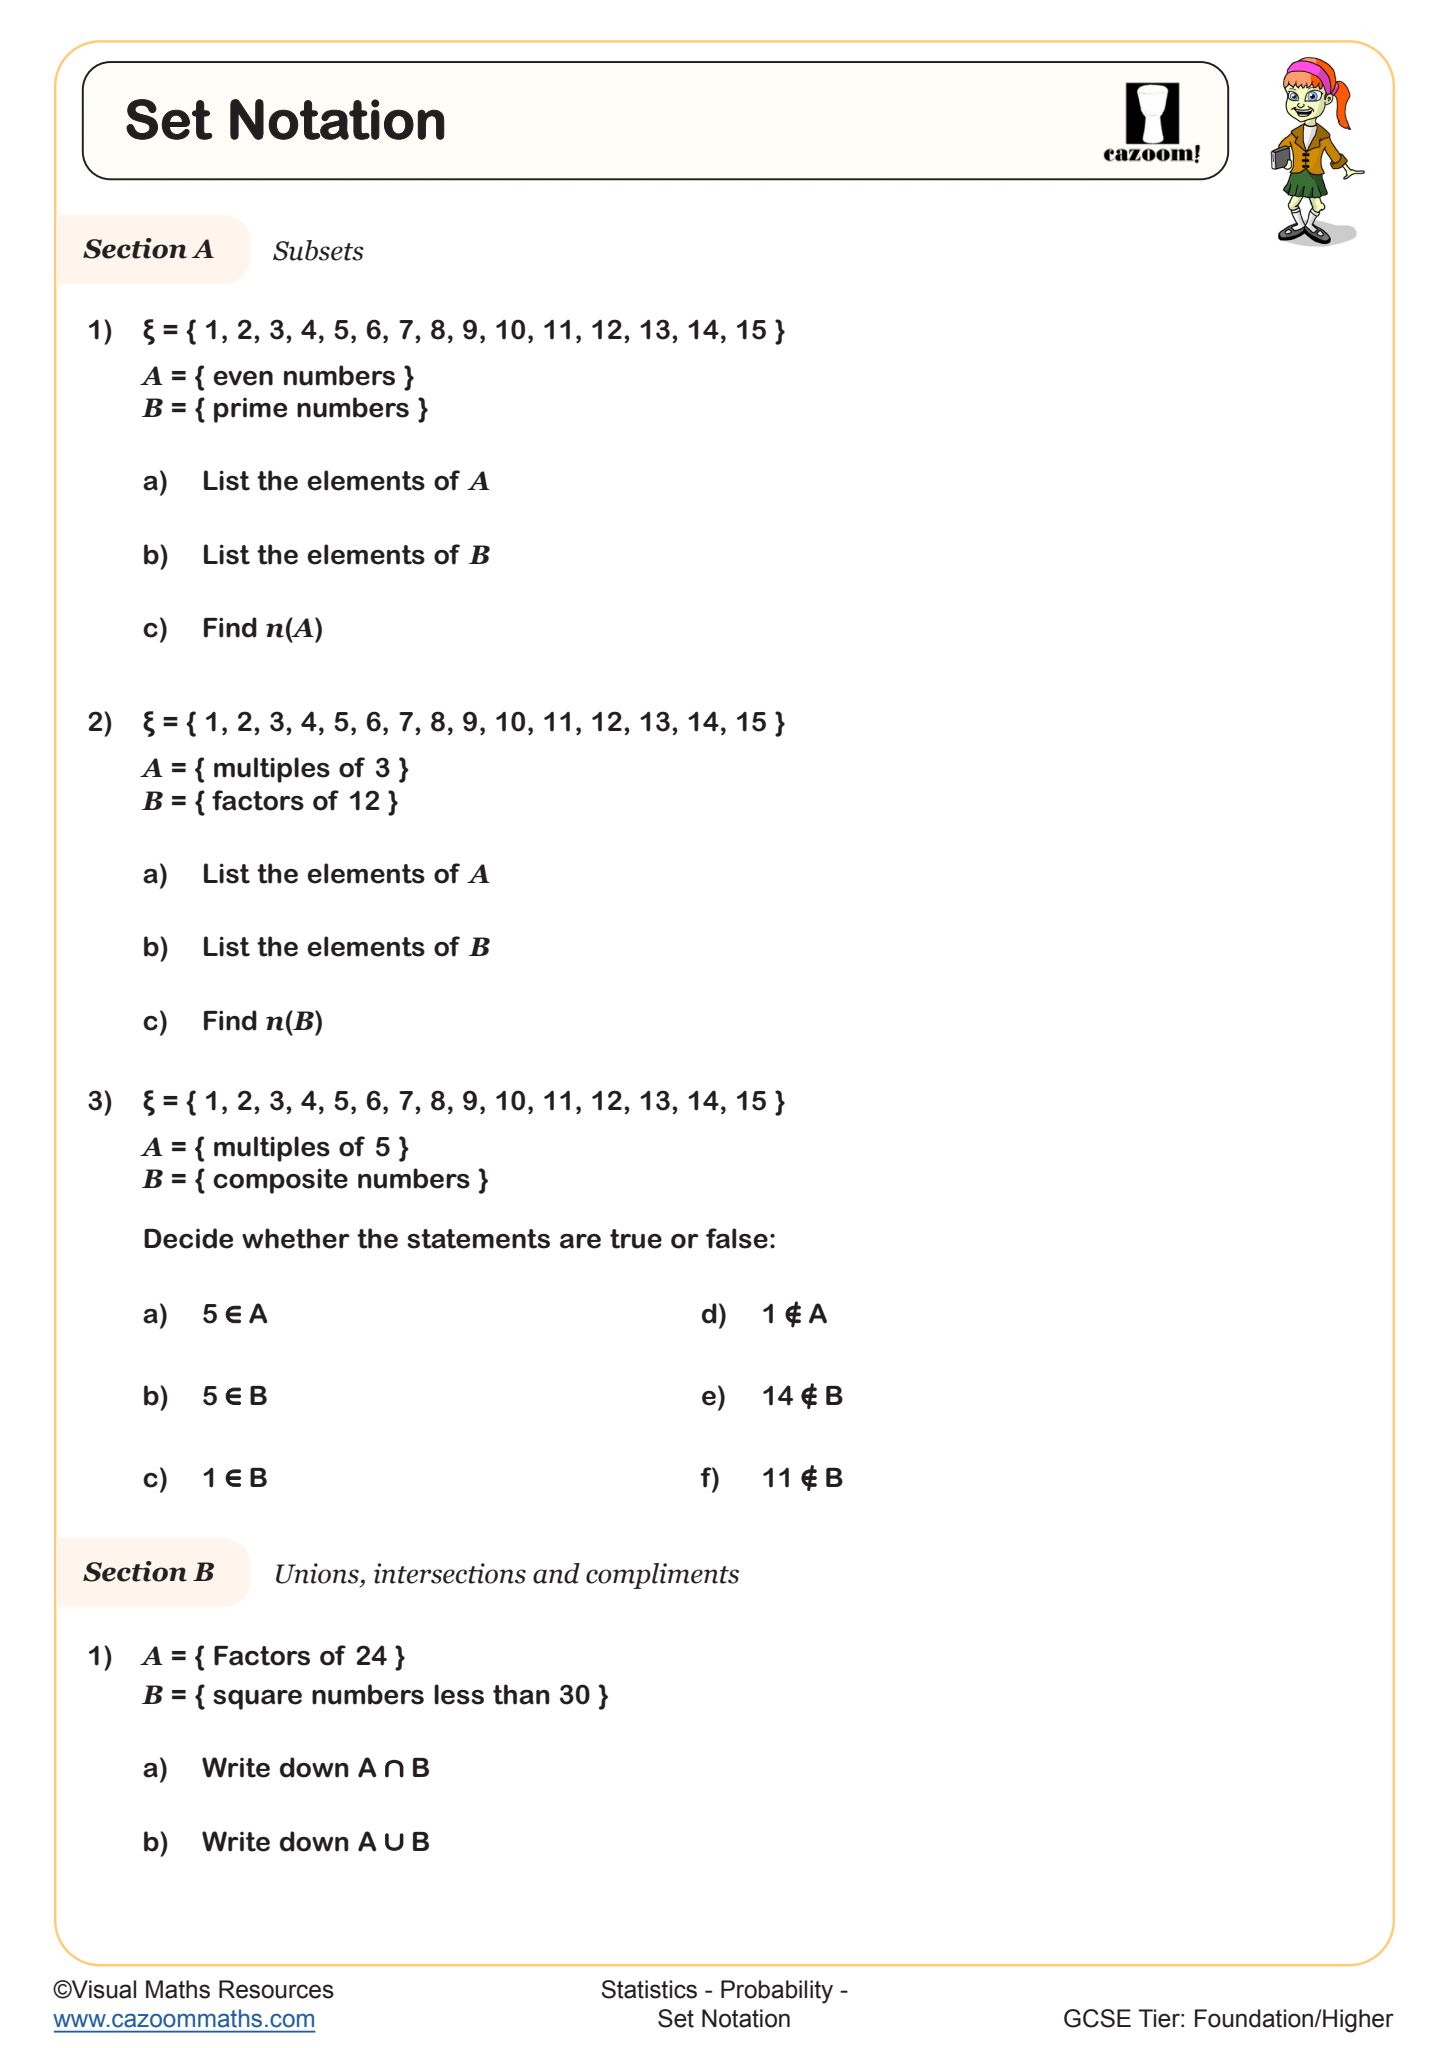
Set Notation
Year groups: 9, 10
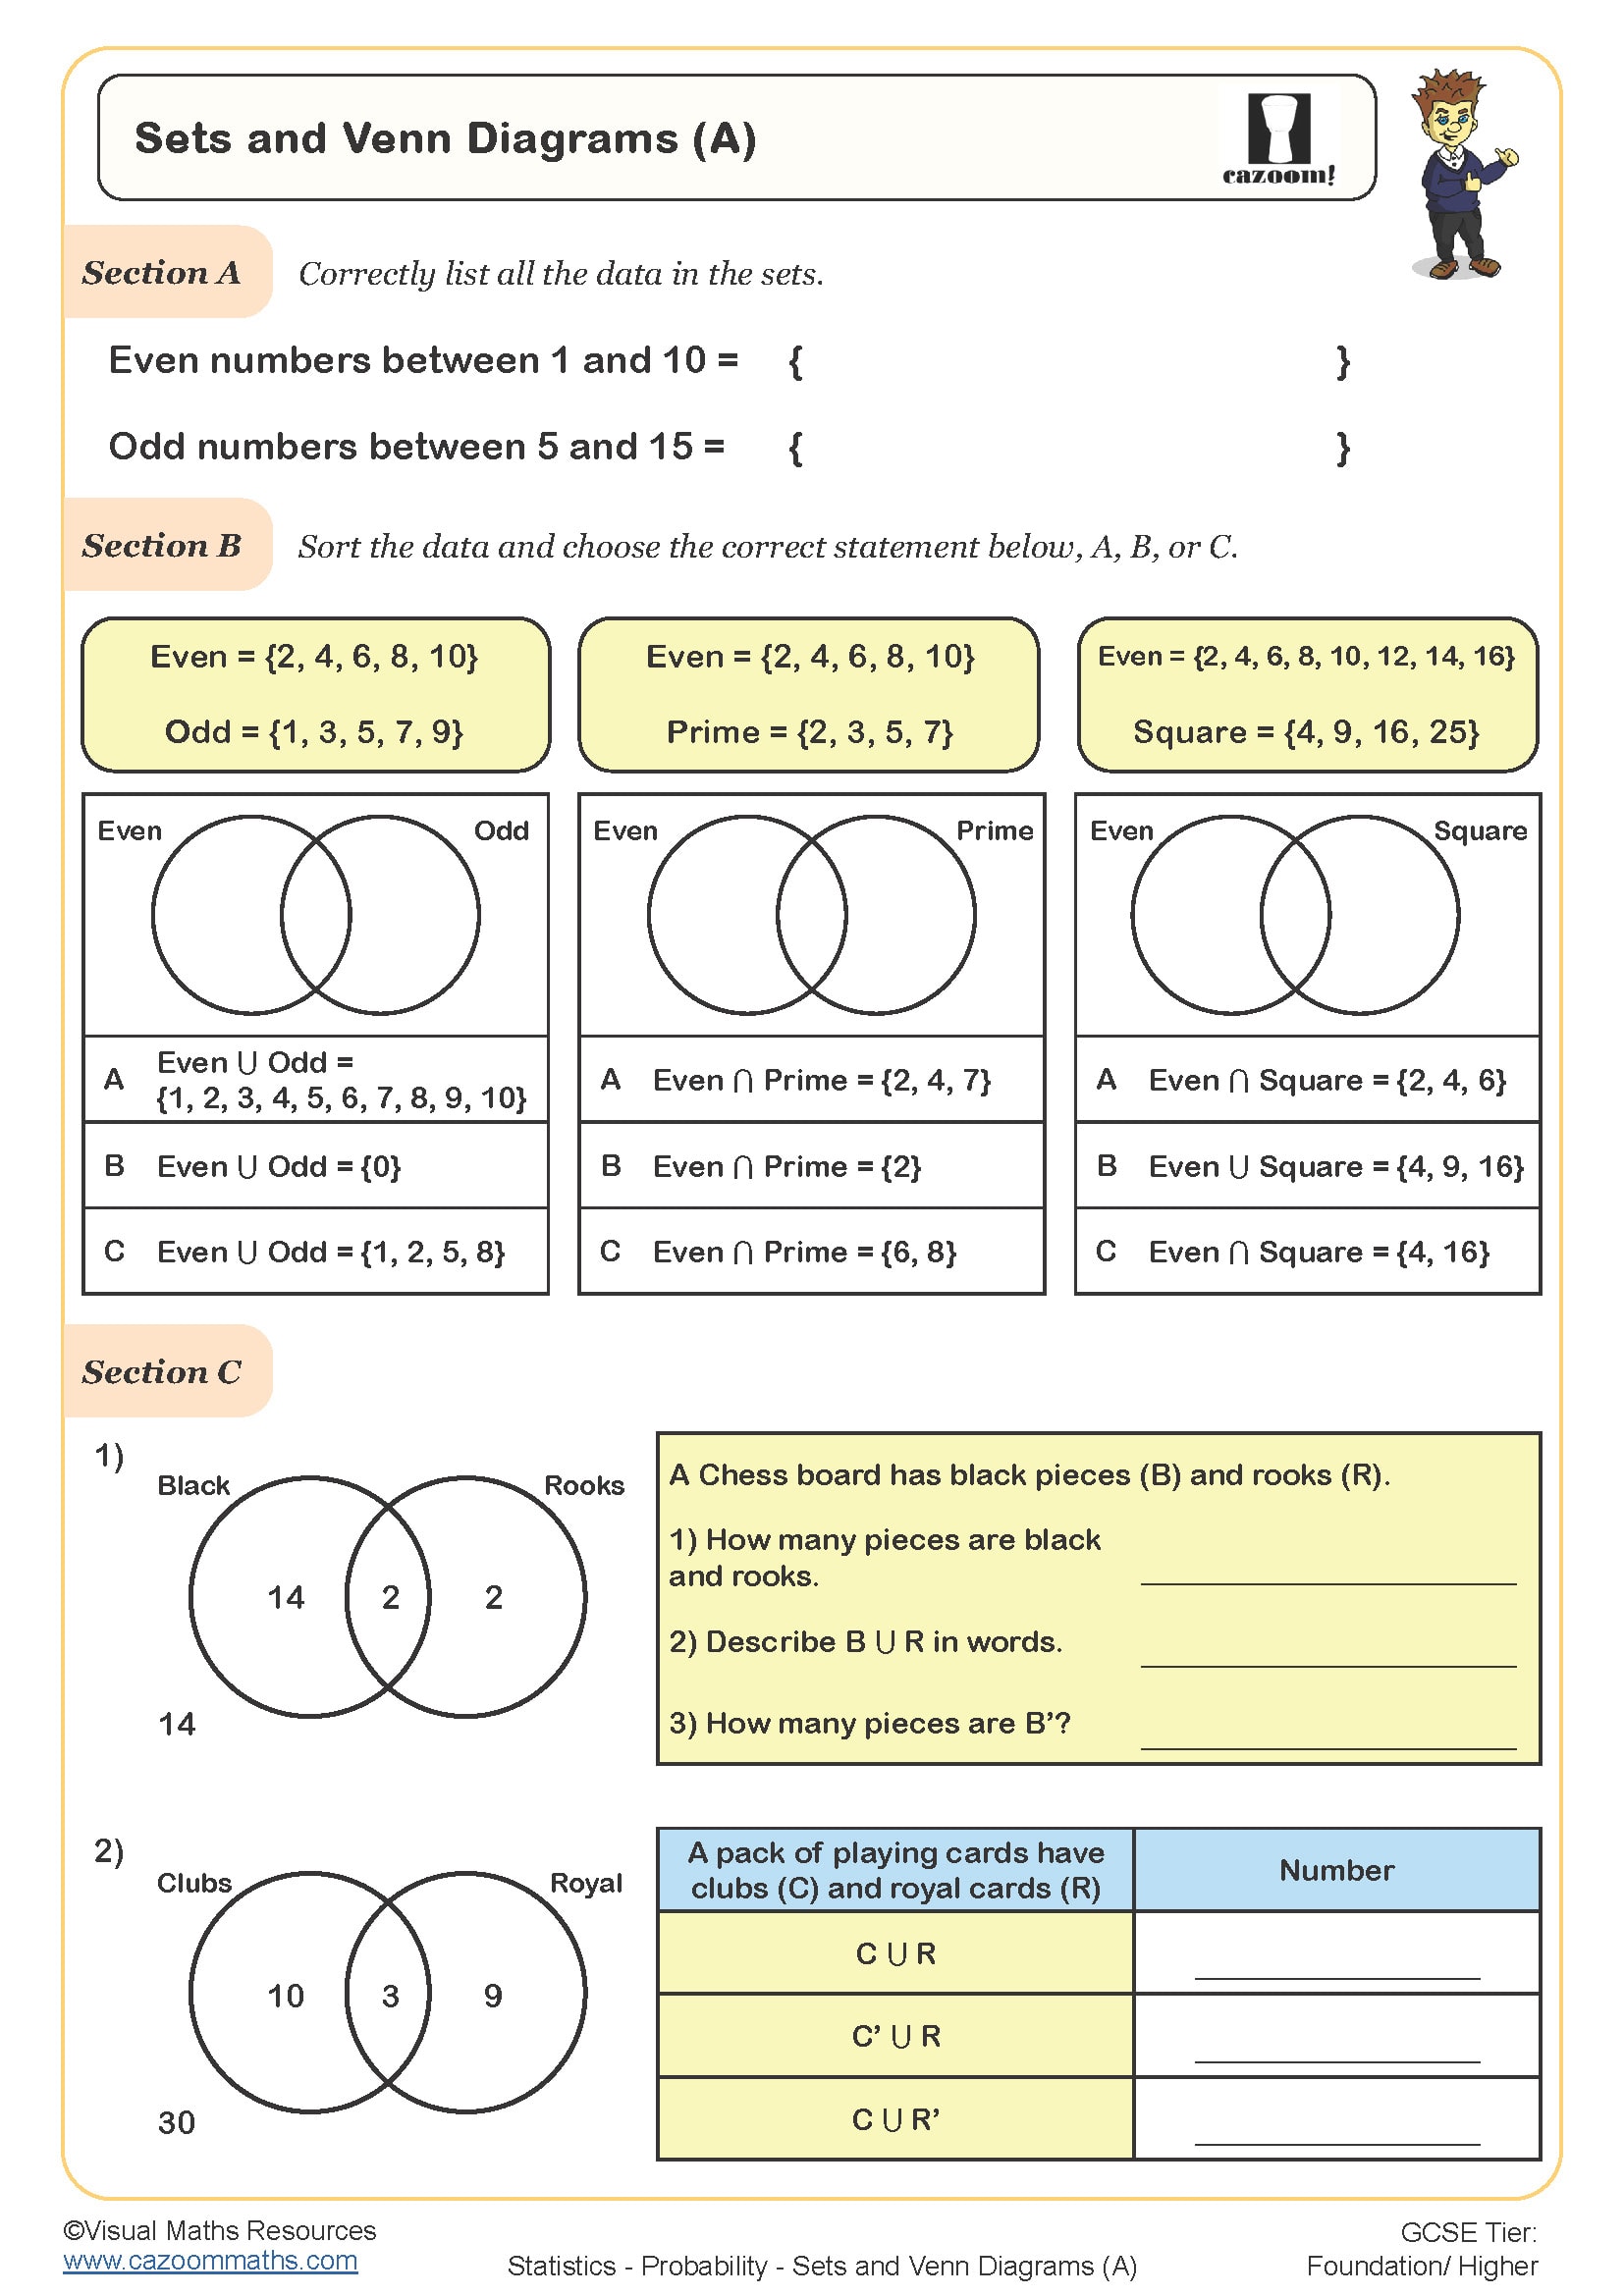
Sets and Venn Diagrams (A)
Year groups: 9, 10
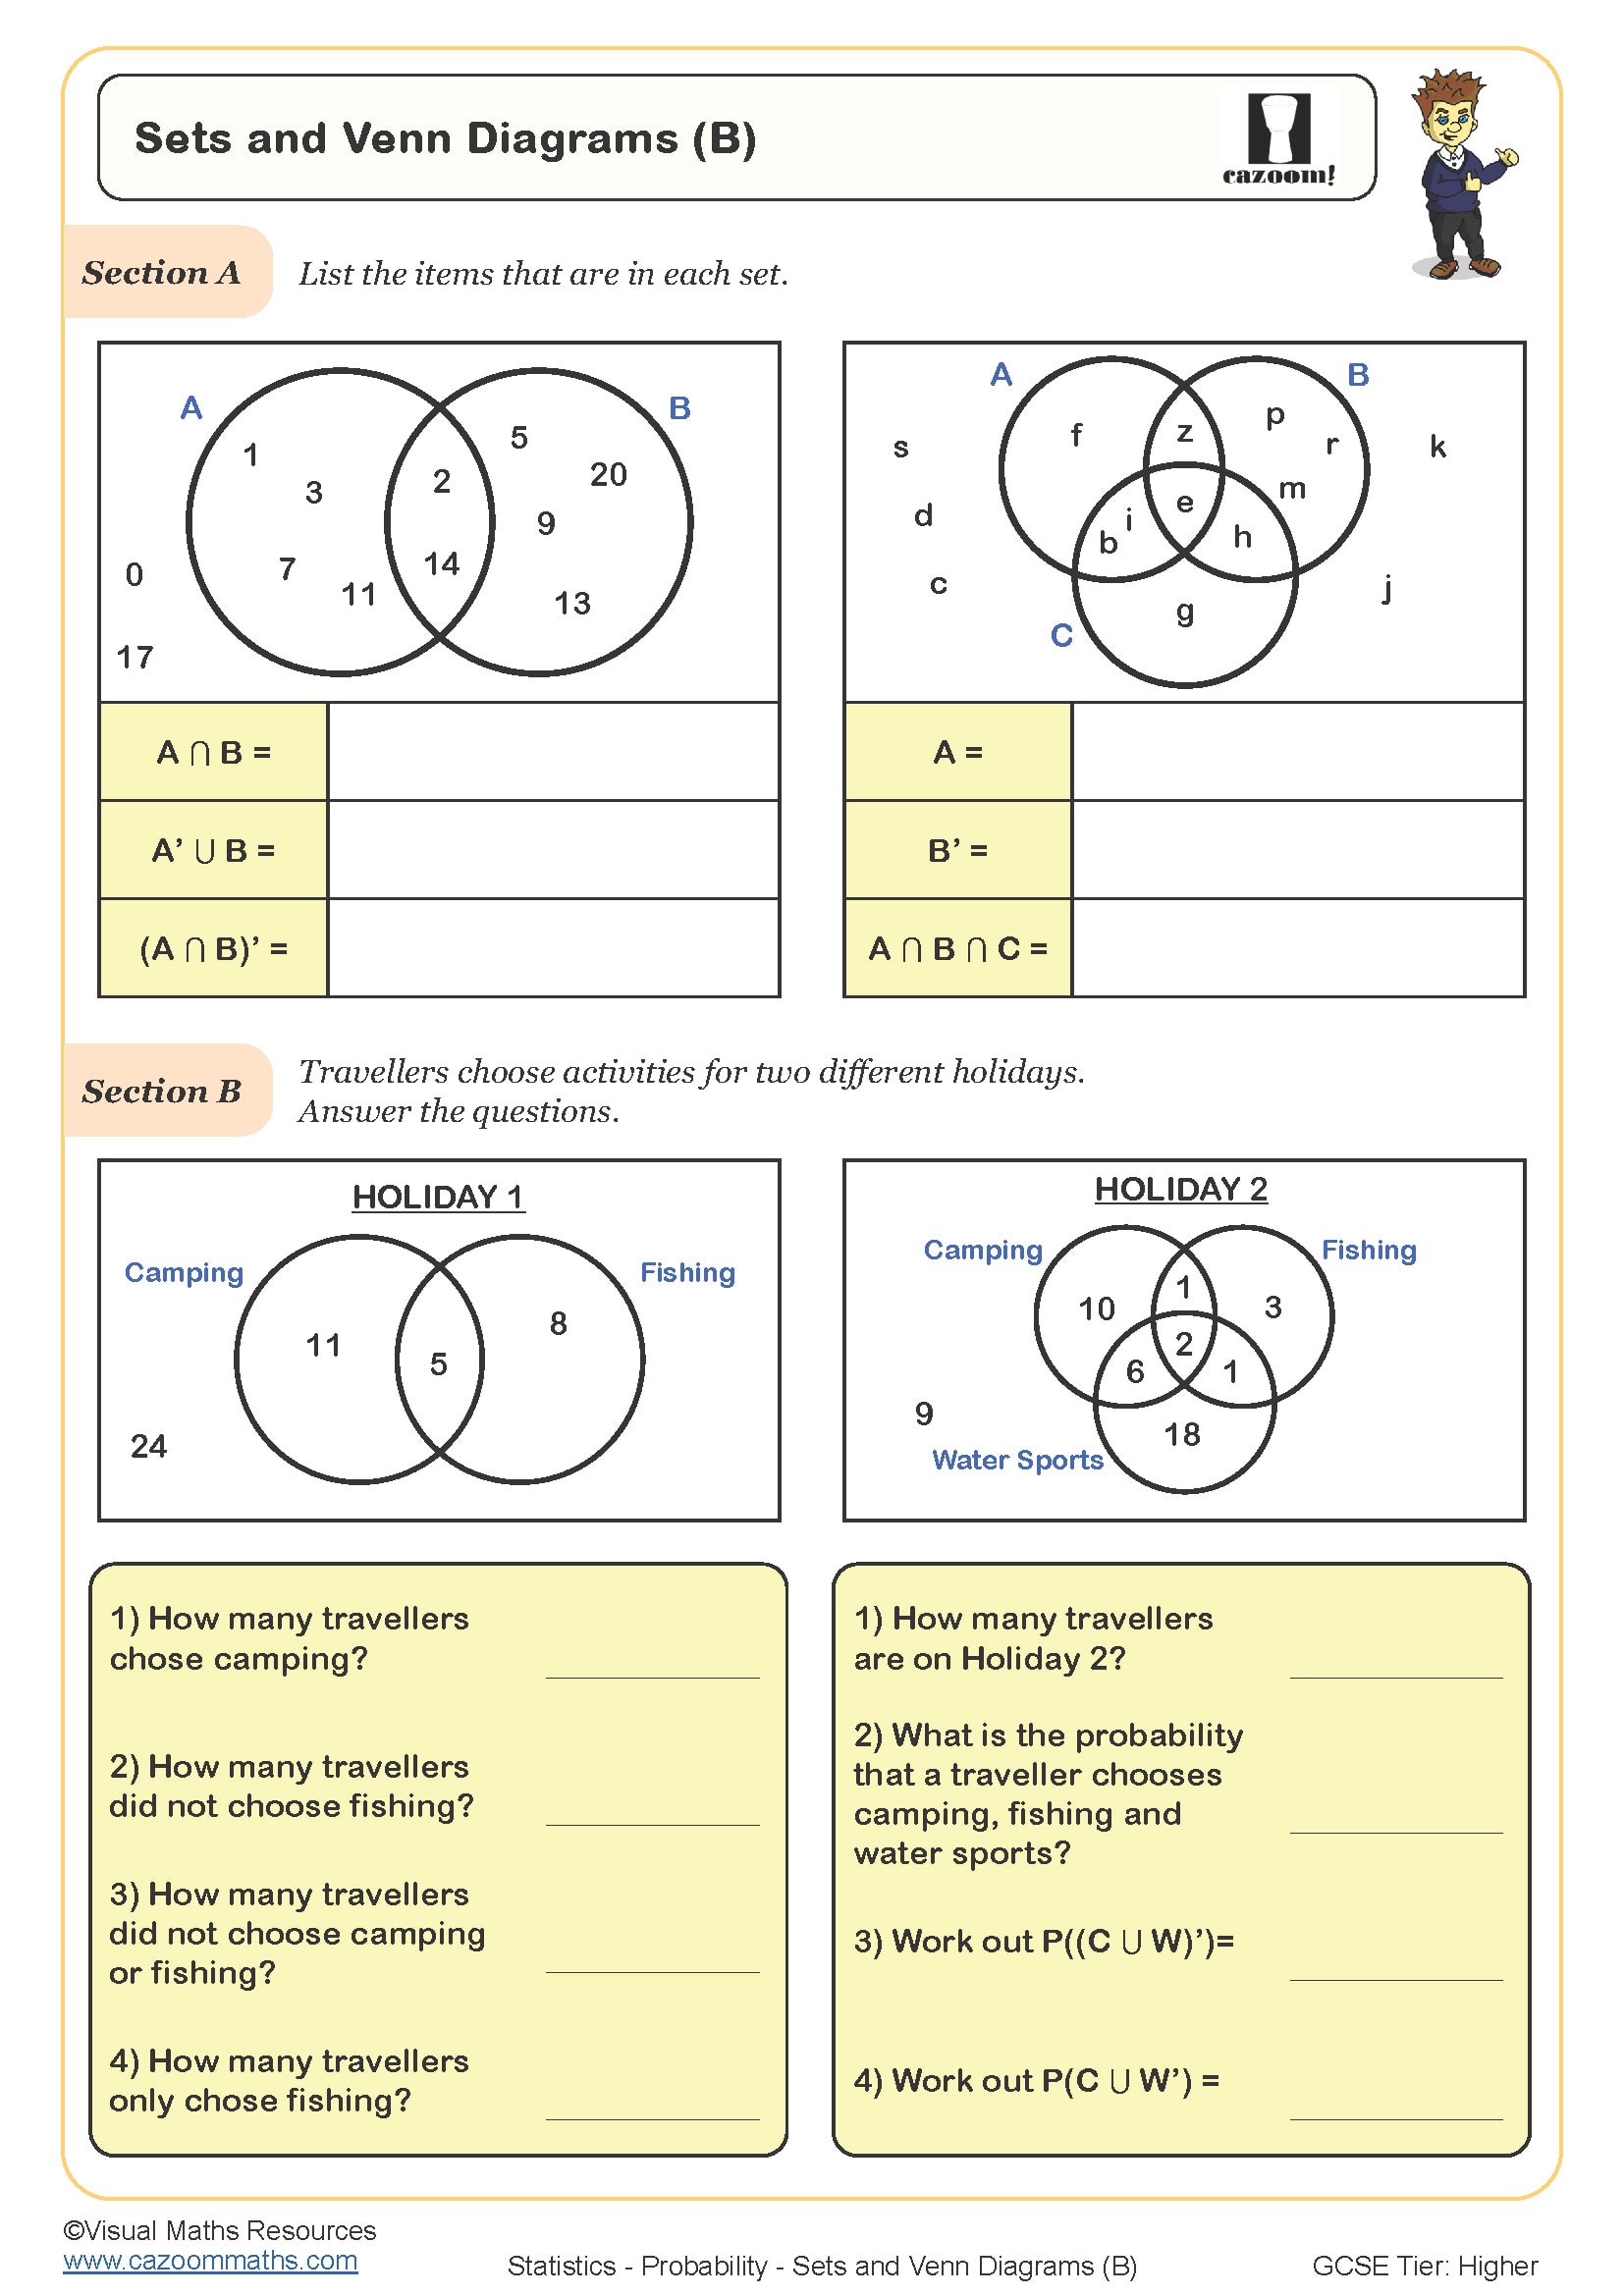
Sets and Venn Diagrams (B)
Year groups: 9, 10
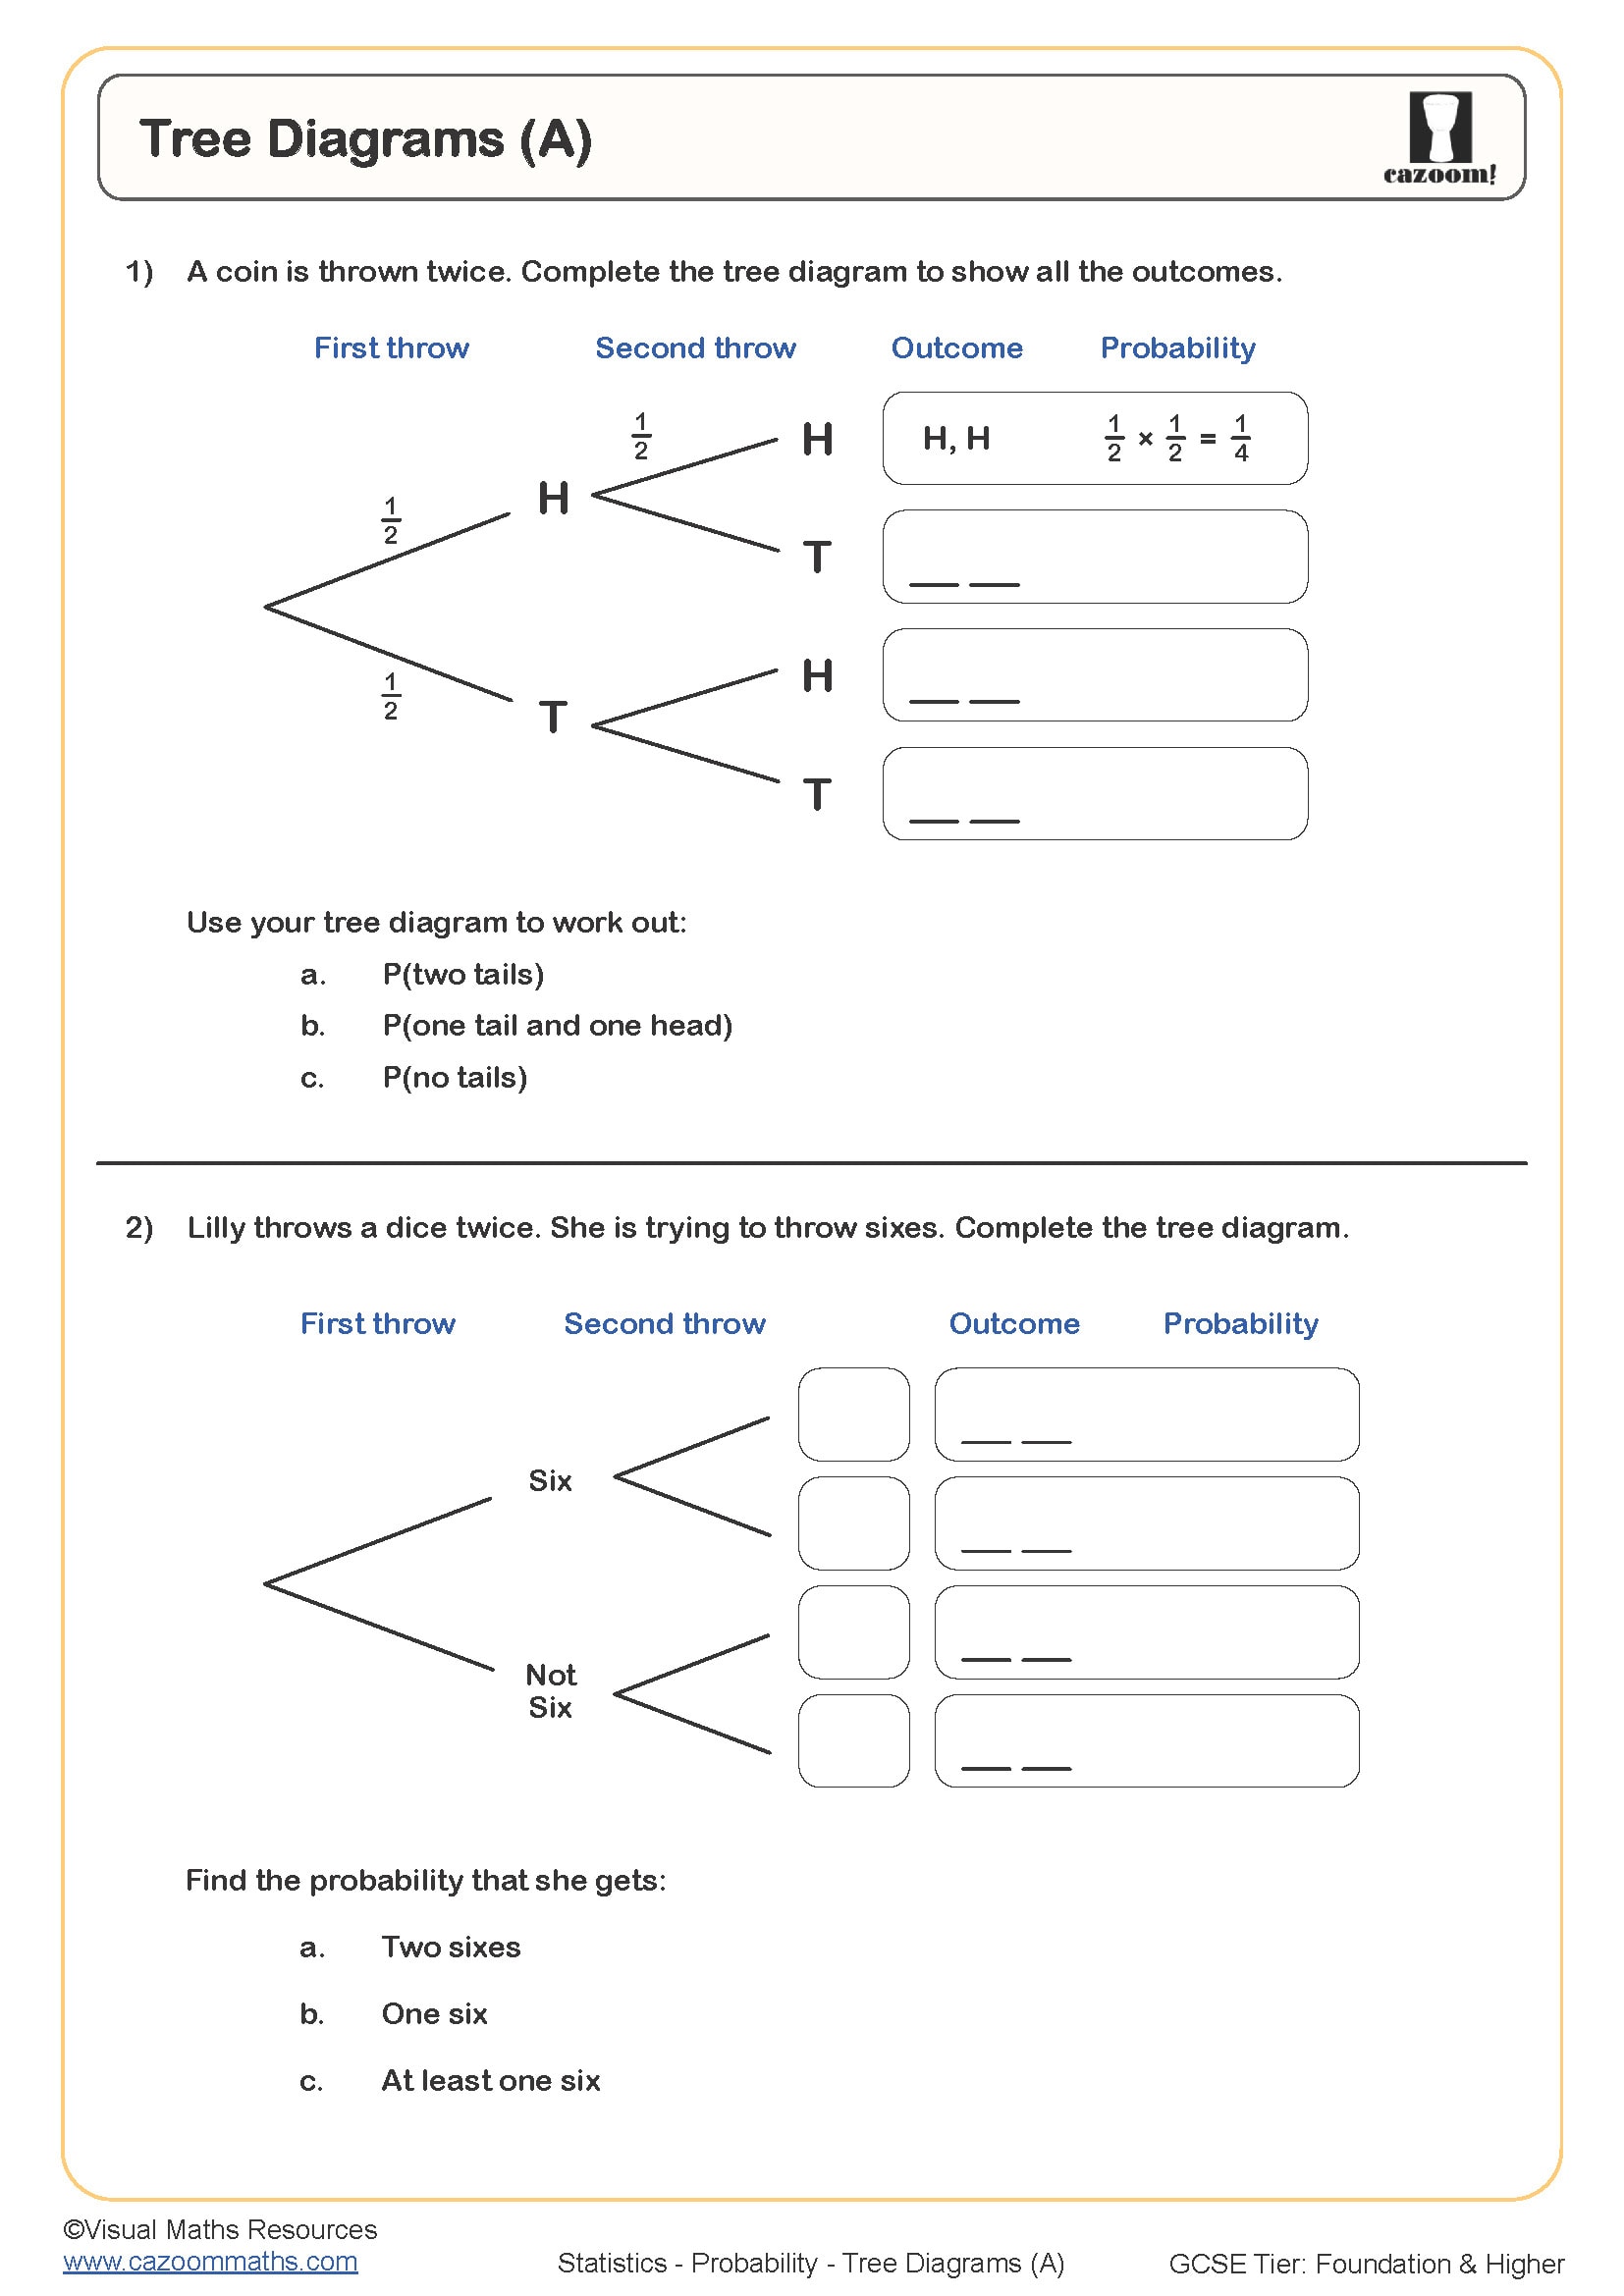
Tree Diagrams (A)
Year groups: 10, 11
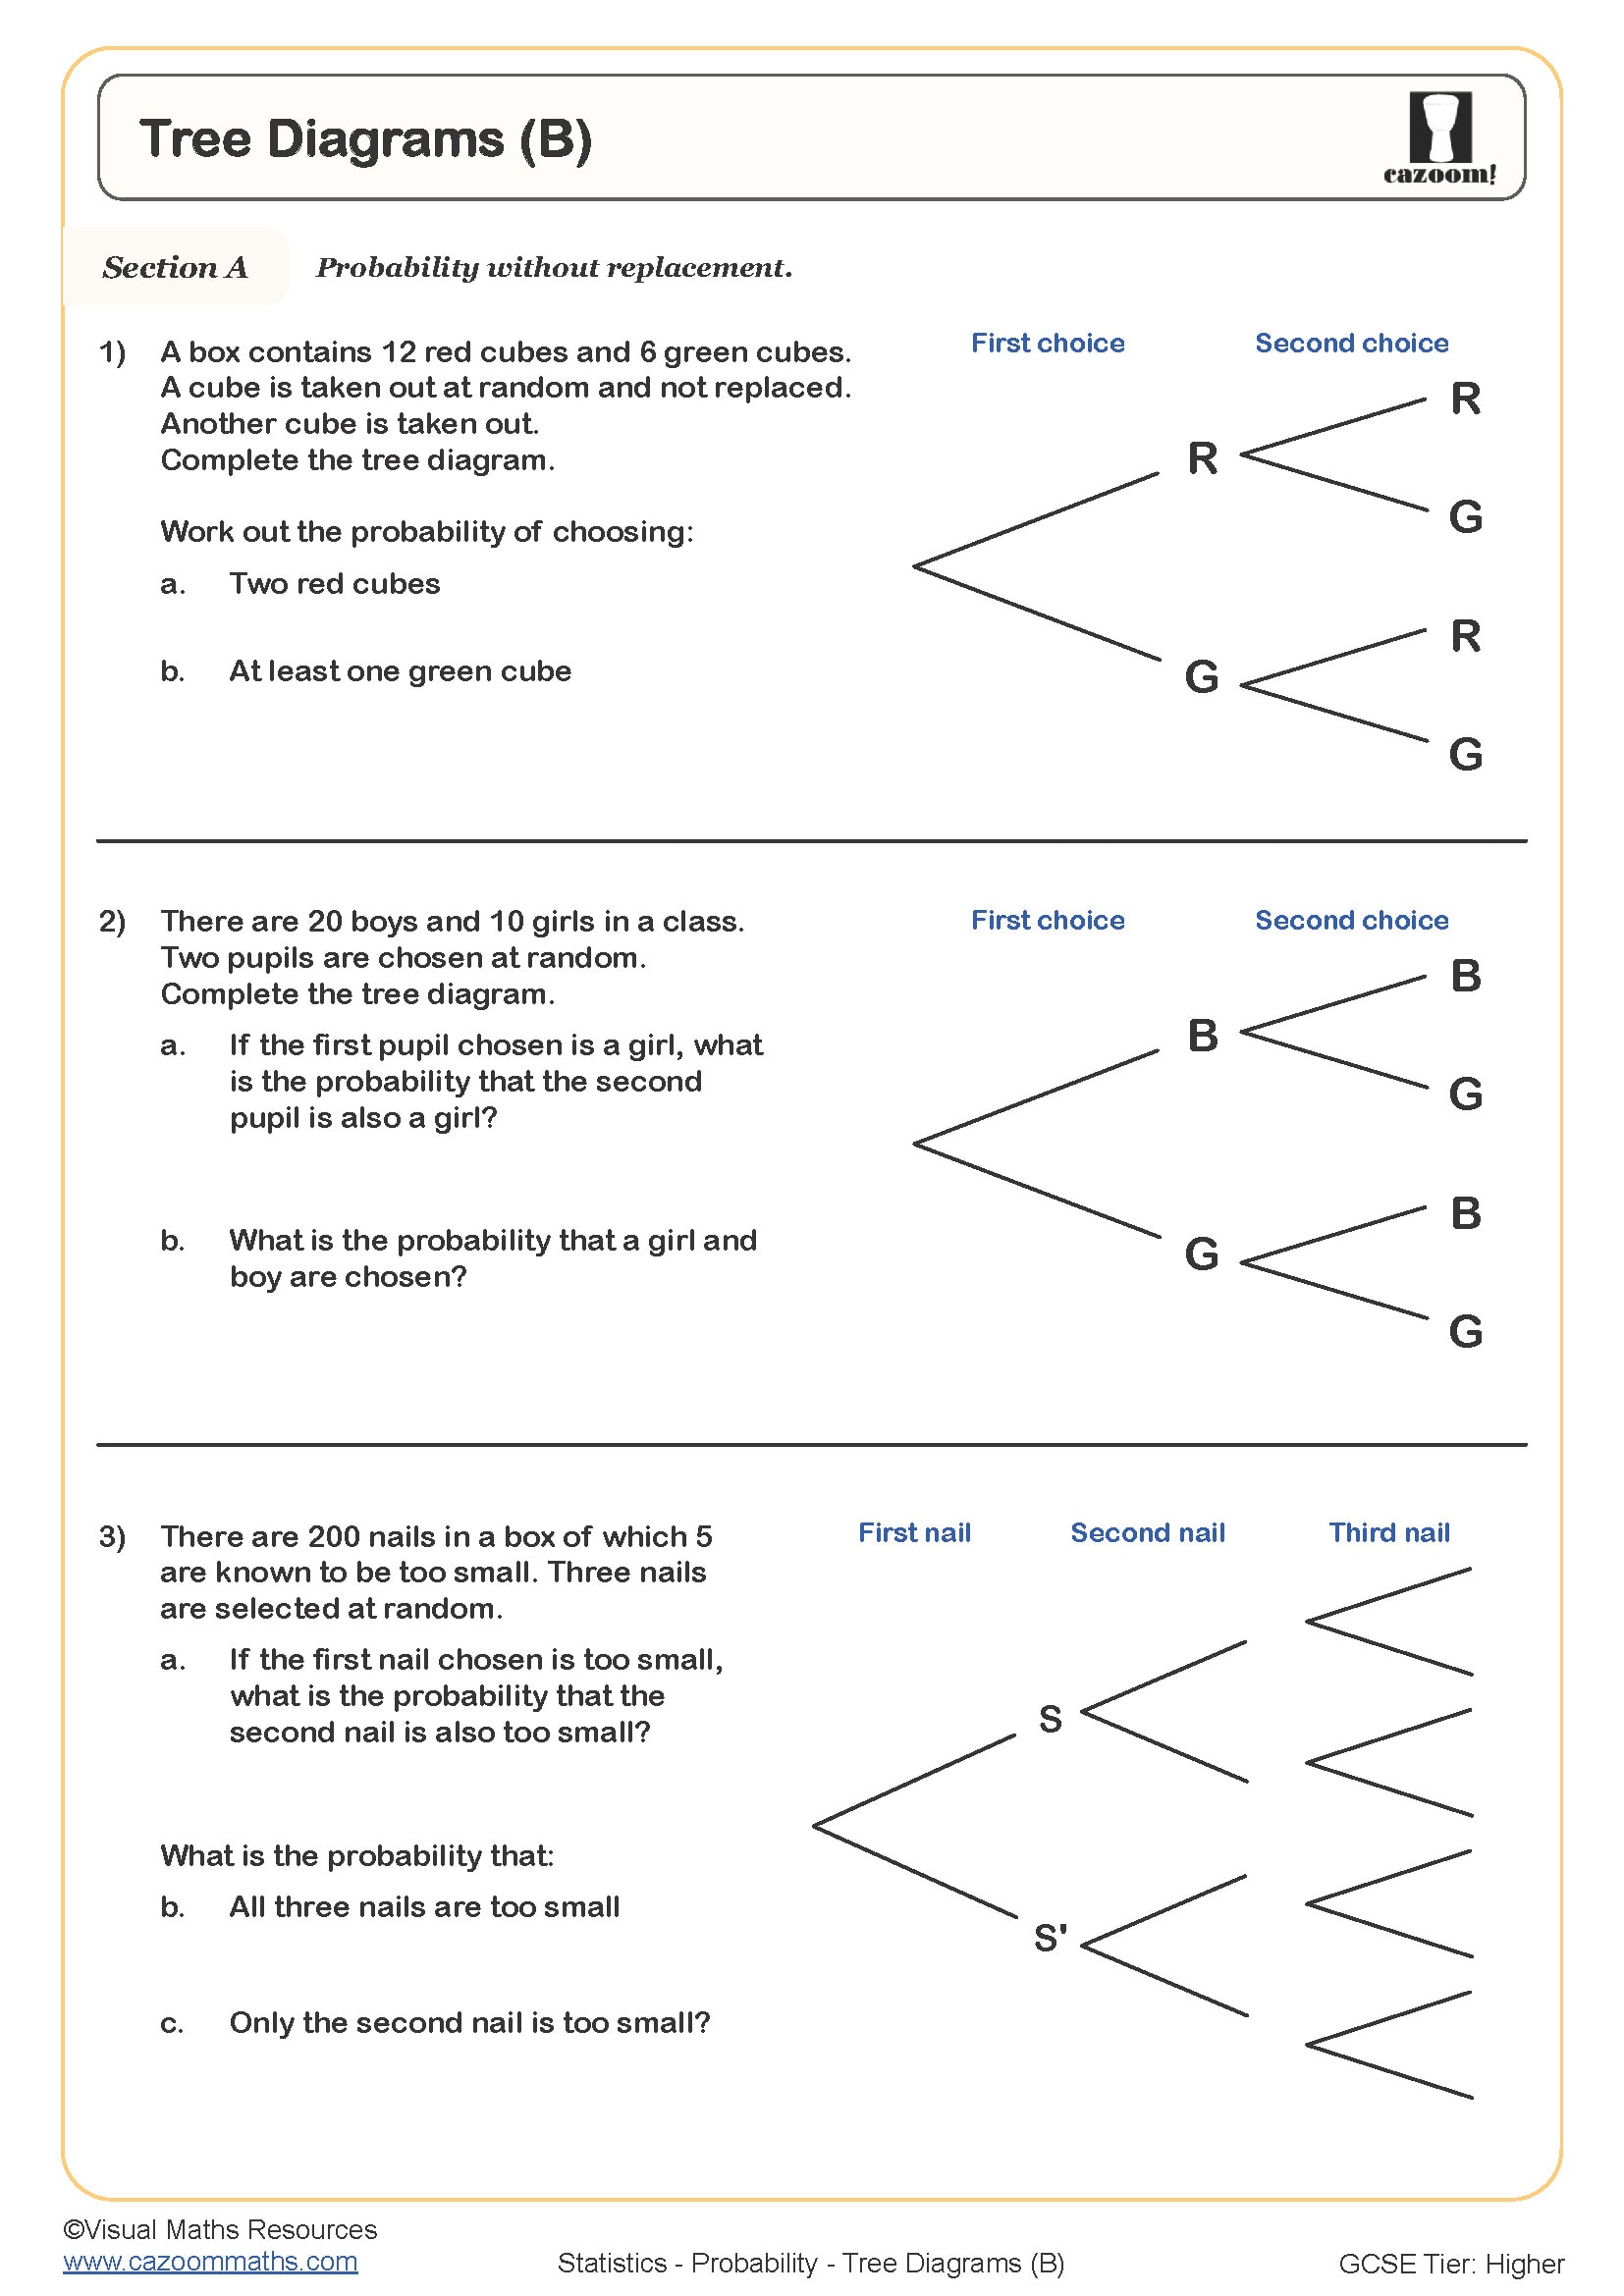
Tree Diagrams (B)
Year groups: 10, 11
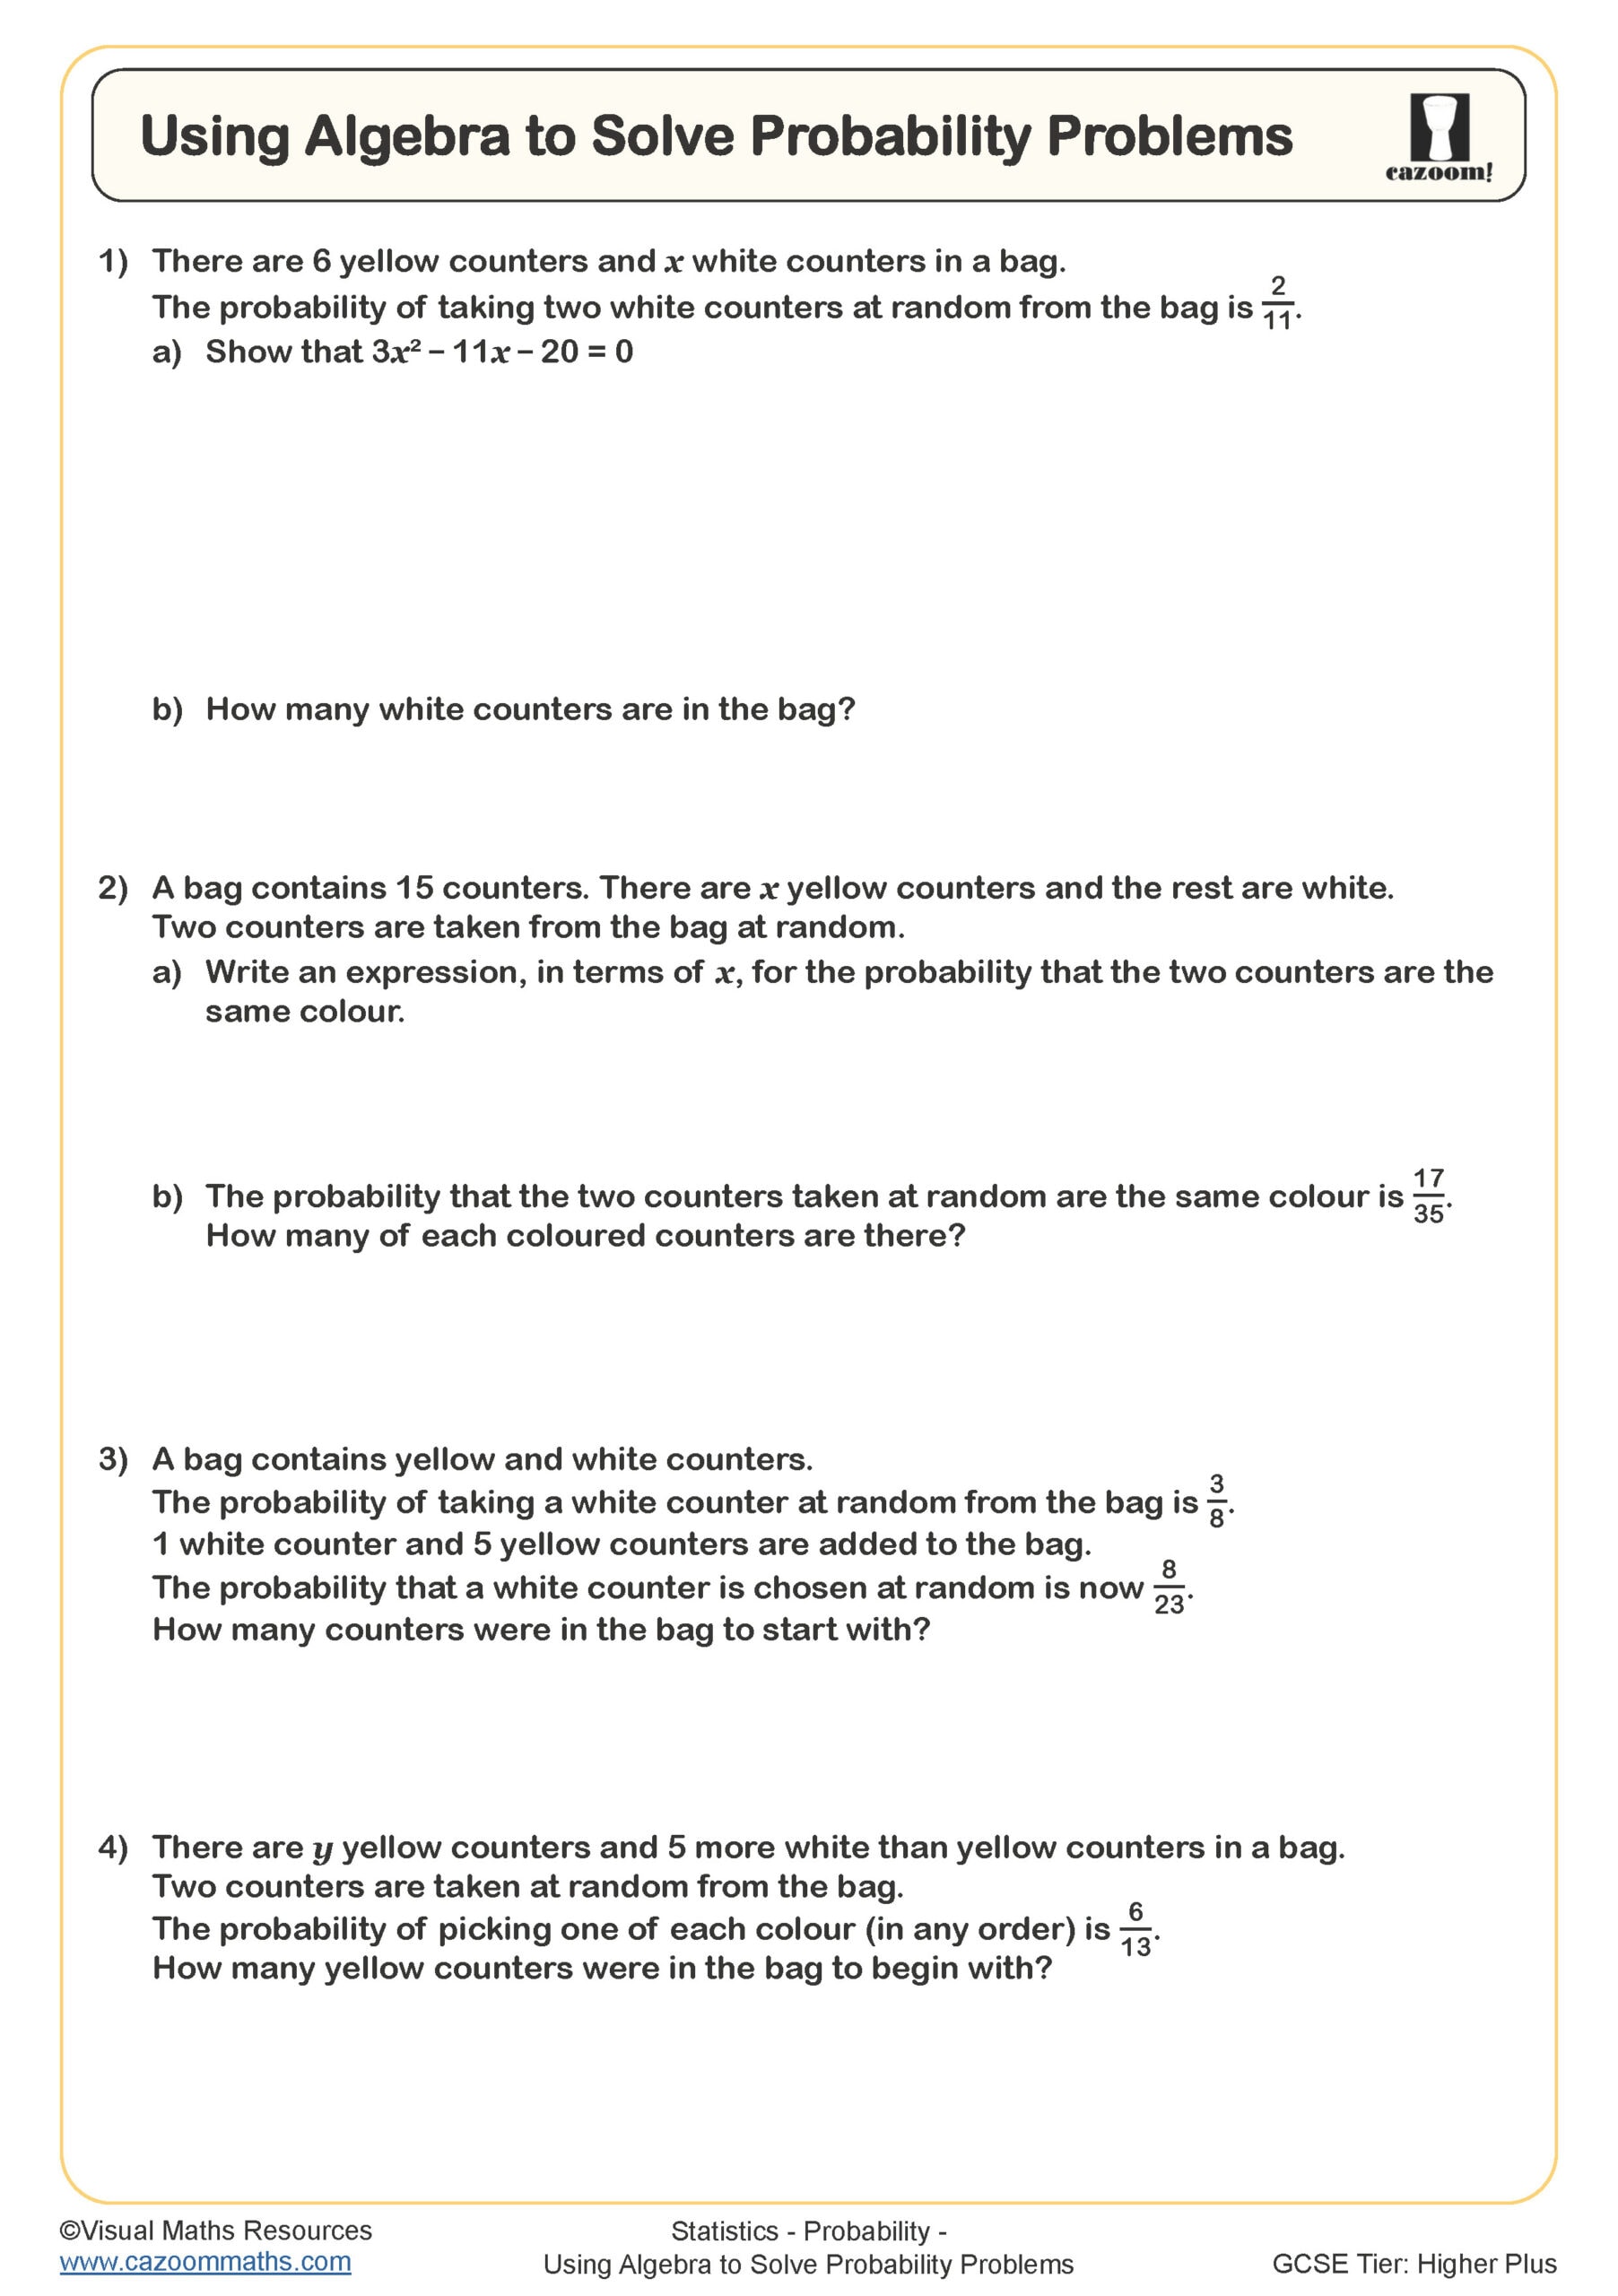
Using Algebra to Solve Probability Problems
Year groups: 11
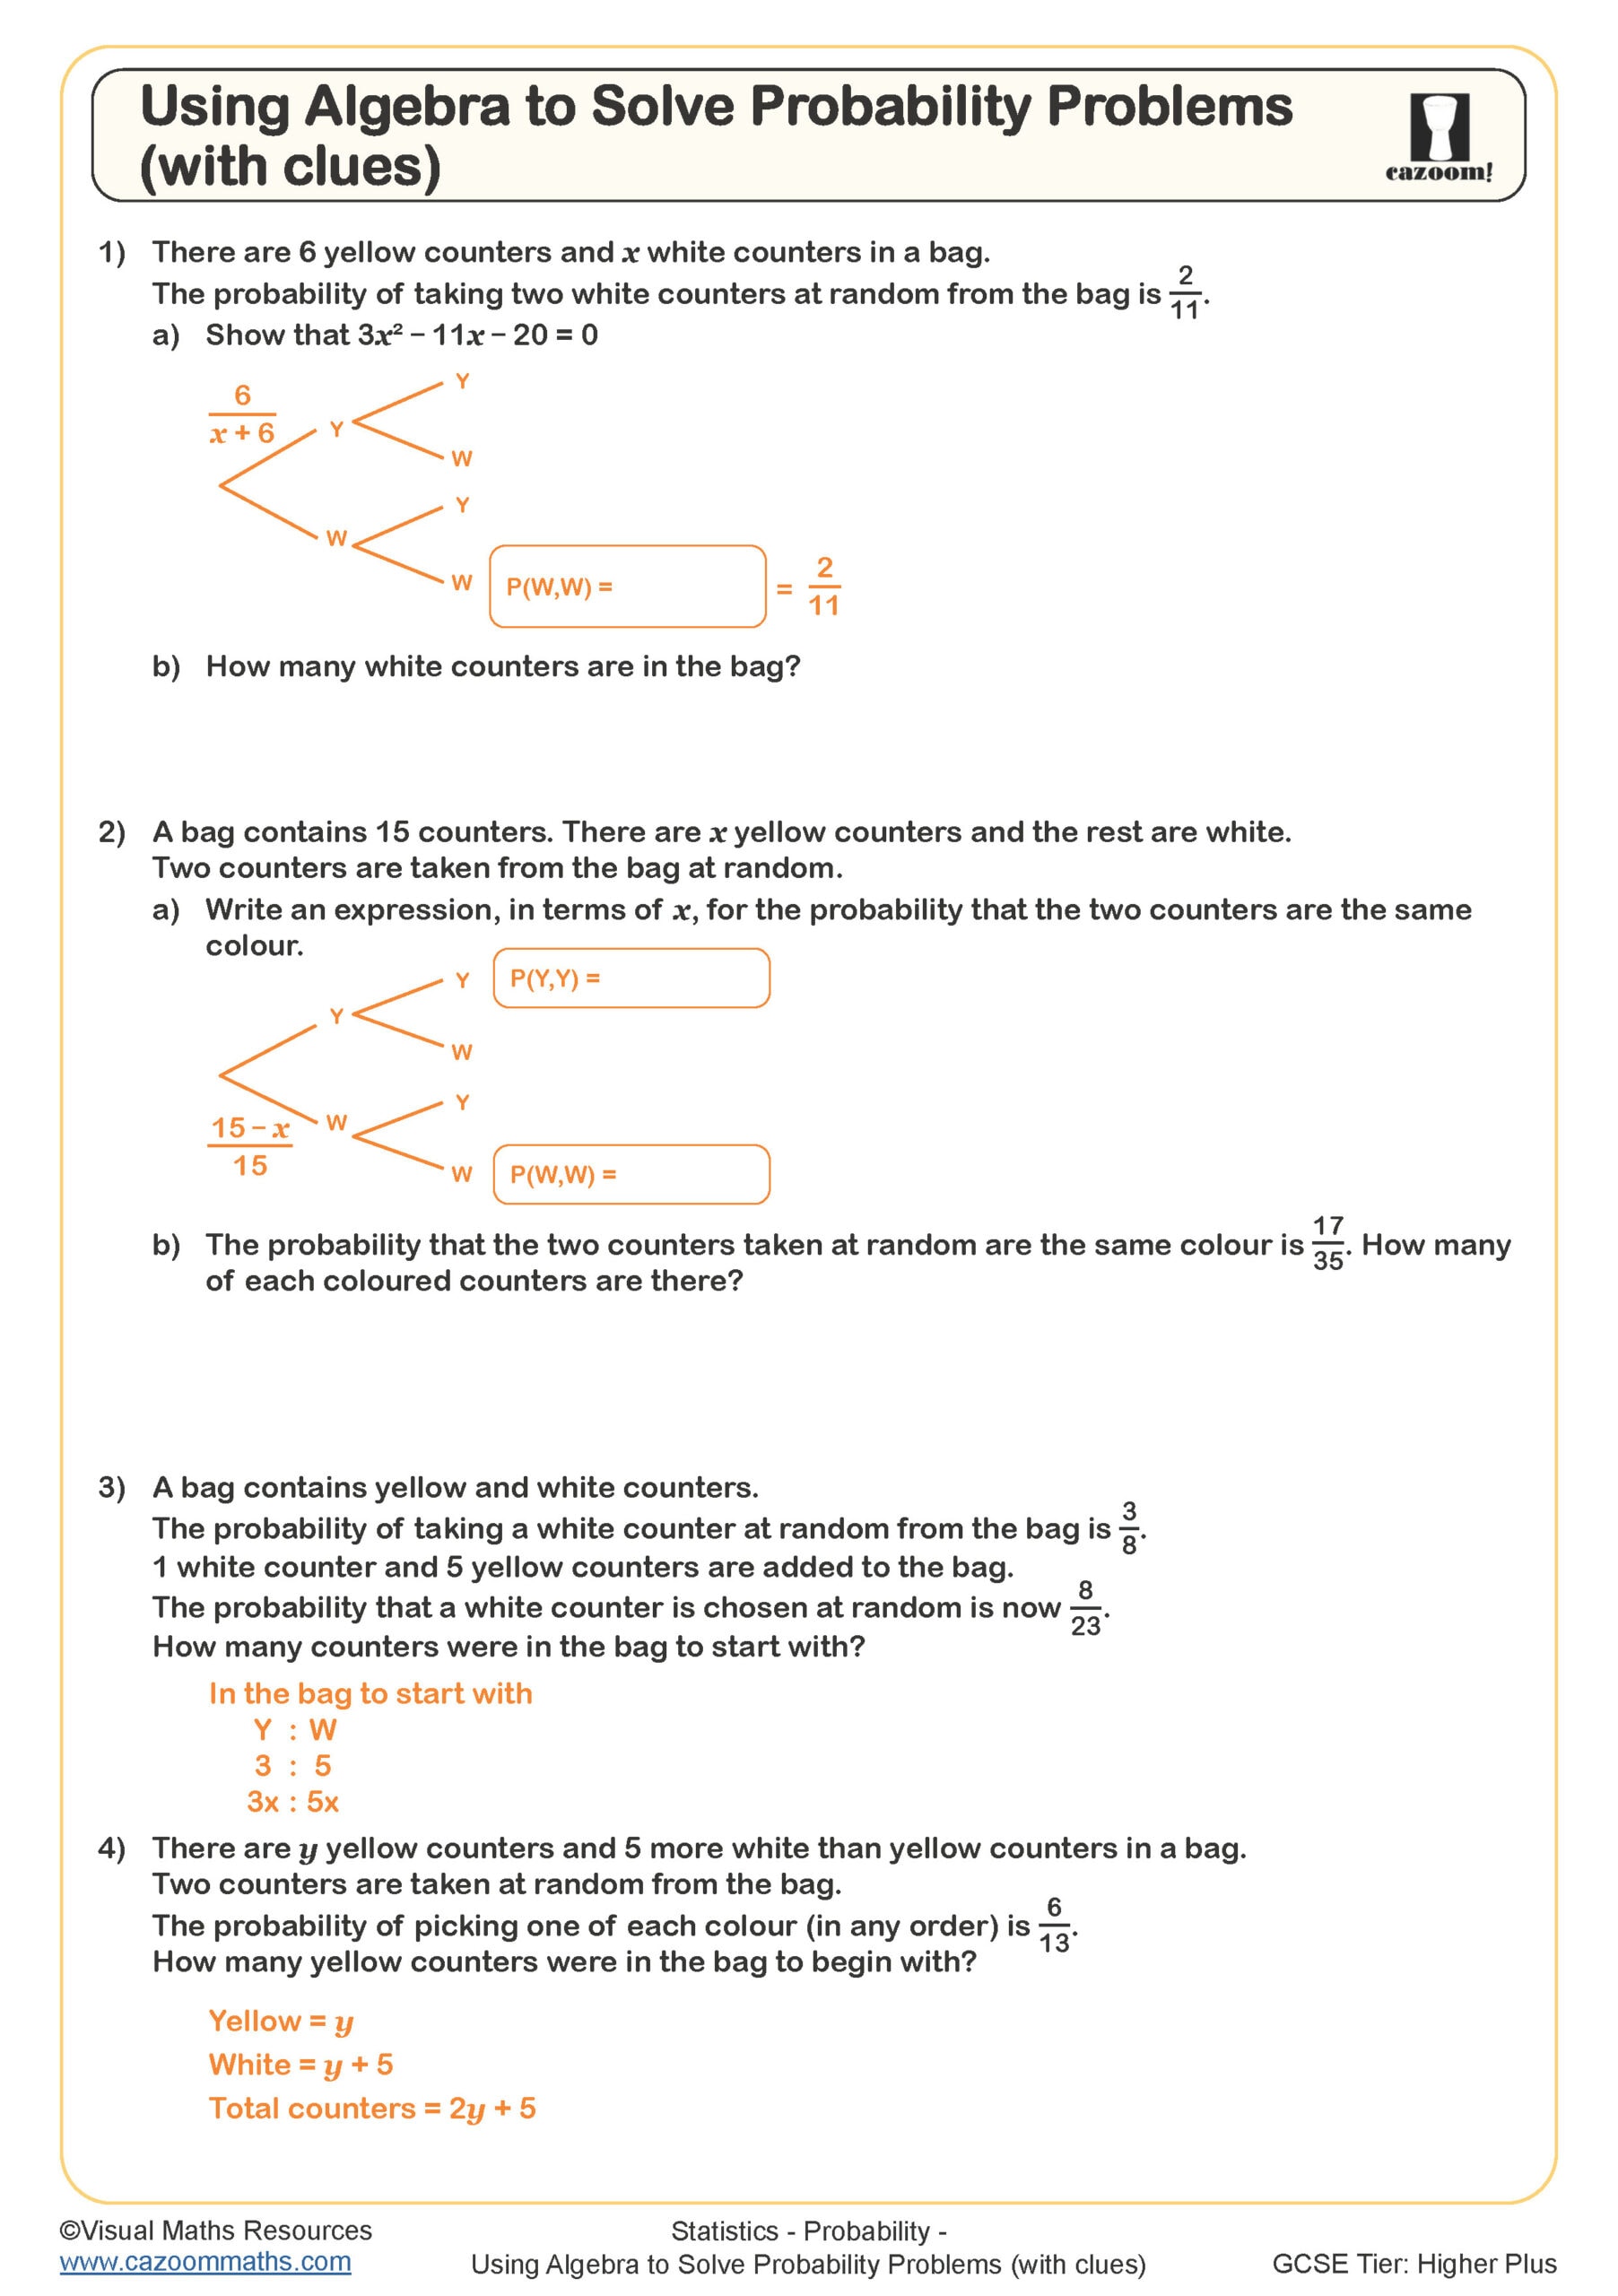
Using Algebra to Solve Probability Problems (with clues)
Year groups: 11
All worksheets are created by the team of experienced teachers at Cazoom Maths.
What makes these probability worksheets suitable for different ability levels?
The probability worksheets ks3 collection spans from basic fraction work with dice and coins through to sophisticated tree diagrams and conditional probability. Teachers can select worksheets based on students' current understanding, whether they're tackling simple single-event probability or working towards GCSE requirements with compound events and Venn diagrams.
Many teachers observe that students often confuse 'probability of' with 'number of' when working with larger sample spaces, particularly in bag problems. The worksheets include varied contexts and careful question sequencing to address this misconception, with answer sheets providing detailed working to help students understand the reasoning behind each solution.
How do probability worksheets progress from Year 7 to GCSE level?
A year 7 probability worksheet typically focuses on basic probability using fractions, introducing students to the probability scale from 0 to 1 and simple theoretical calculations. Year 8 extends this to experimental probability and relative frequency, while Year 9 introduces combined events and basic tree diagrams before GCSE work tackles conditional probability and complex scenarios.
Teachers frequently find that the jump from listing outcomes to calculating probabilities systematically challenges students. The progression through these worksheets builds this skill gradually, with early exercises emphasising organised listing methods before moving to more efficient calculation approaches that students need for GCSE success.
Why do students find tree diagrams particularly challenging in probability work?
Tree diagrams require students to visualise sequential events and multiply probabilities along branches while adding probabilities between different routes to the same outcome. Teachers report that students often add when they should multiply, or forget to consider all possible pathways when calculating final probabilities.
The worksheets address this through careful scaffolding, starting with two-stage trees where outcomes are clearly labelled before progressing to more complex scenarios. Many include partially completed trees where students fill in missing probabilities, helping them understand the structure before attempting complete constructions independently.
How can teachers use these worksheets most effectively in probability lessons?
Teachers find that starting lessons with a practical probability experiment, then using worksheets to formalise the mathematical approach, helps students connect abstract calculations to real experiences. The answer sheets prove invaluable for peer marking activities, allowing students to identify errors in their reasoning process rather than just checking final answers.
Many teachers use selected questions as starter activities or homework, particularly those involving familiar contexts like sports results or weather forecasts. This helps students see probability's relevance beyond the classroom, supporting their understanding of risk assessment and decision-making skills that prove valuable in many STEM careers and everyday situations.