Probability Tree Diagrams Worksheets
All worksheets are created by the team of experienced teachers at Cazoom Maths.
What are probability tree diagrams used for in maths?
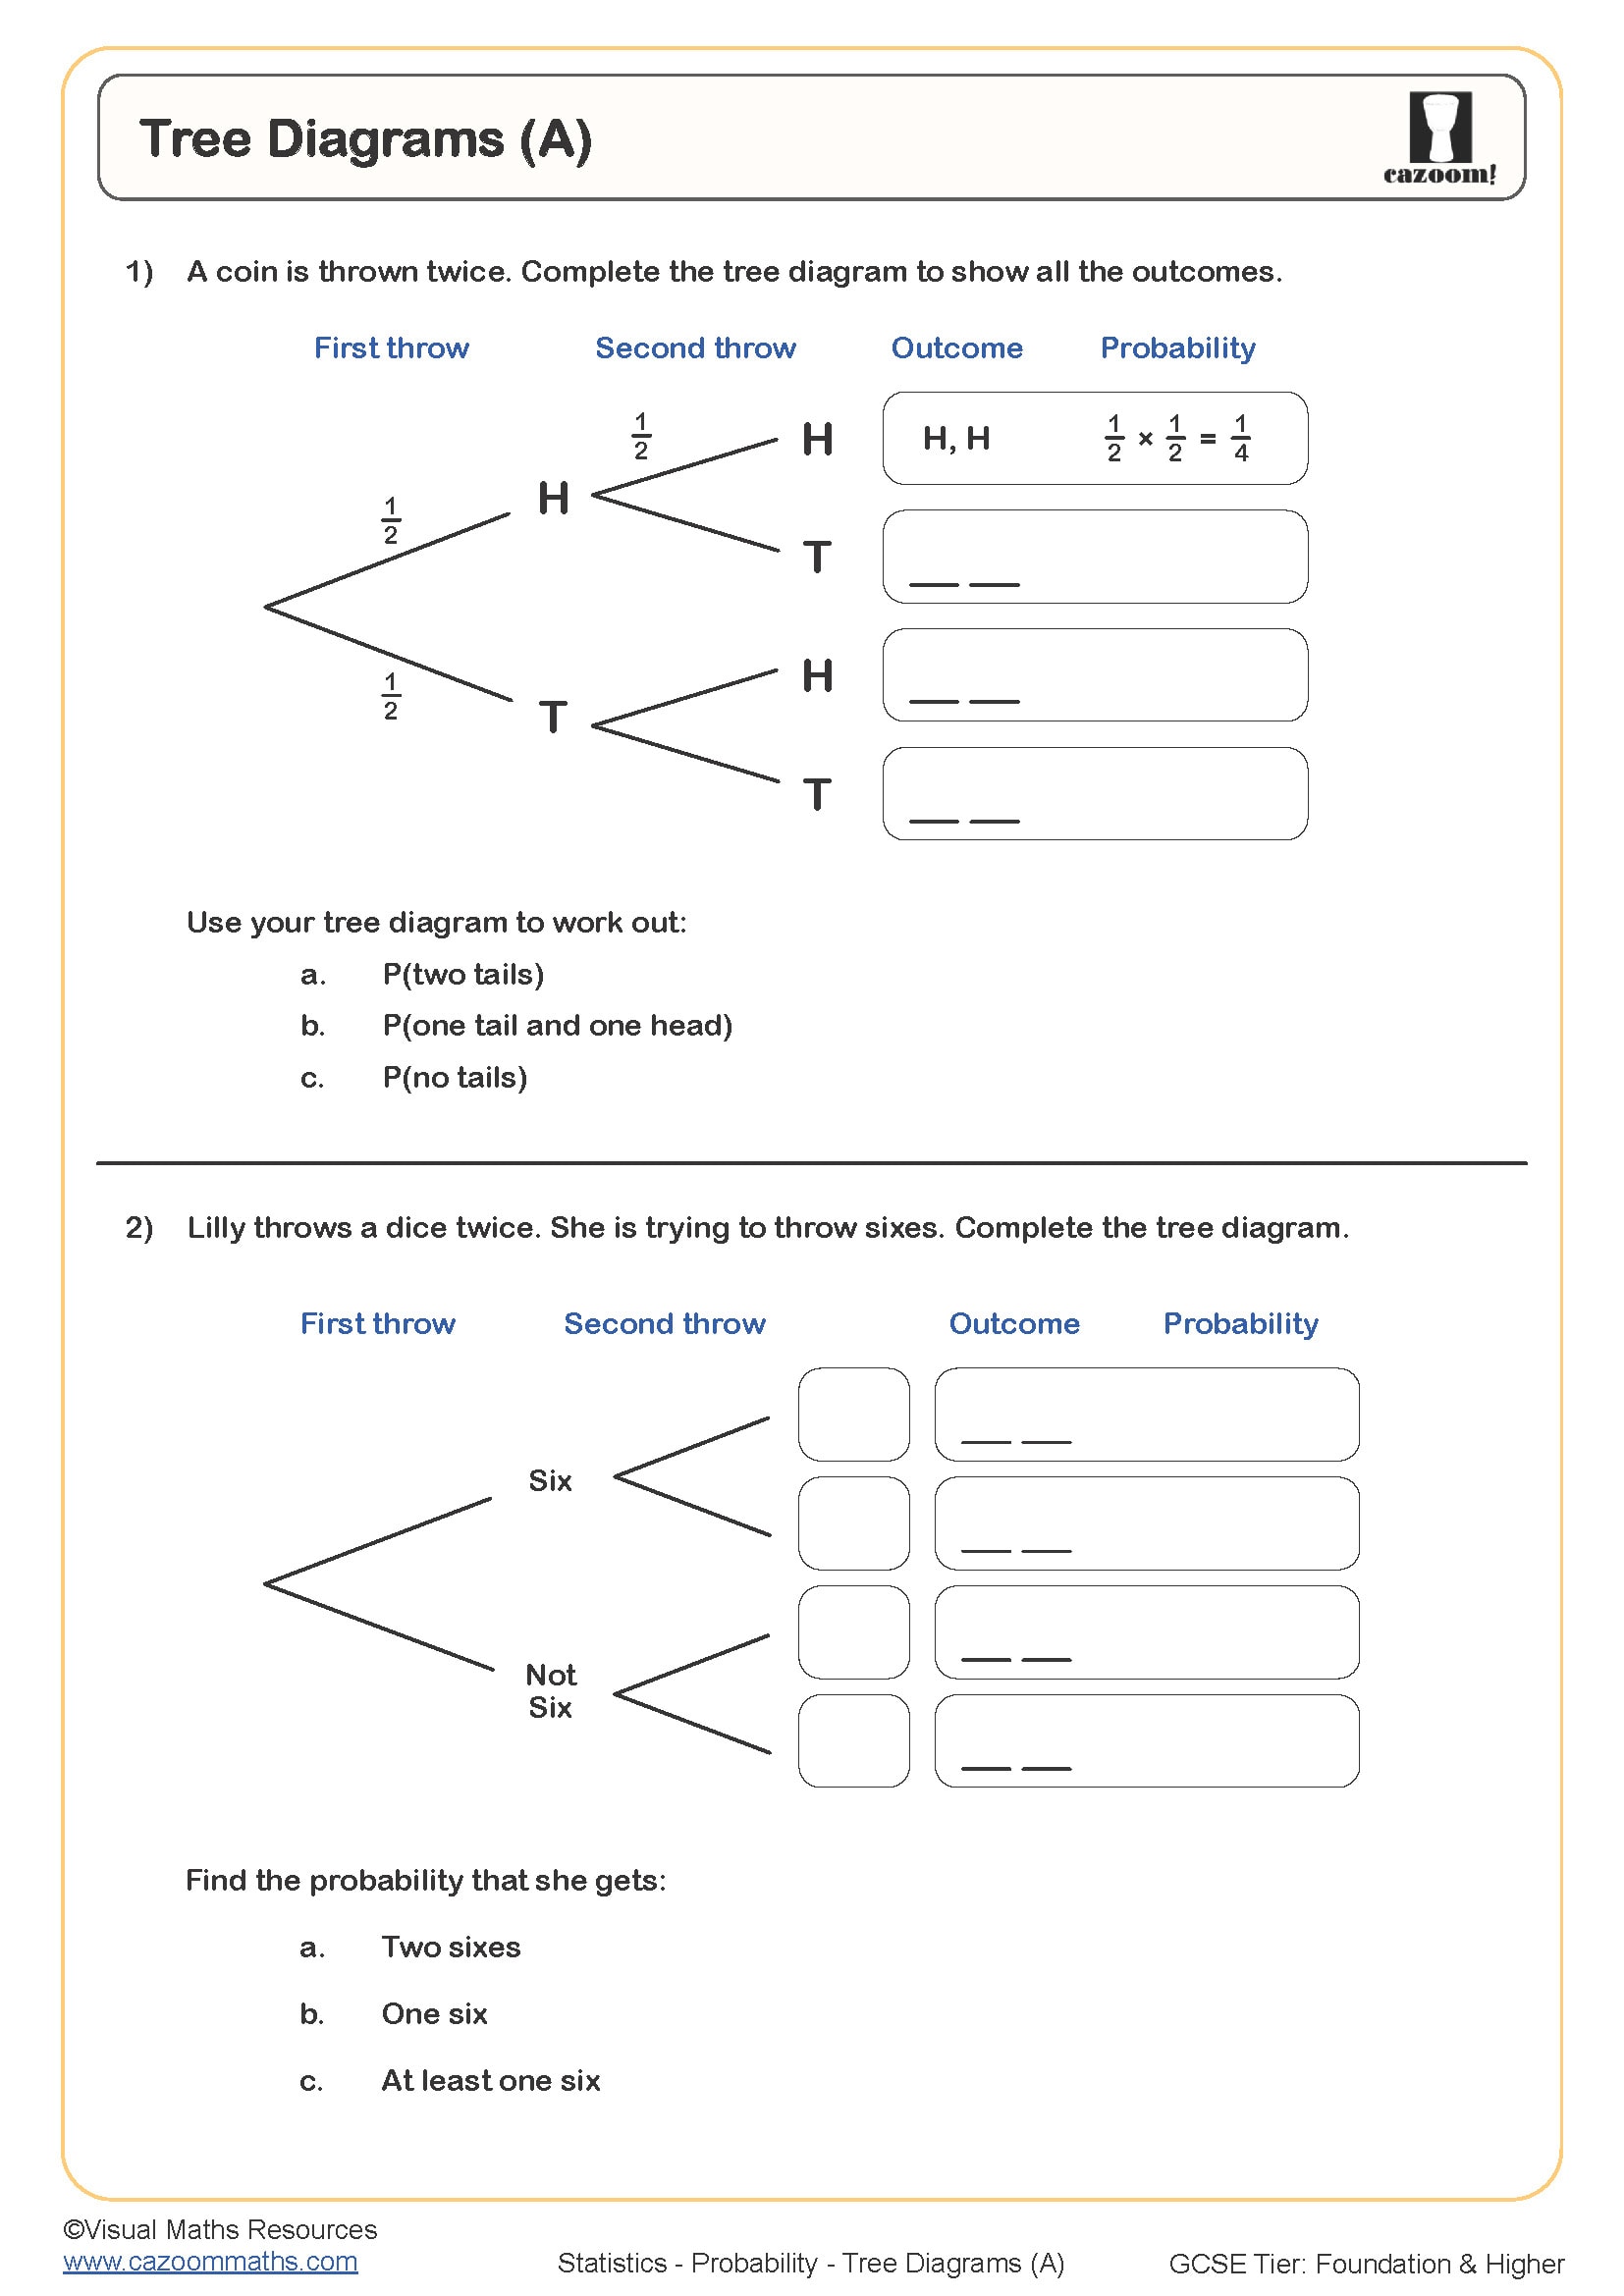
Probability tree diagrams provide a visual method for calculating the probability of combined events, particularly when events occur in sequence. In GCSE maths, students use them to organise outcomes systematically and avoid missing possibilities when two or more events happen together. The diagram shows all possible outcomes as branches, with probabilities written on each branch and multiplied along paths to find combined probabilities.
Teachers frequently observe that students treat tree diagrams purely as drawing exercises rather than calculation tools. A common error occurs when students correctly construct the tree but then add probabilities along branches instead of multiplying them. The worksheets emphasise that probabilities multiply along paths and add across different outcomes, reinforcing this through questions requiring both operations. This distinction becomes crucial in exam questions worth multiple marks.
Which year groups study probability tree diagrams?
Probability tree diagrams appear in the KS4 curriculum for Year 10 and Year 11 students as part of the statistics strand. This topic typically follows work on basic probability, probability scales, and listing outcomes, building towards more sophisticated conditional probability concepts. The National Curriculum requires students to construct and interpret tree diagrams for combined events involving both independent and dependent probabilities.
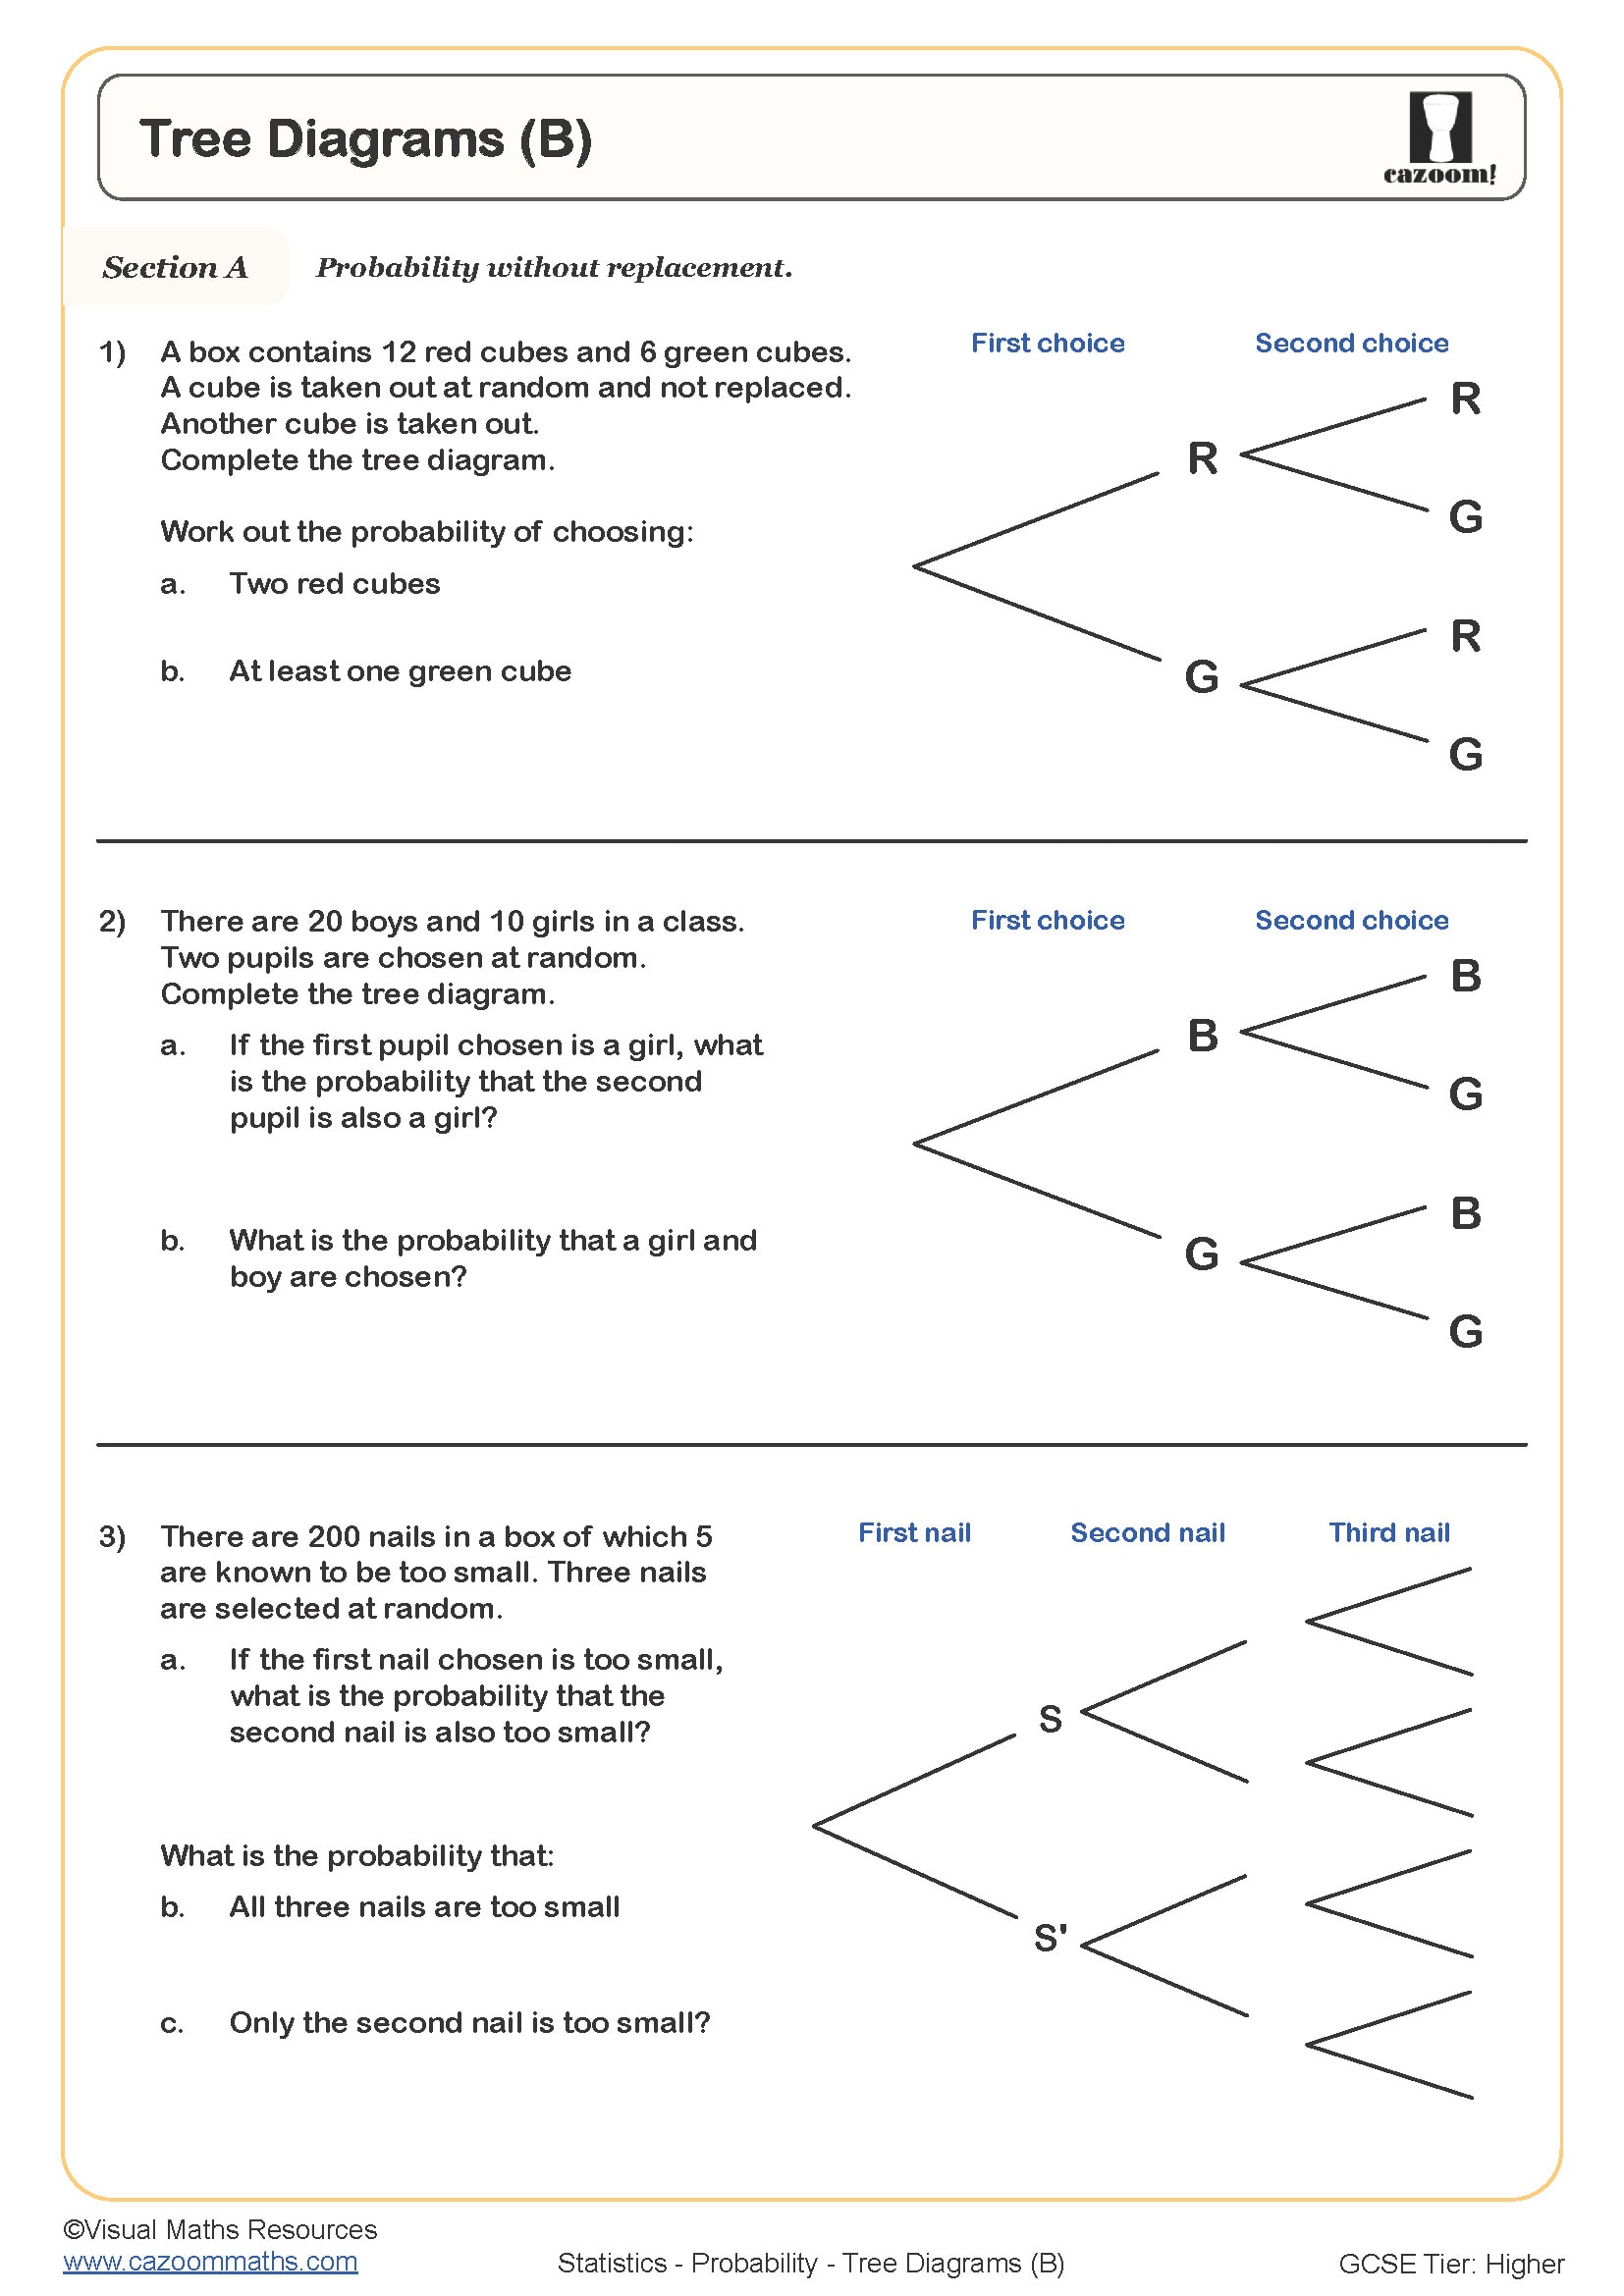
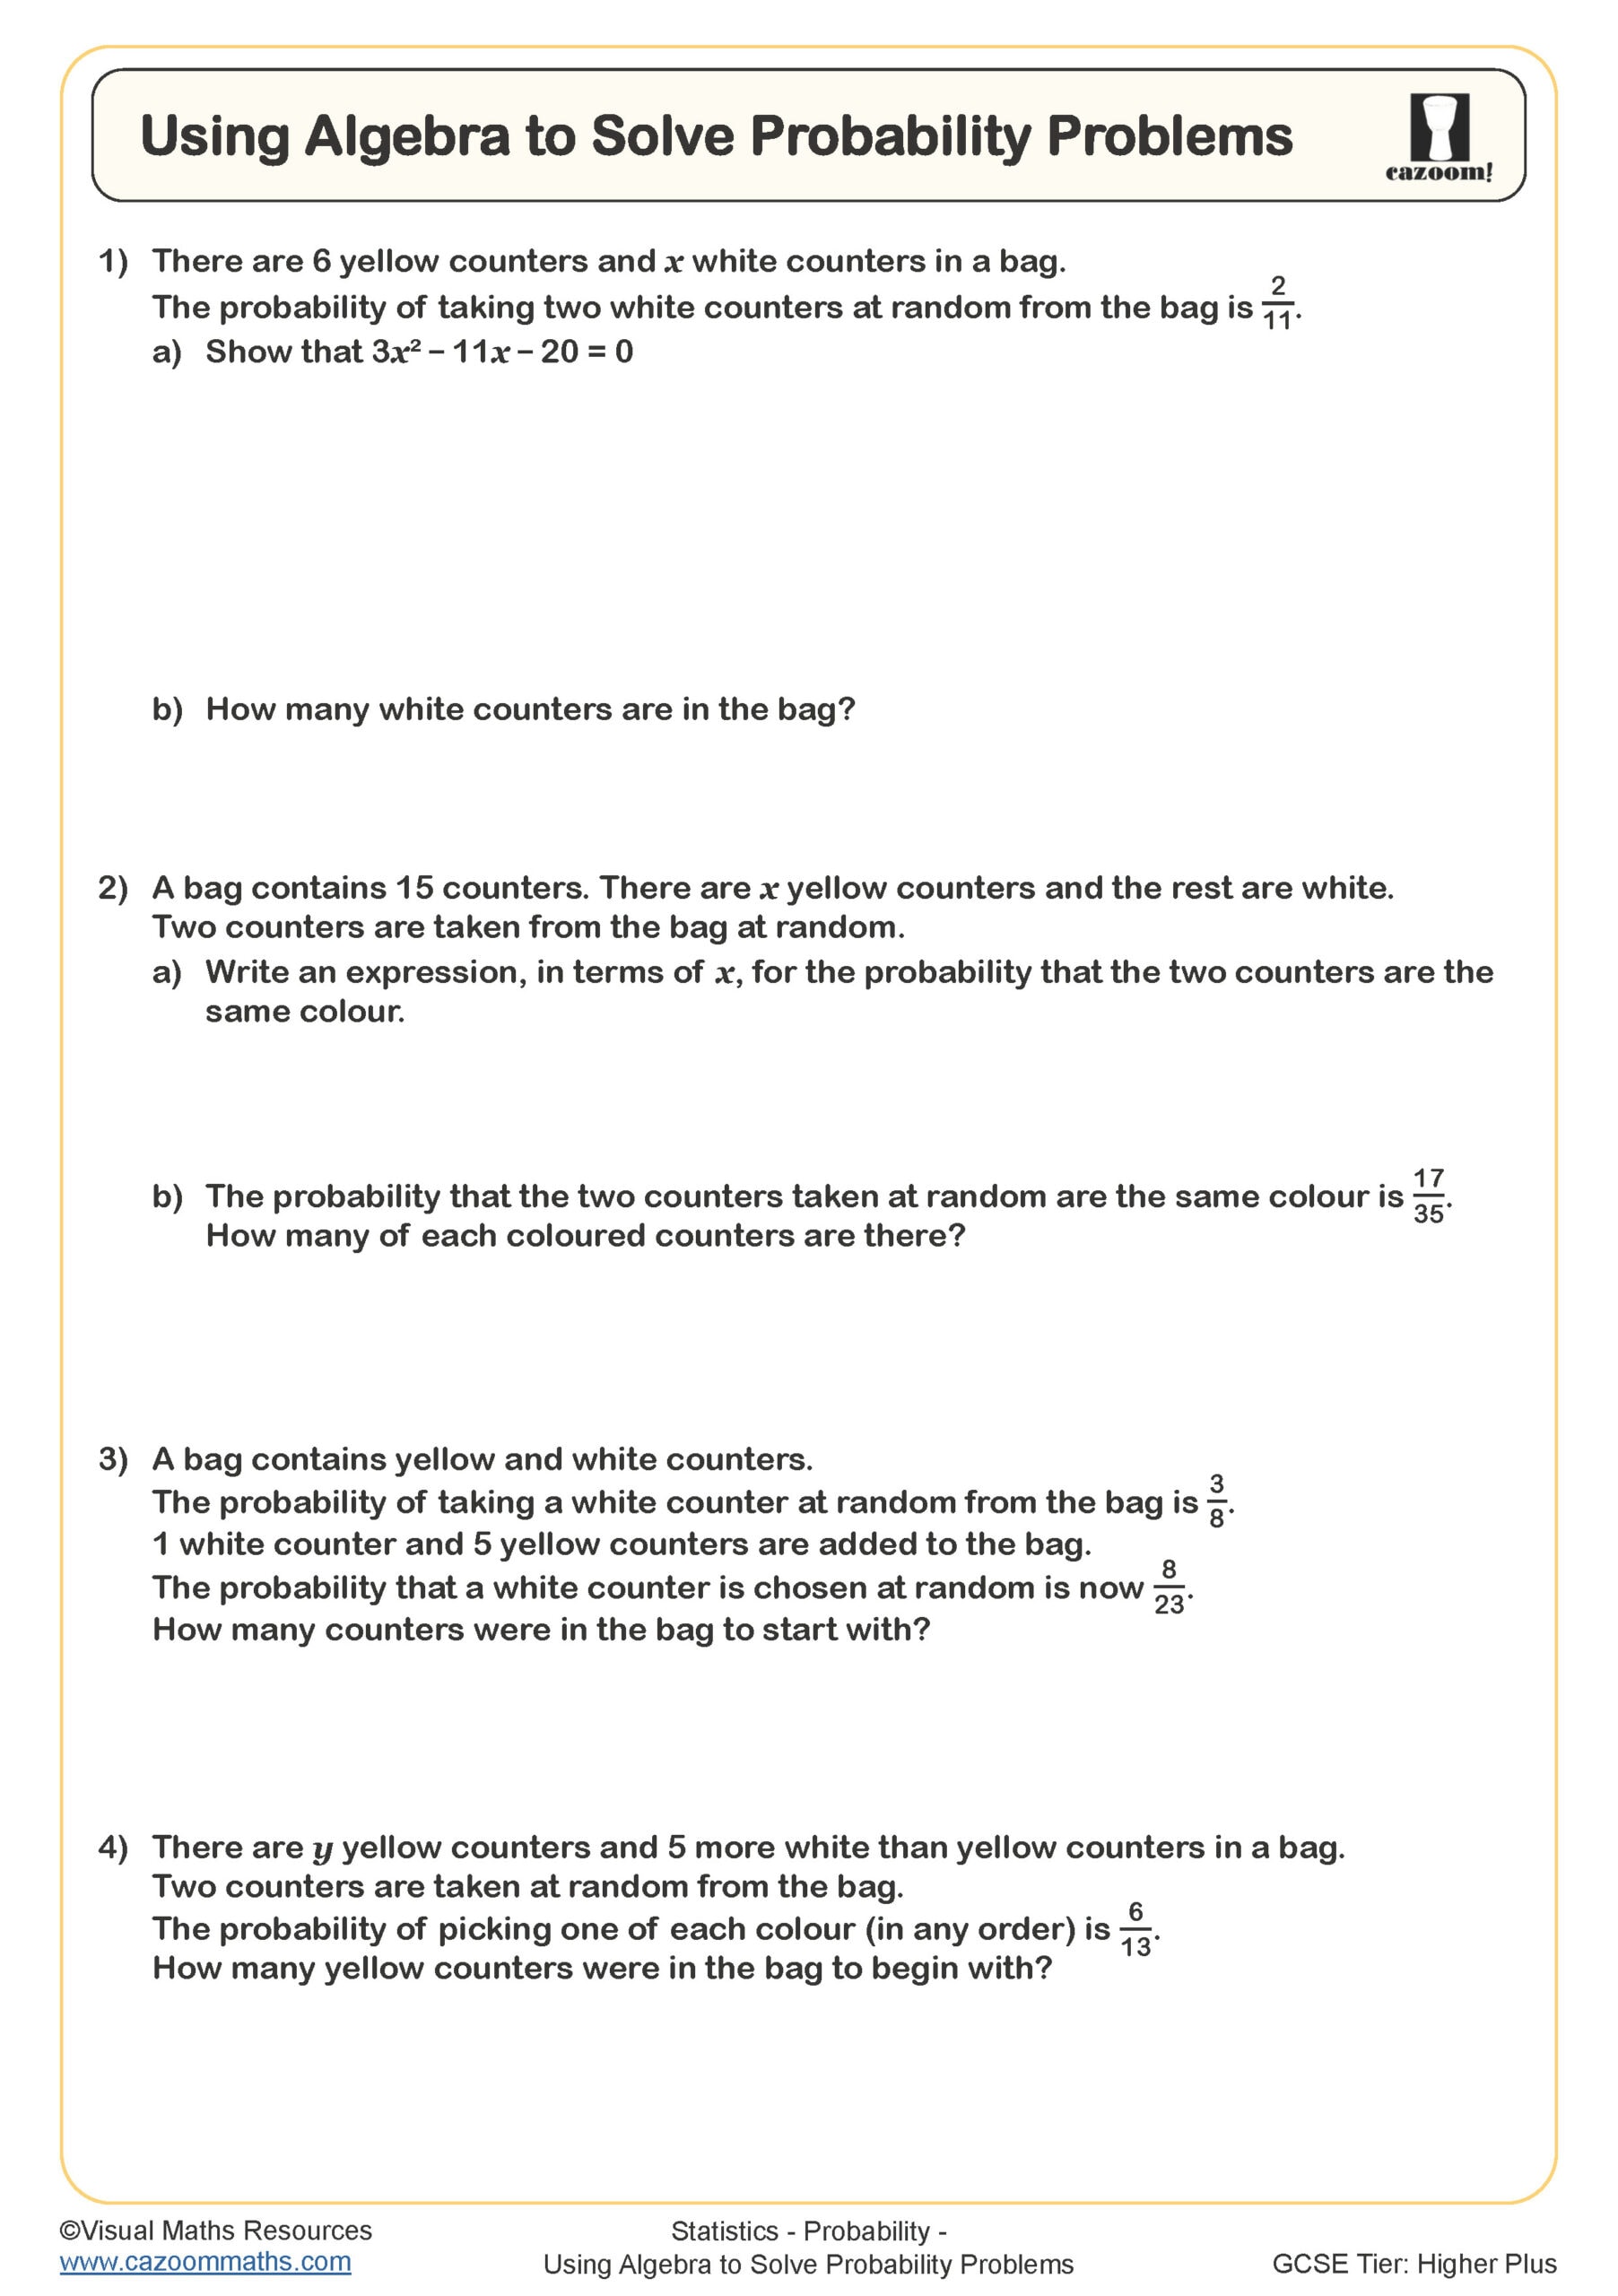
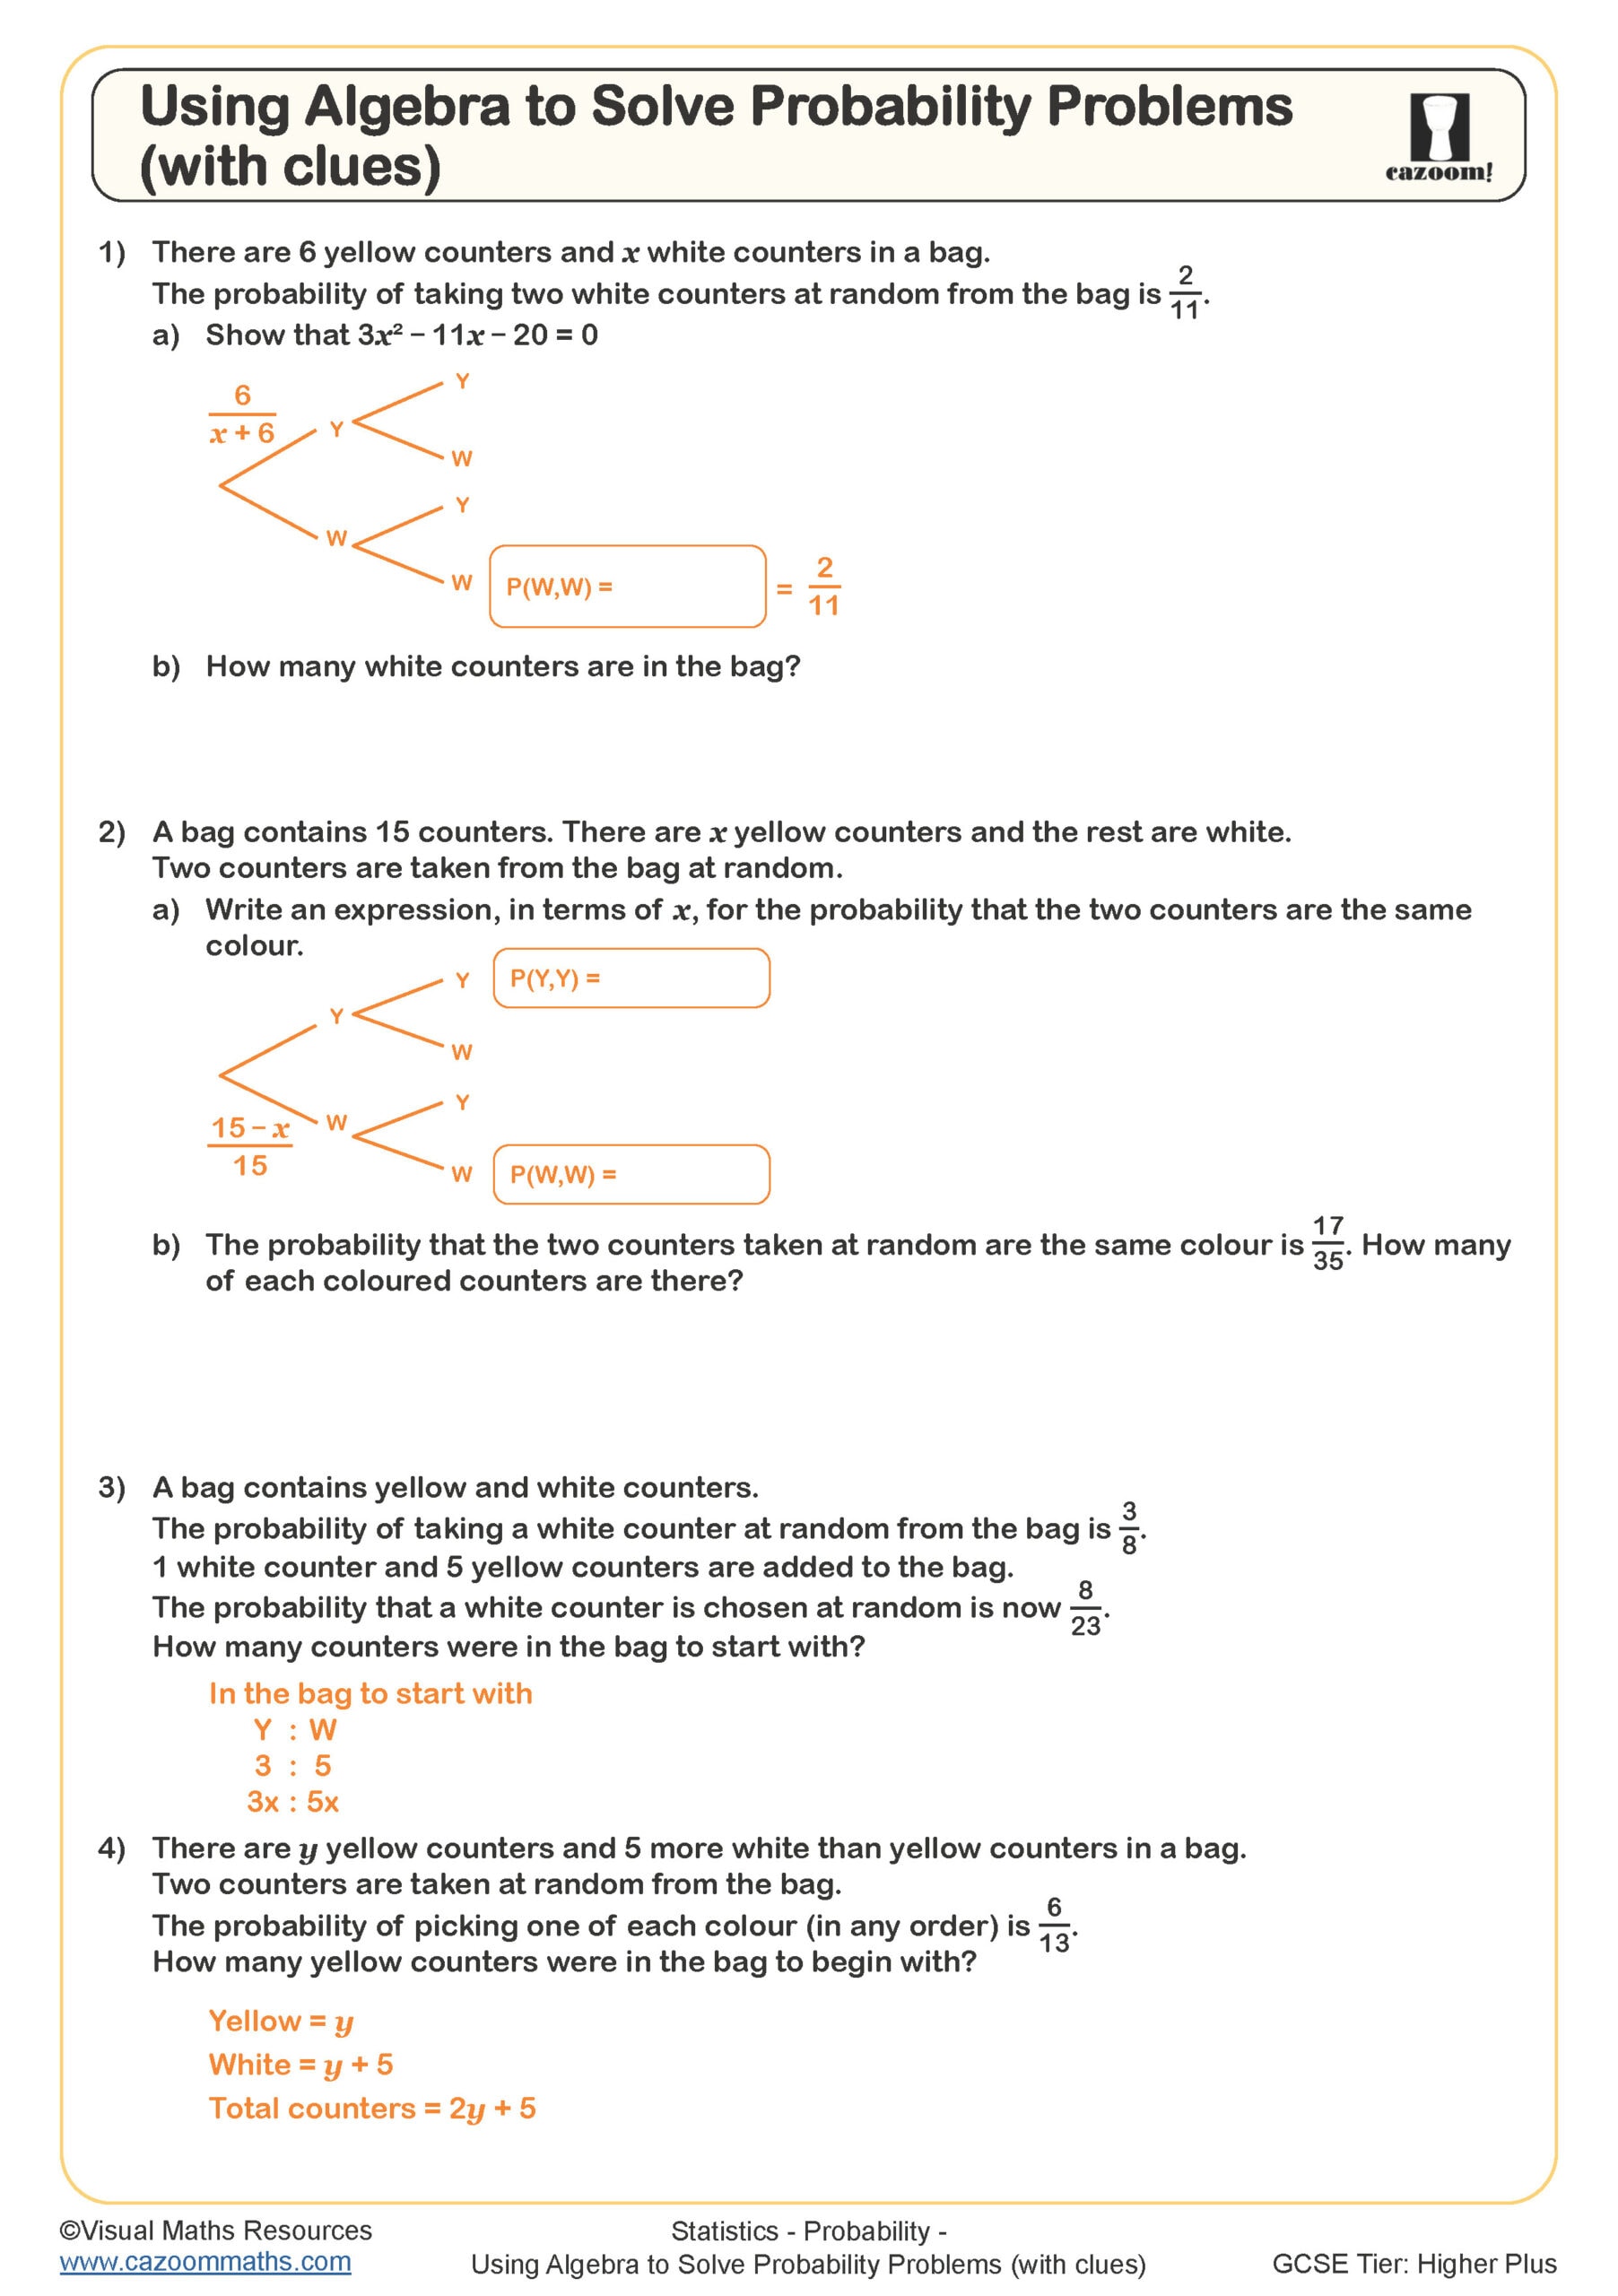
Progression across Year 10 and Year 11 increases complexity rather than introducing entirely new techniques. Earlier questions involve independent events like coin tosses or dice rolls where probabilities remain constant. Later work introduces scenarios where probabilities change after the first event, such as selecting counters without replacement. Higher tier students also encounter three-stage tree diagrams and questions requiring algebraic expressions within the probability calculations.
How do you calculate probabilities from a tree diagram?
Calculating from tree diagrams follows two fundamental rules: multiply probabilities along each path to find the probability of that complete outcome, then add the probabilities of different paths when the question asks for multiple possibilities. For example, to find the probability of getting at least one head when flipping two coins, students identify all relevant paths (HH, HT, TH) and add their individual probabilities together. Each path's probability comes from multiplying along its branches.
This mathematical structure connects directly to decision-making in medicine and engineering. Diagnostic tests use tree diagram principles to calculate the probability of accurate results given imperfect tests. In quality control, manufacturers apply these methods to determine batch reliability when testing multiple components. Students often see exam questions involving coloured counters or faulty products because these contexts mirror real industrial probability applications where sequential testing occurs.
How do these worksheets help students master tree diagrams?
The worksheets scaffold learning by starting with completed tree structures where students focus solely on calculations, before progressing to questions requiring both construction and interpretation. Worked examples demonstrate the layout conventions, including how to position probabilities on branches and label outcomes clearly. This approach addresses the observation that many students understand the concept but lose marks through poor diagram organisation that leads to calculation errors.
Teachers use these resources flexibly across different classroom settings. They work effectively for intervention sessions with small groups who missed initial teaching, where students can work through examples at their own pace with answer sheets for immediate feedback. Many teachers assign them as targeted revision before assessments, particularly for students who struggle to distinguish between independent and dependent events. The structured progression also makes them suitable for paired work, where one student constructs the diagram whilst the other performs calculations, then partners compare answers.