Single Event Probability Worksheets
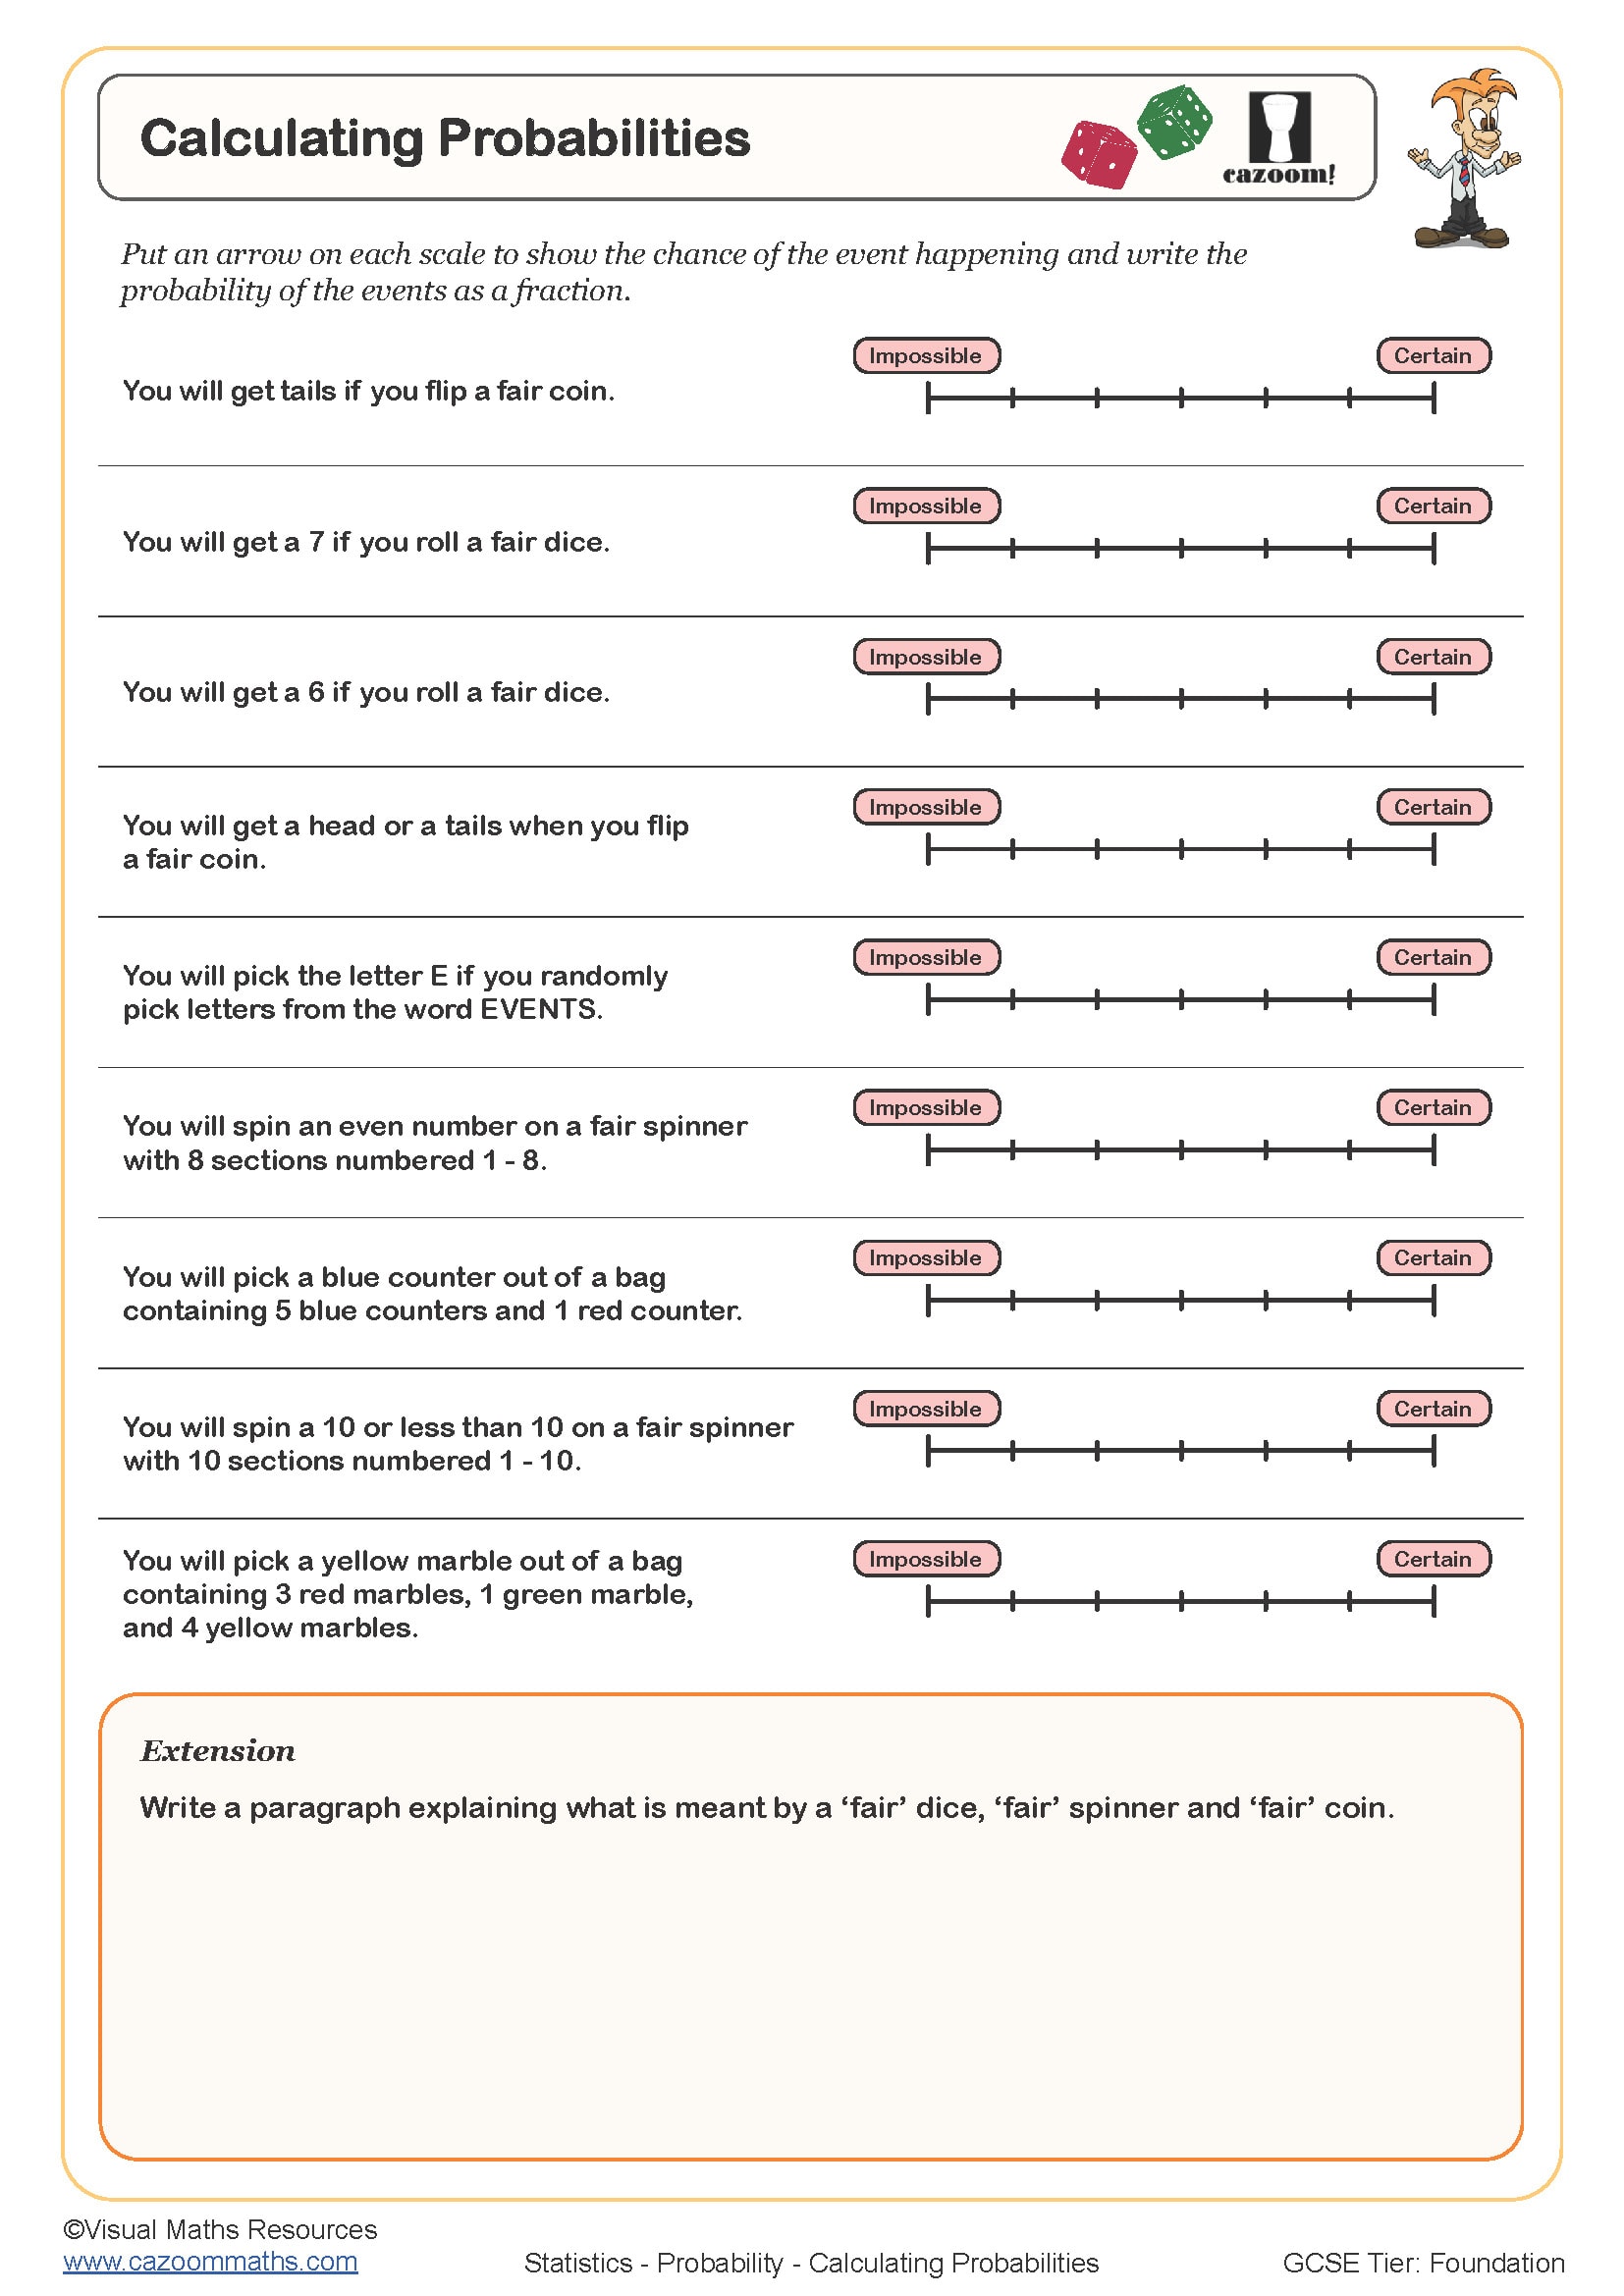
Calculating Probabilities
Year groups: 7
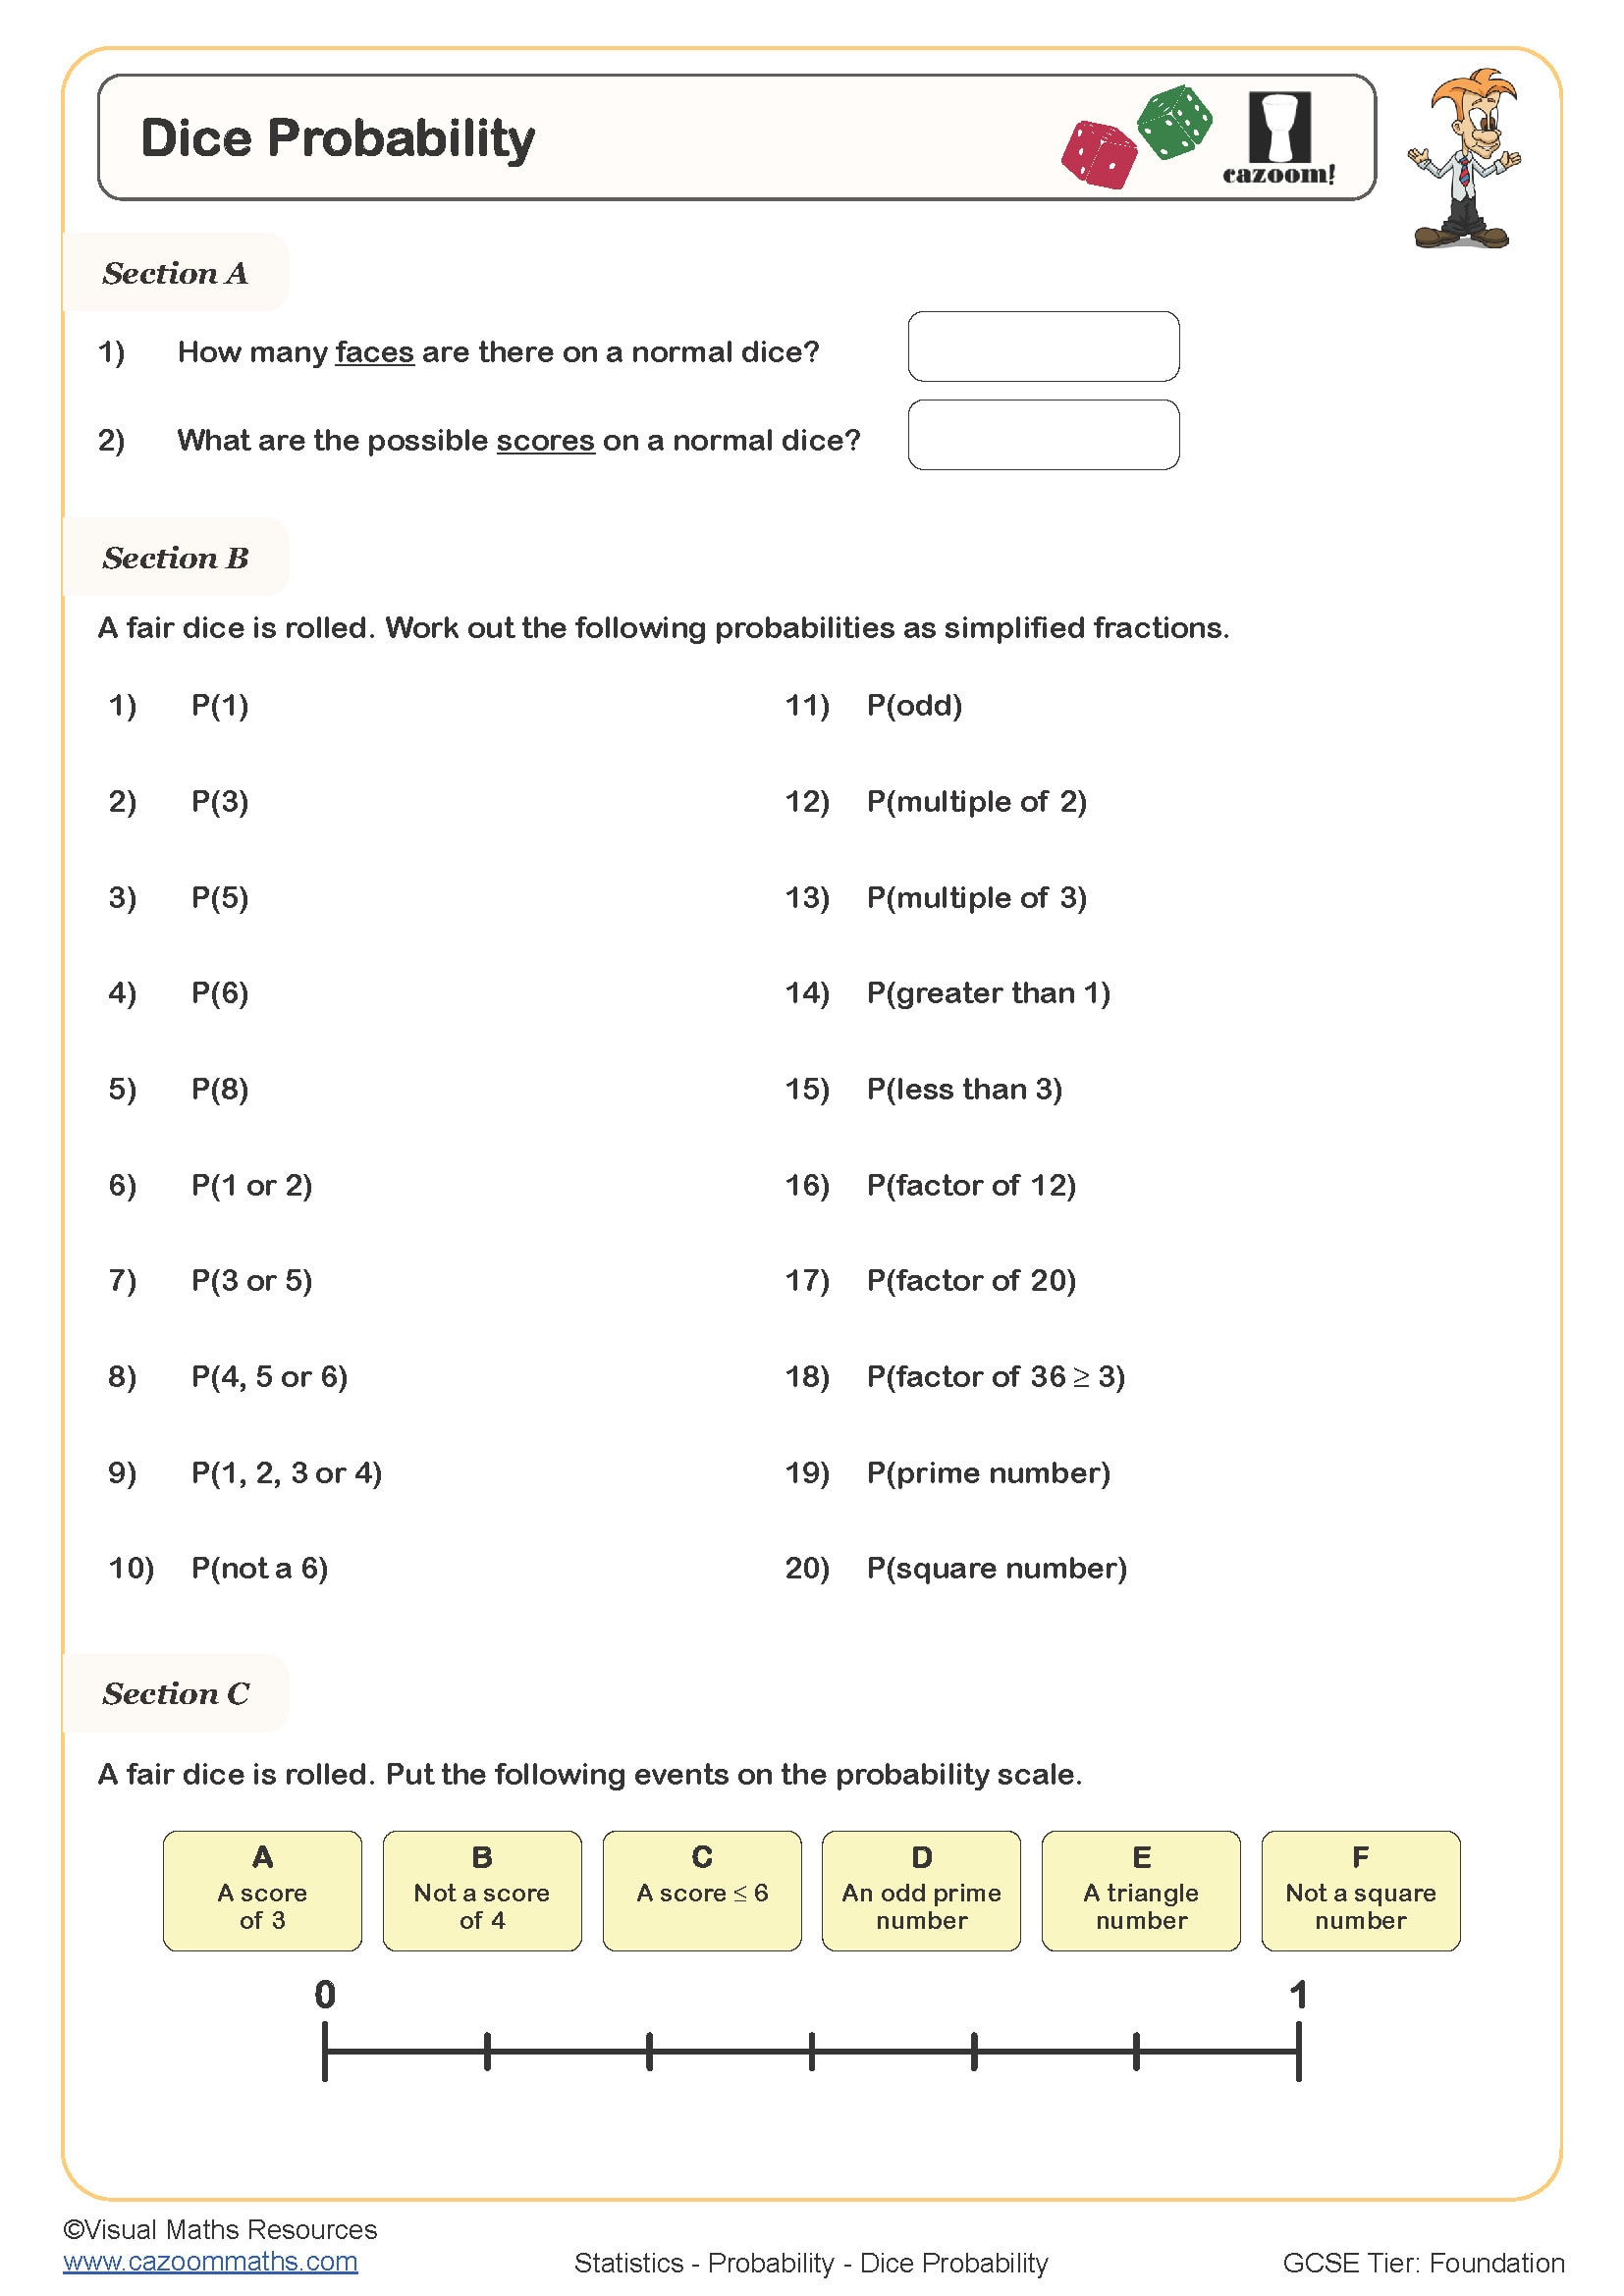
Dice Probability
Year groups: 7, 8
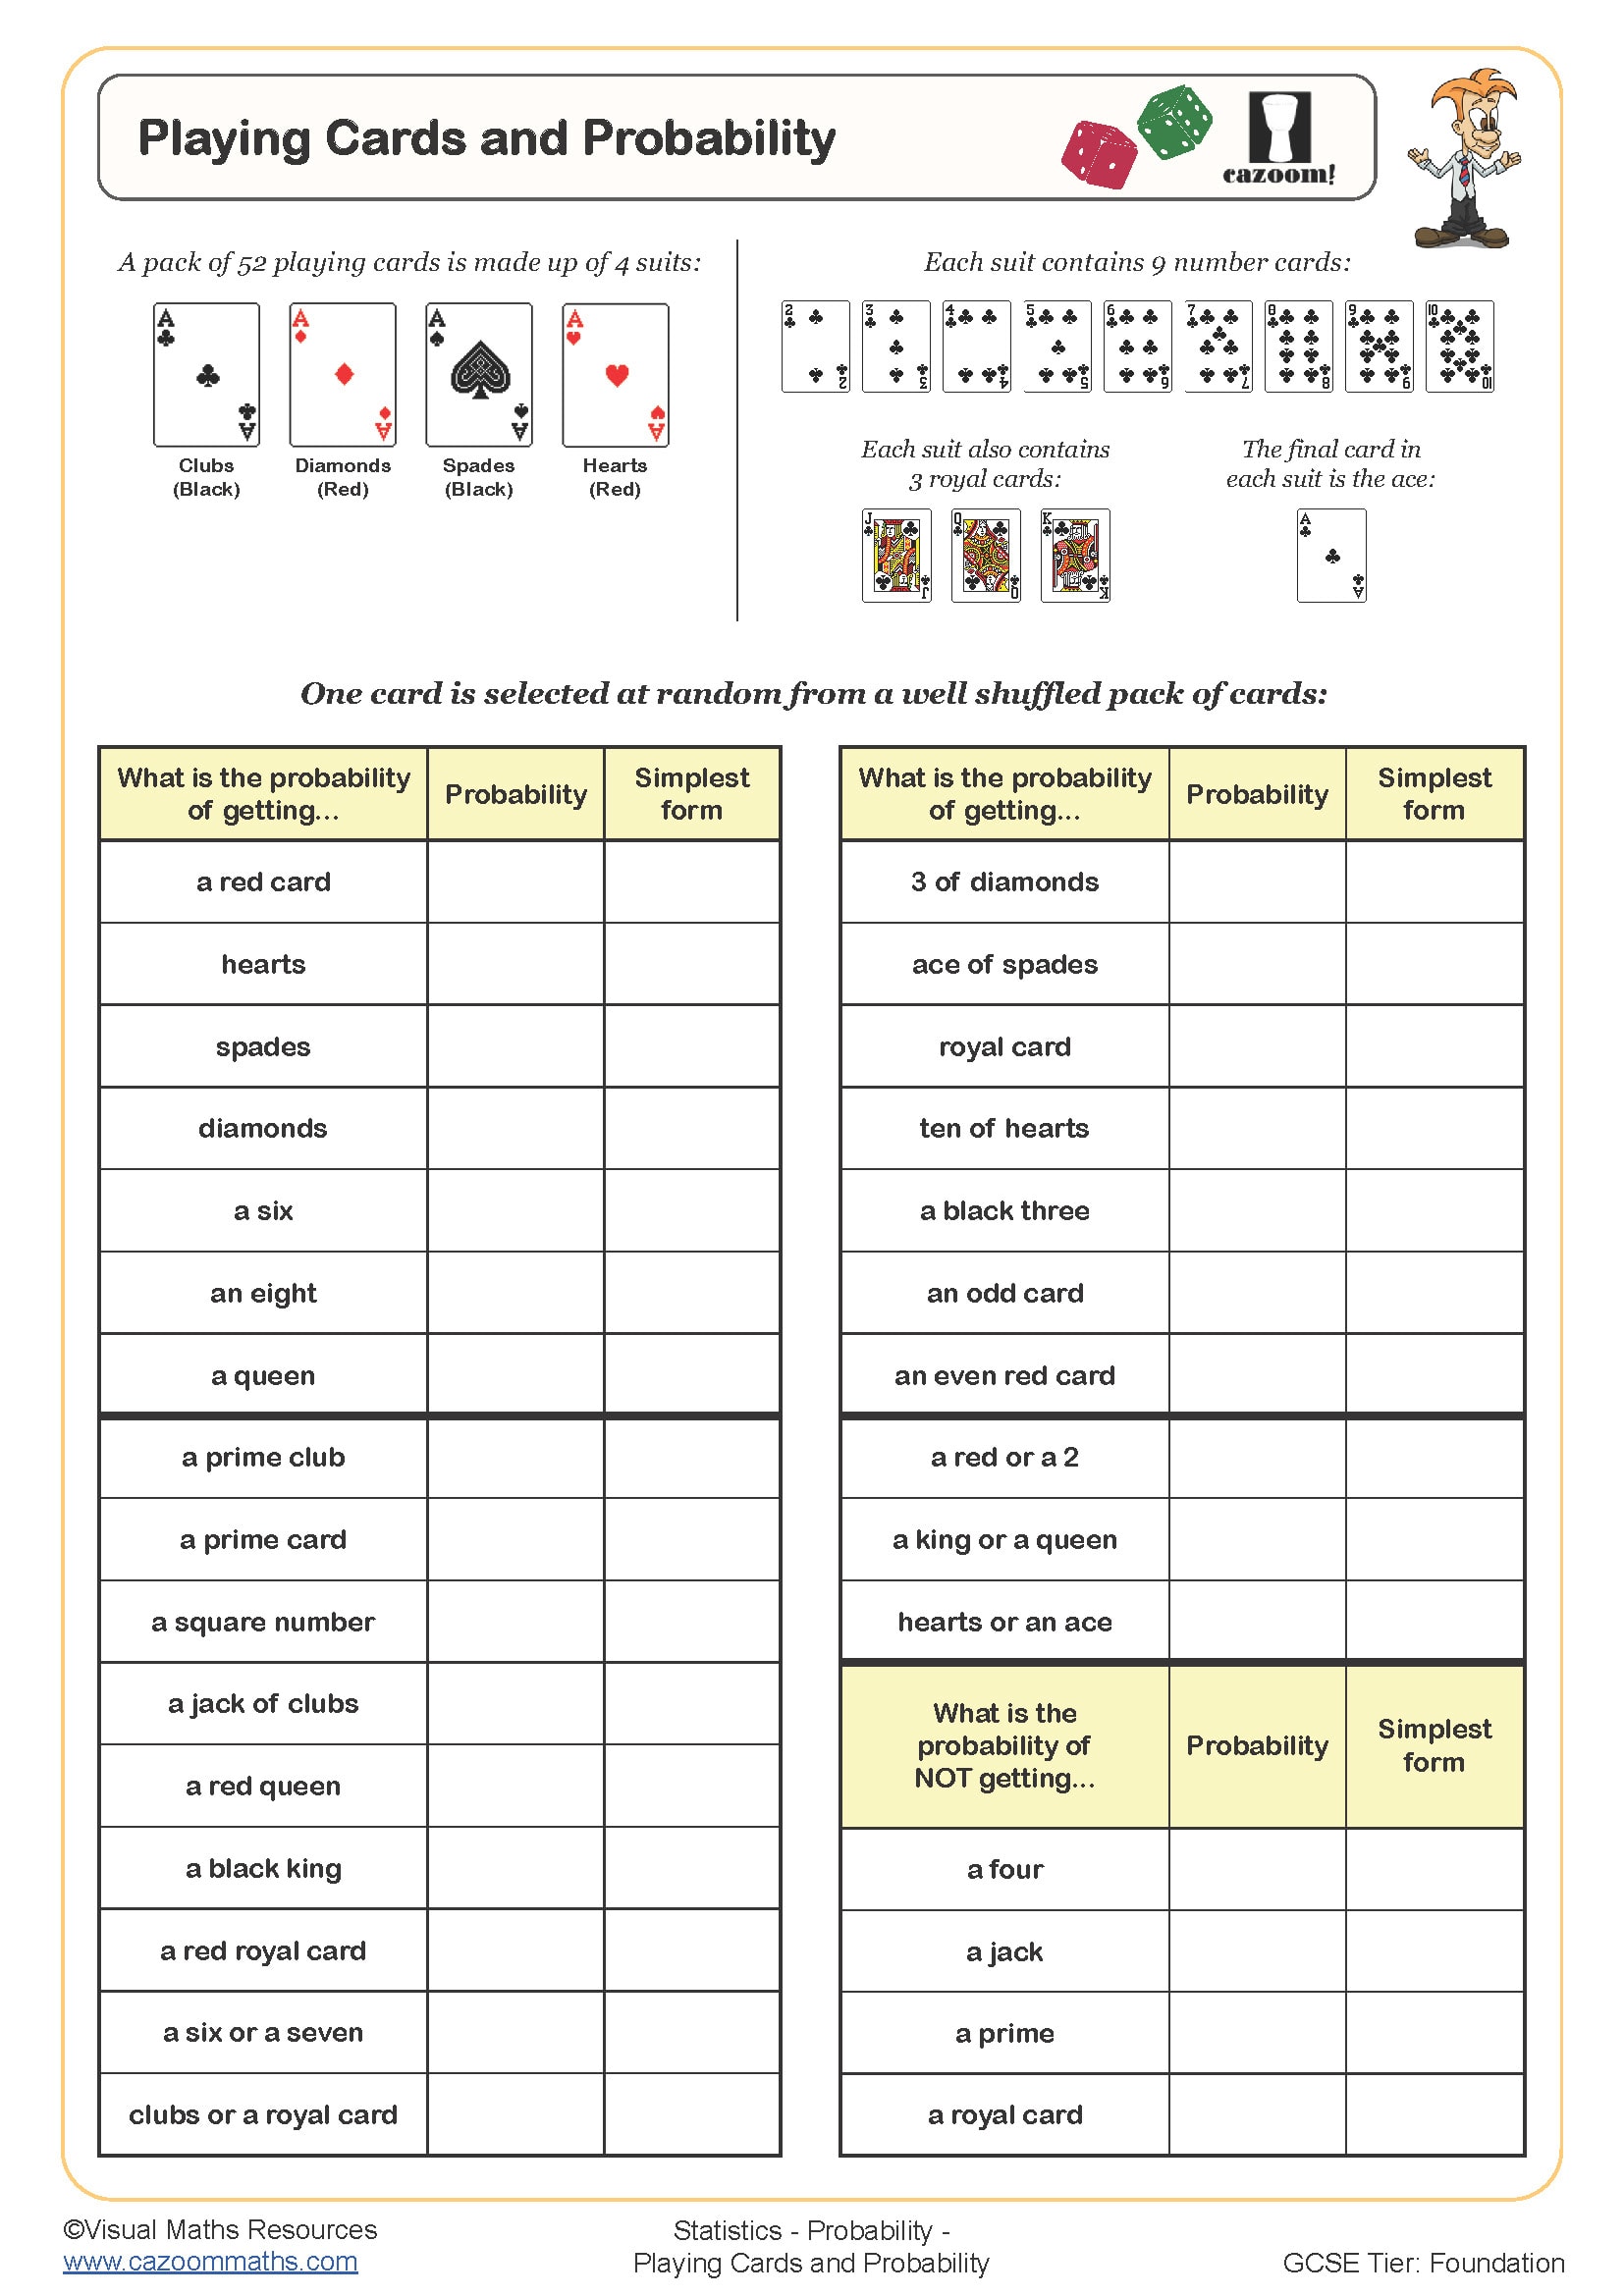
Playing Cards and Probability
Year groups: 7, 8, 9
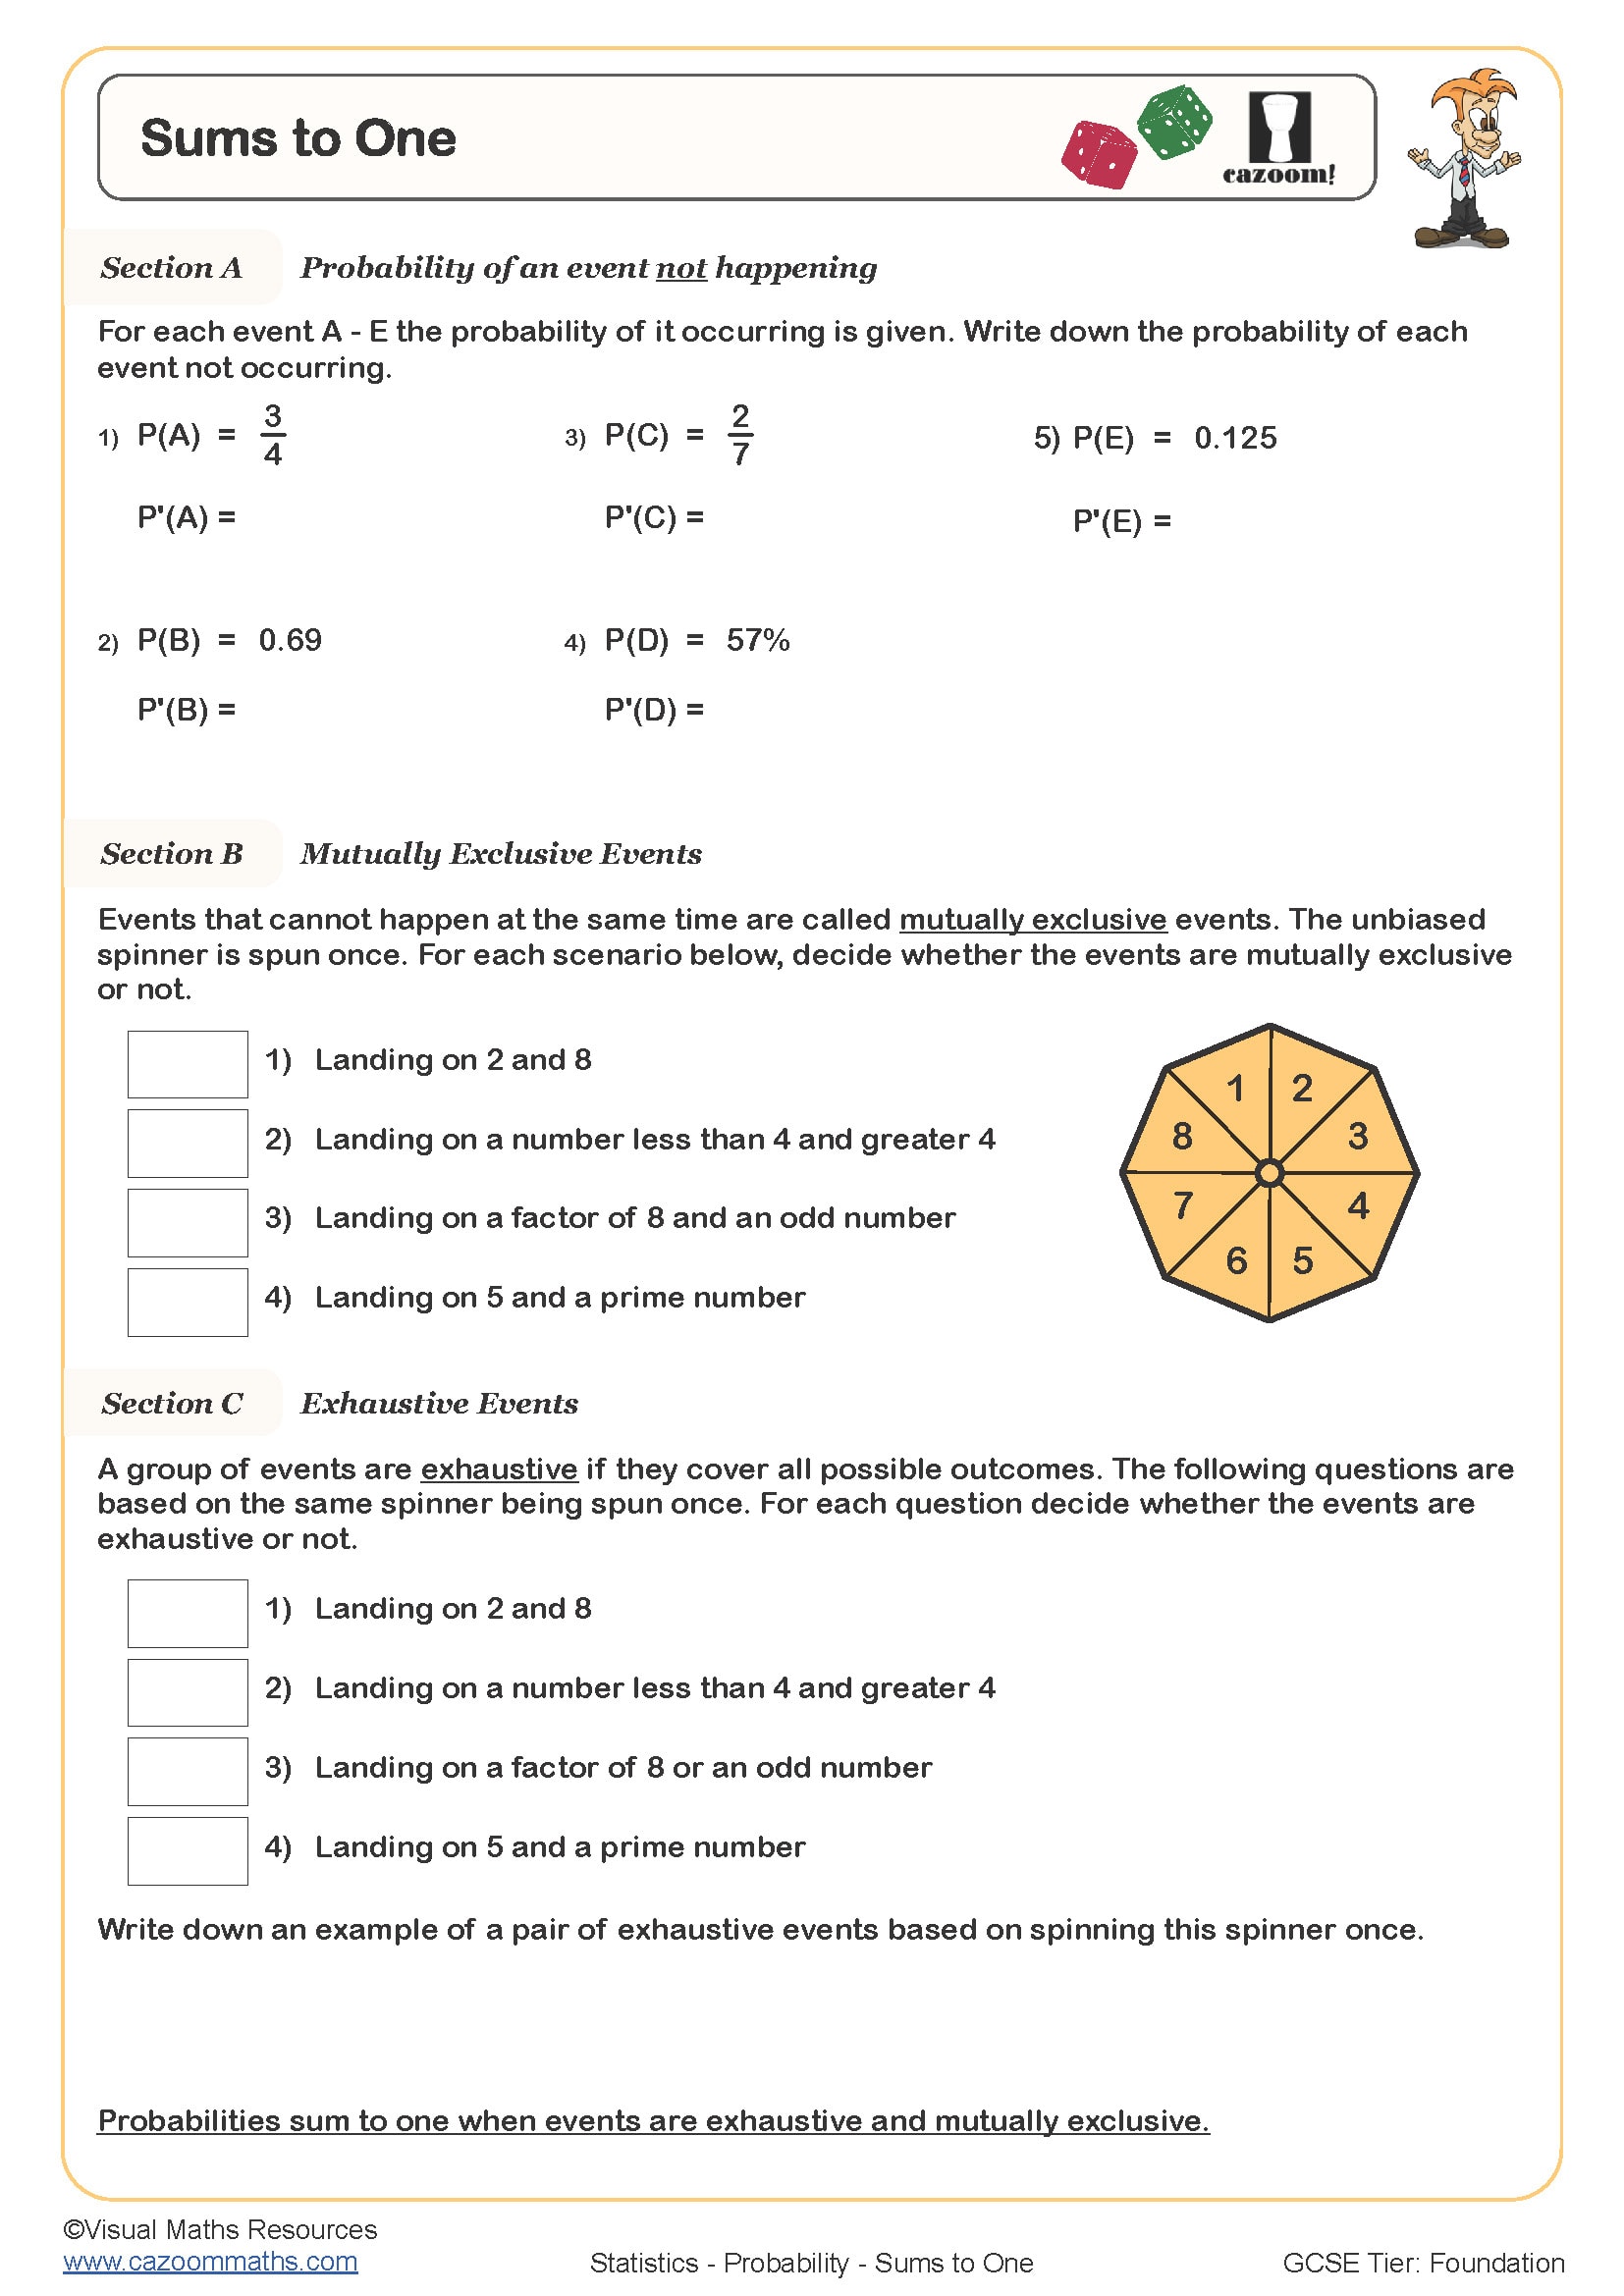
Sums to One
Year groups: 7, 8, 9
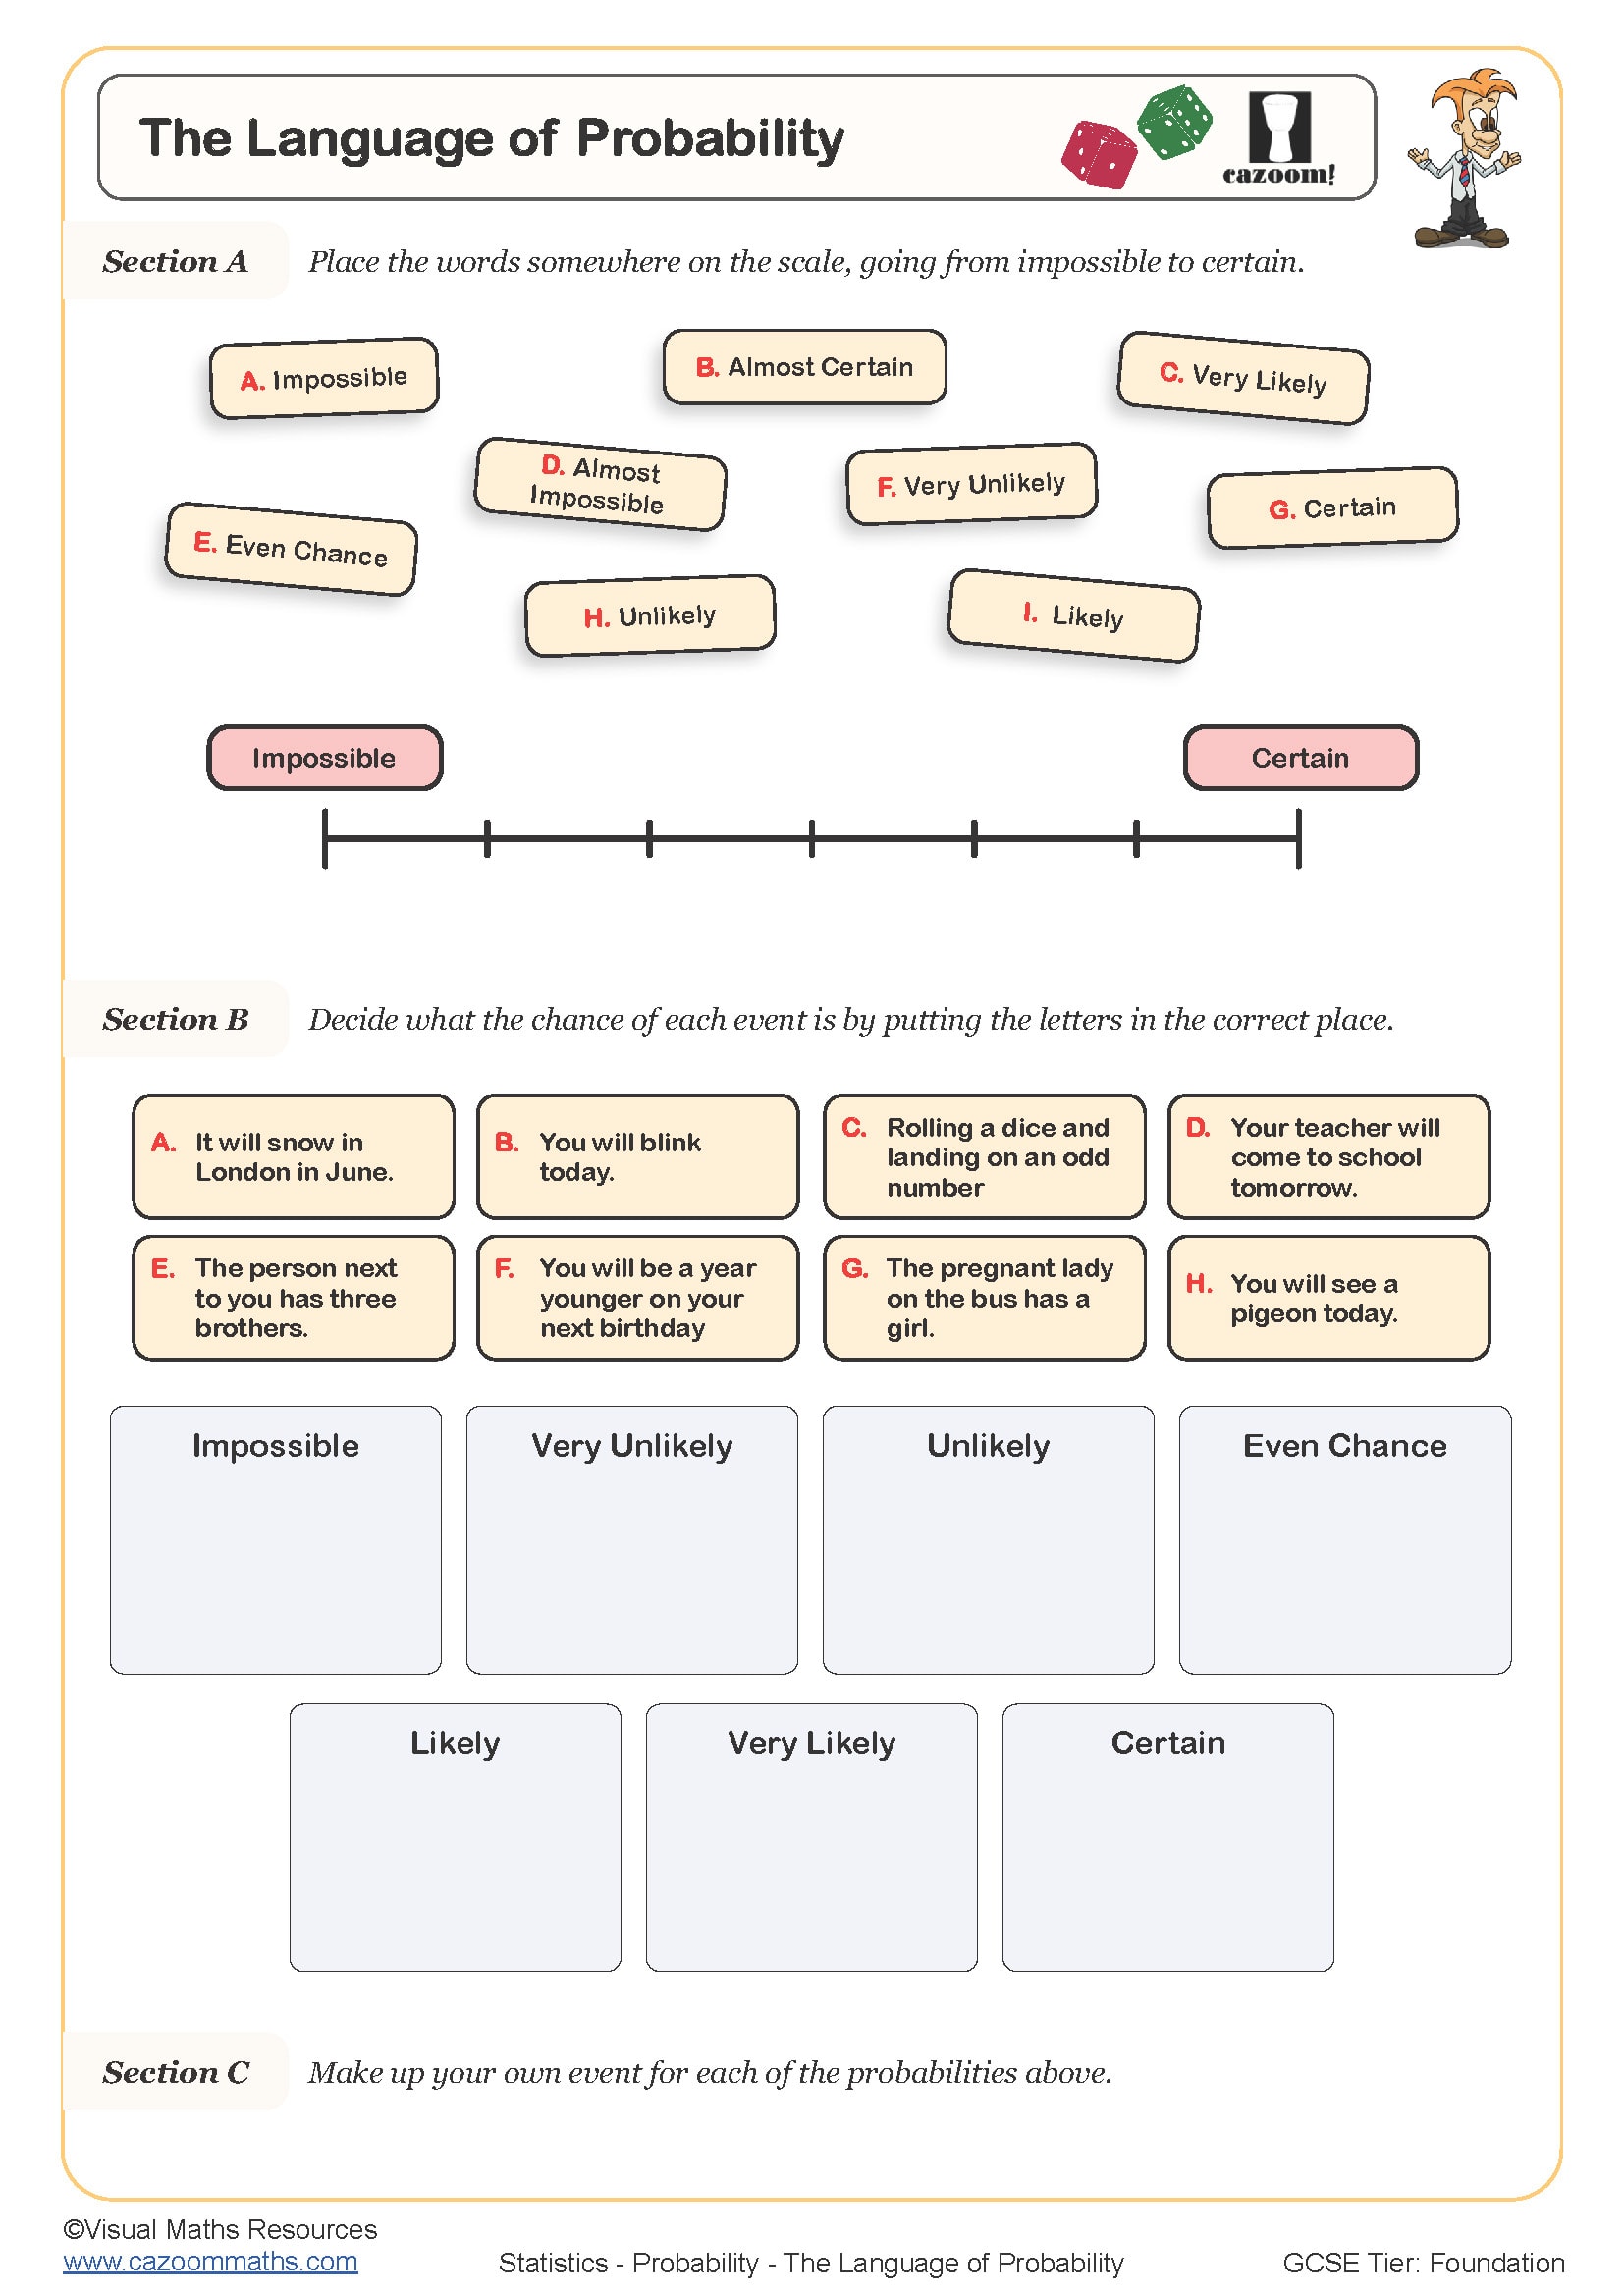
The Language of Probability
Year groups: 7
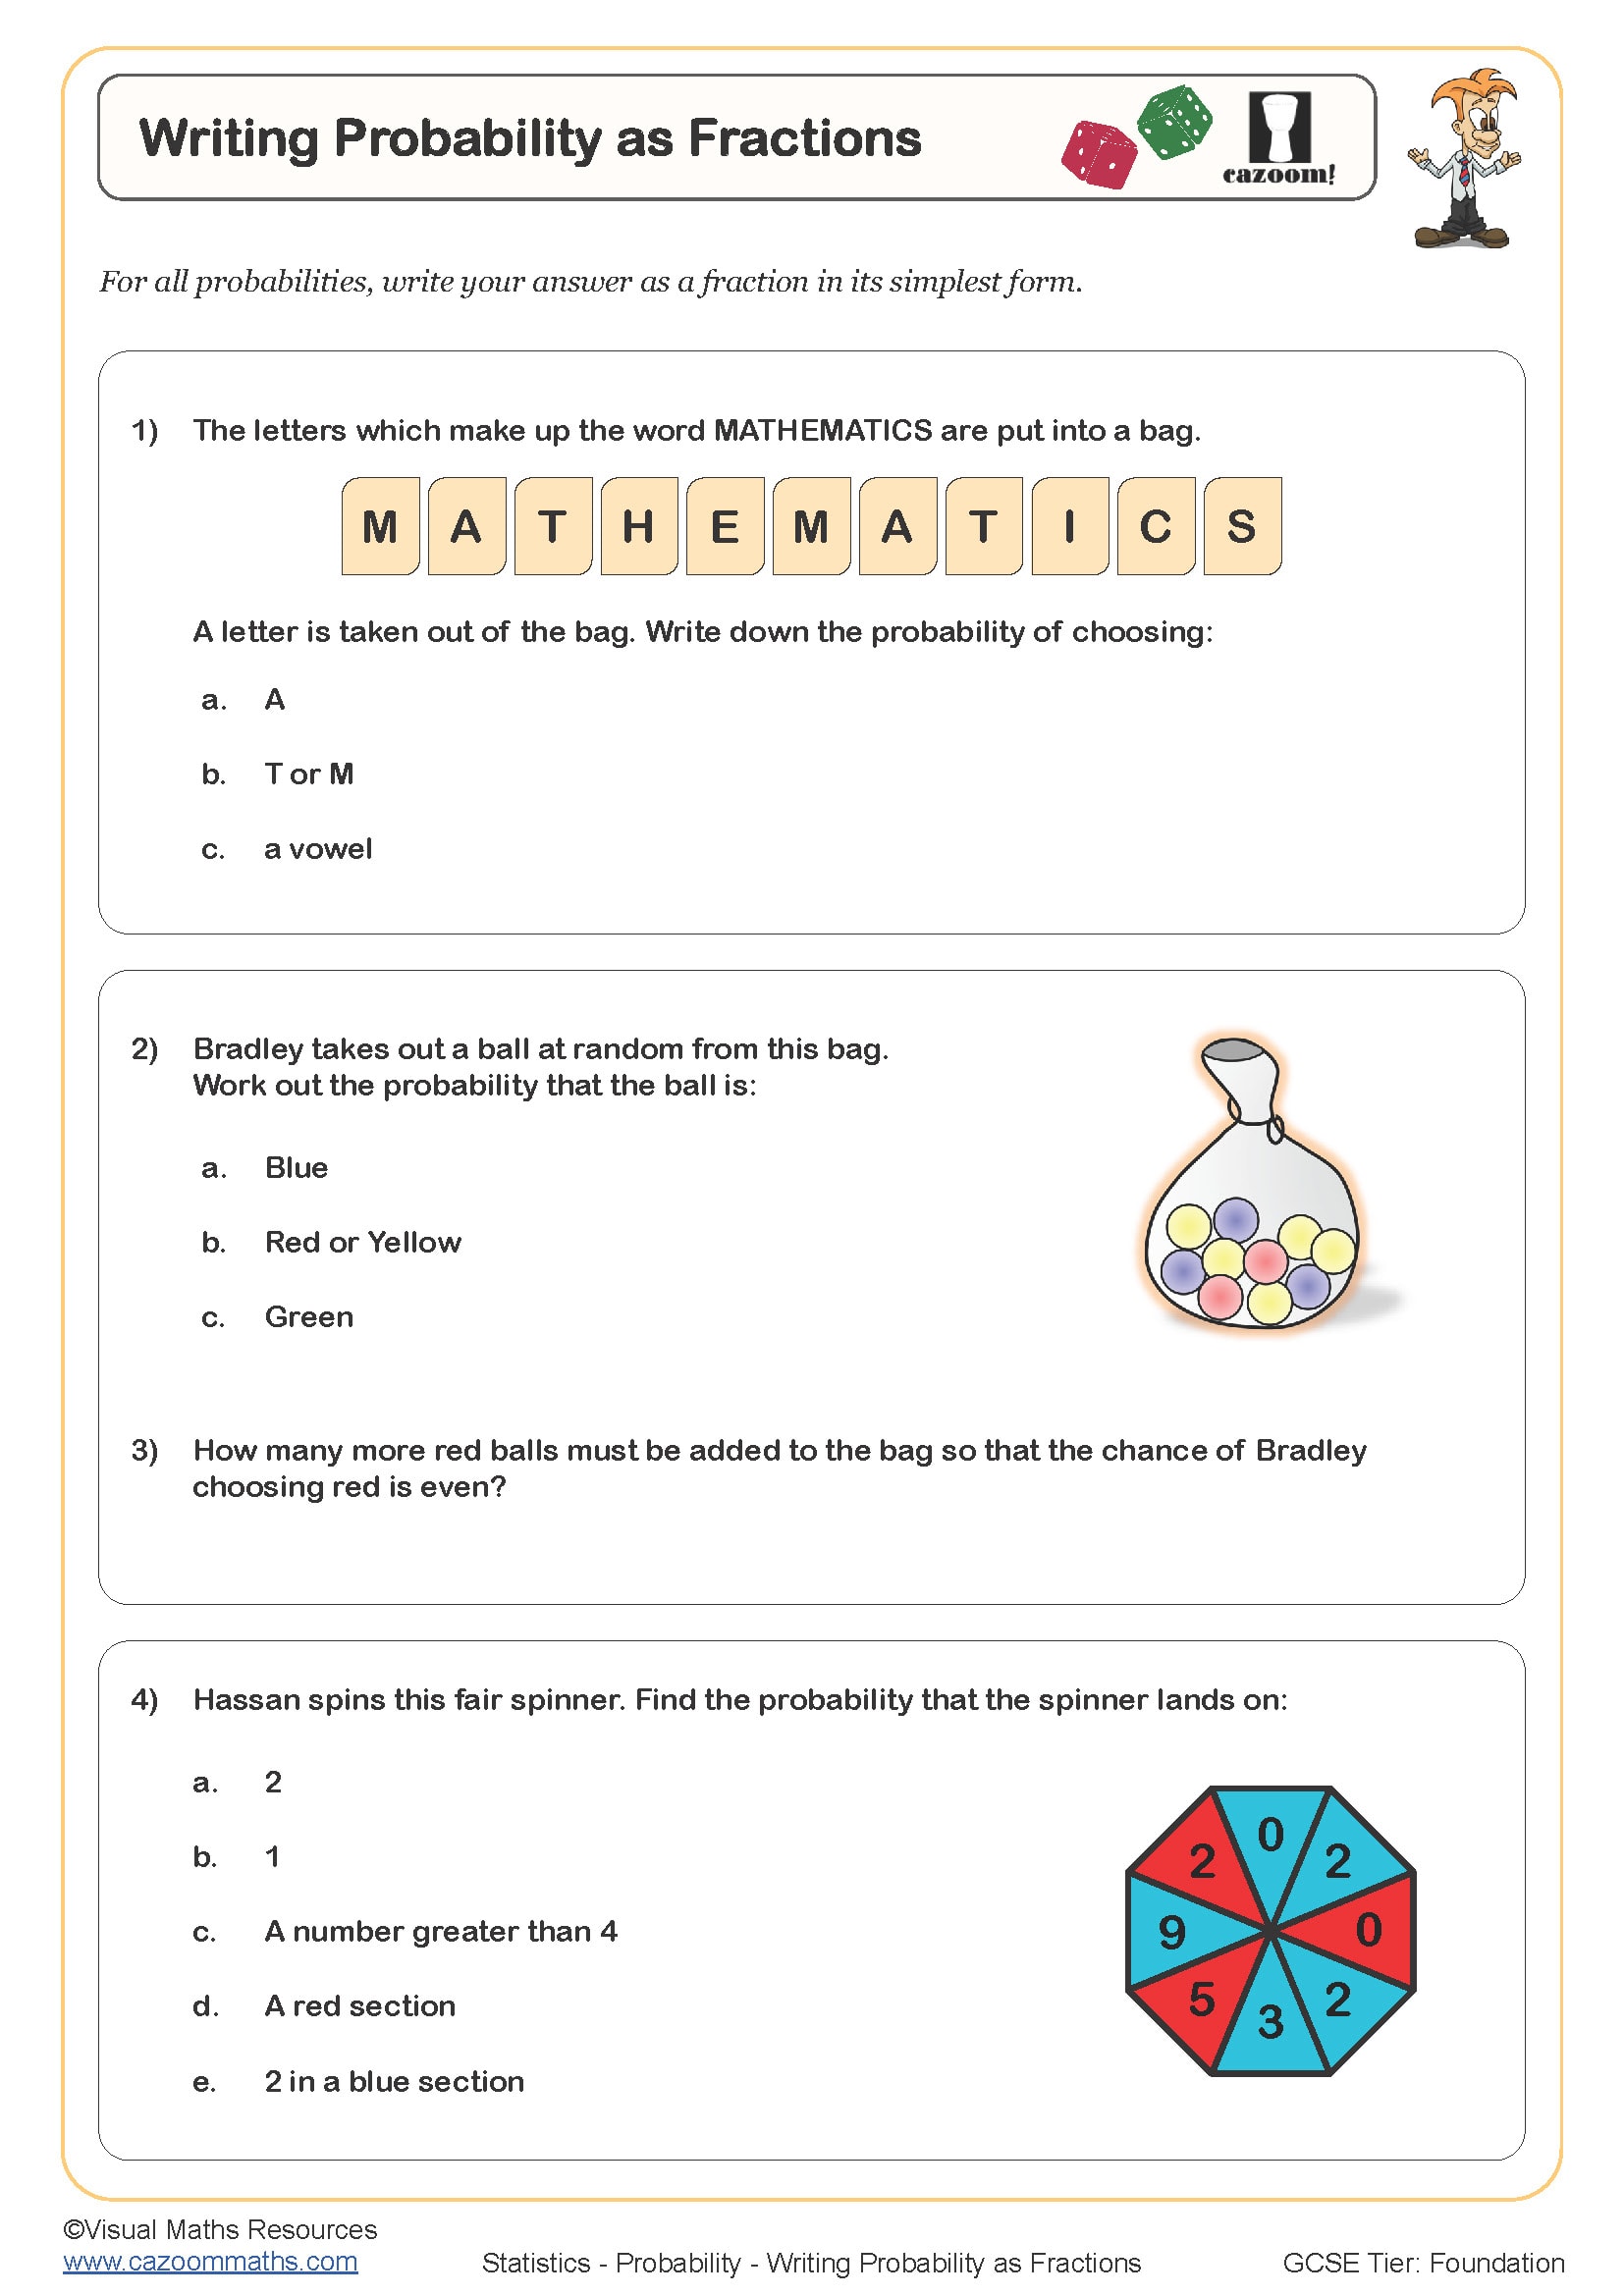
Writing Probabilty as Fractions
Year groups: 7, 8
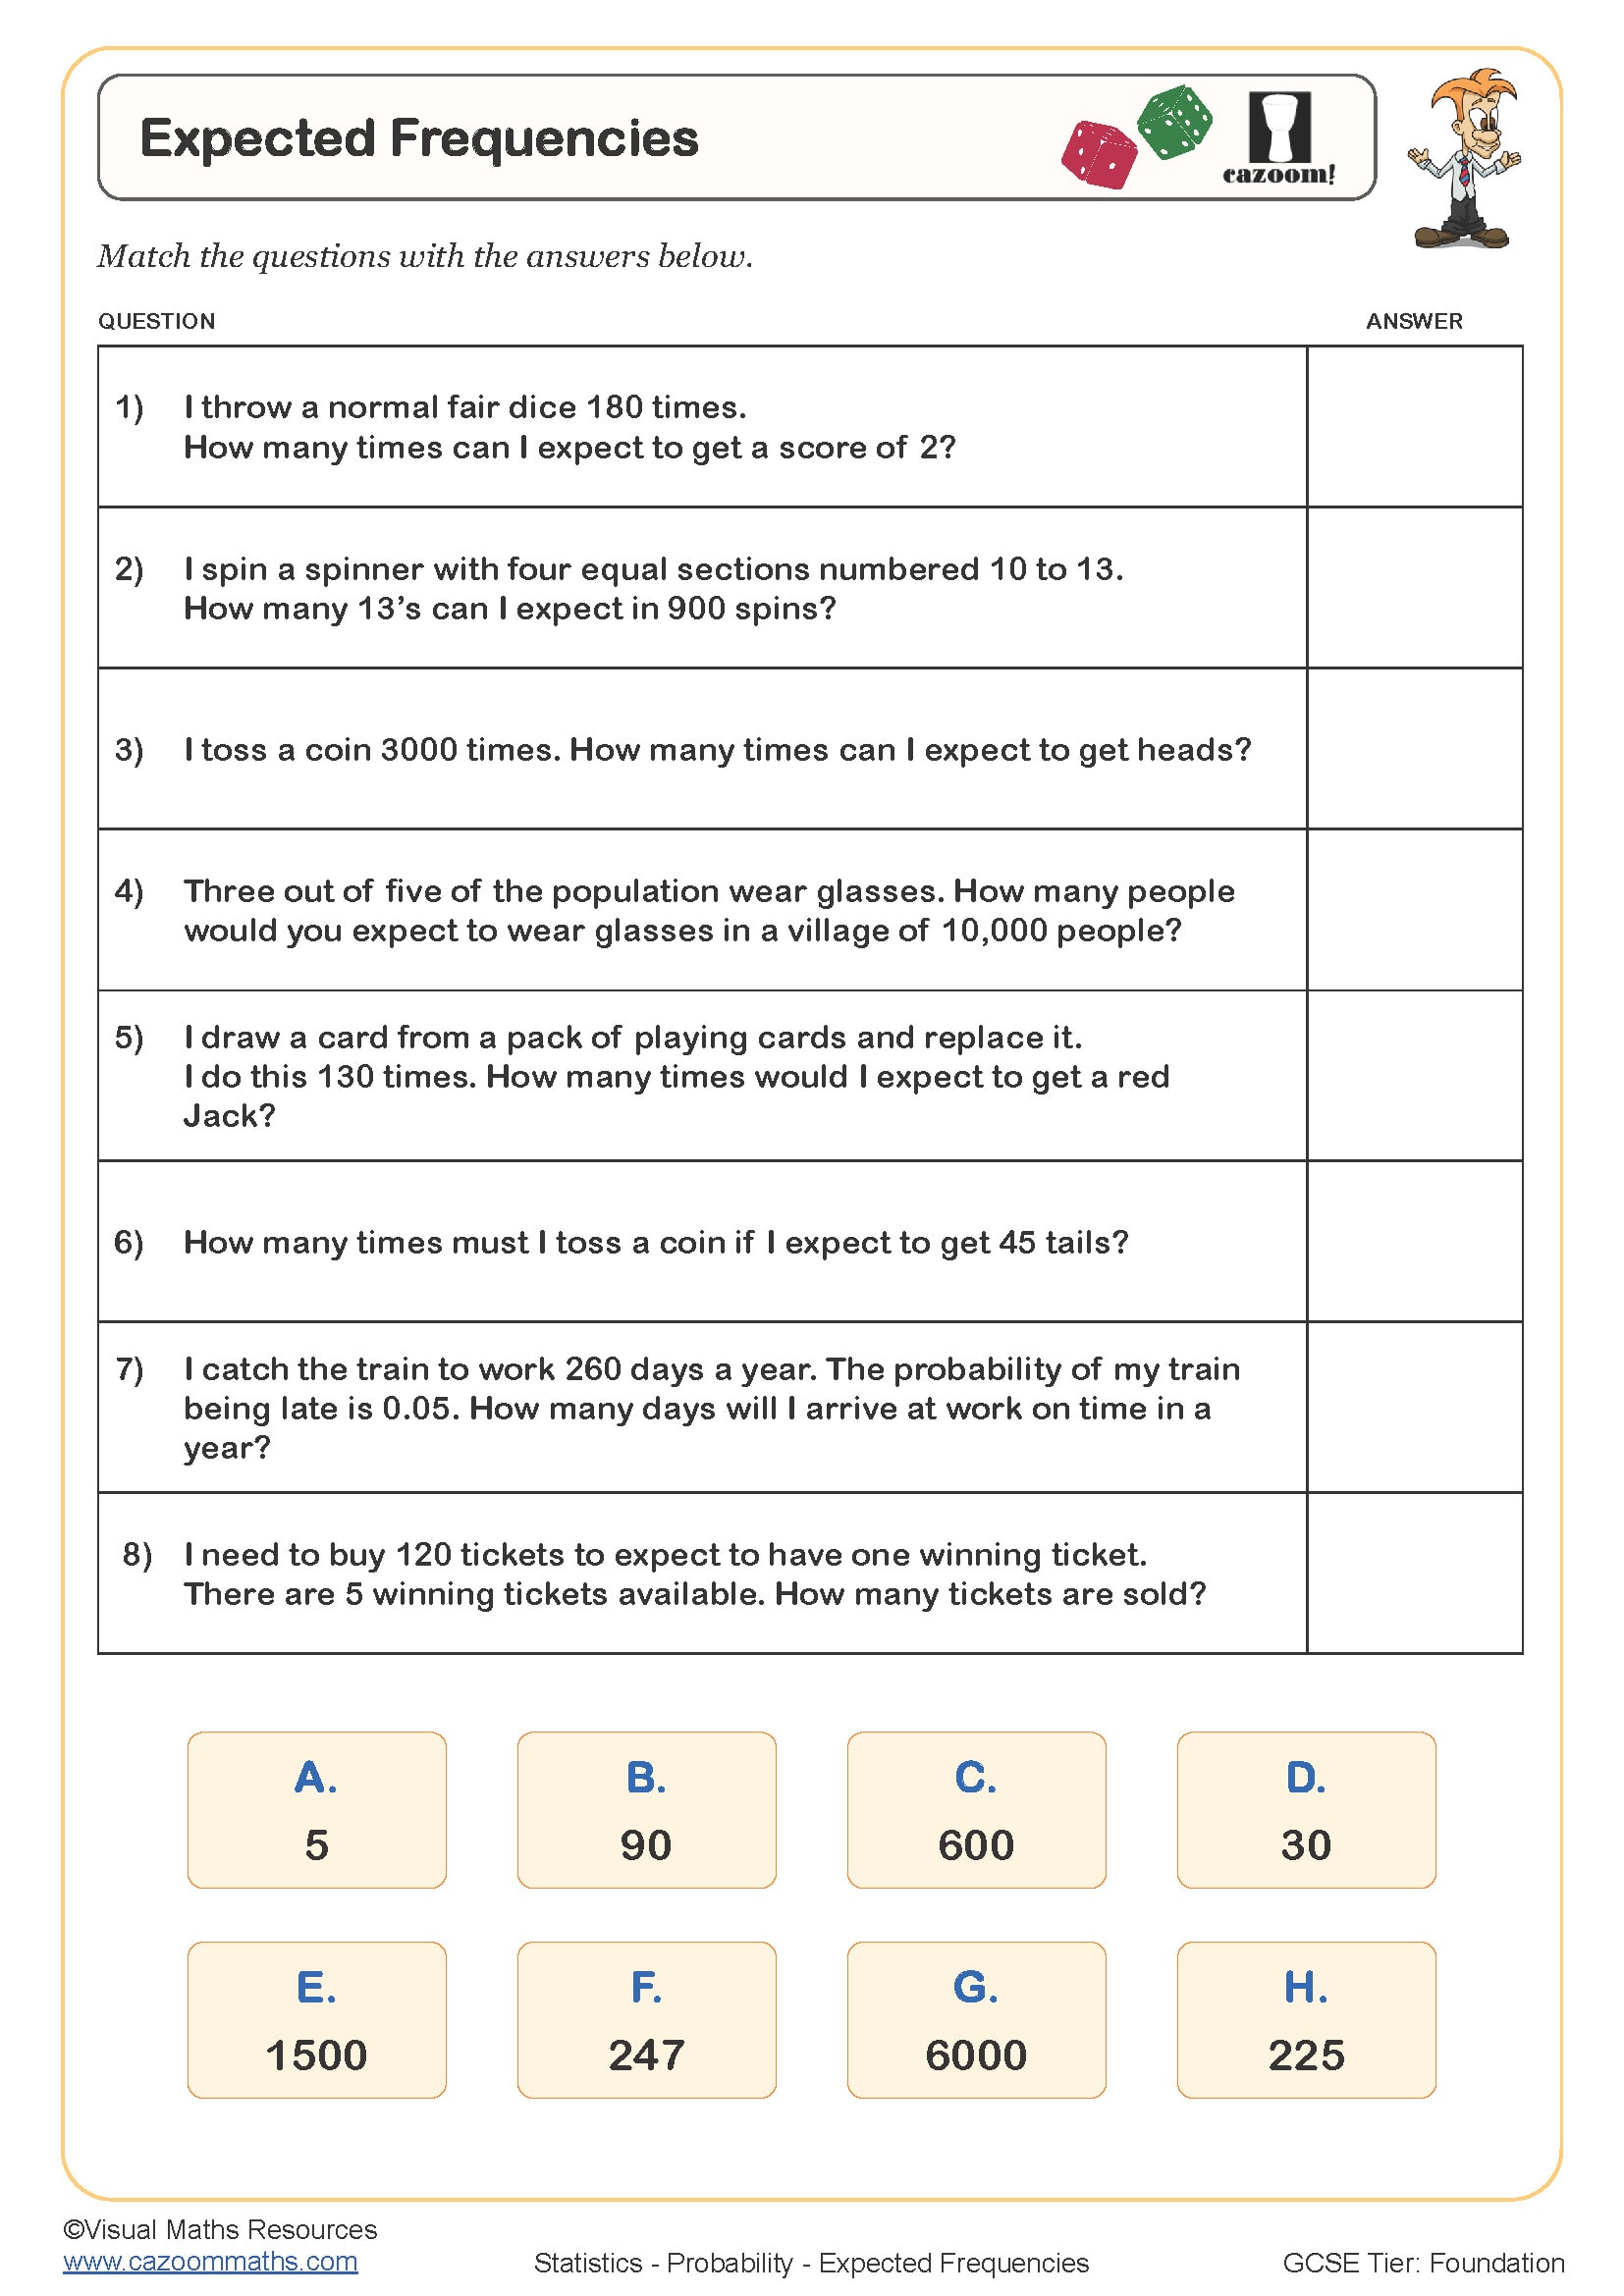
Expected Frequencies
Year groups: 8, 9, 10
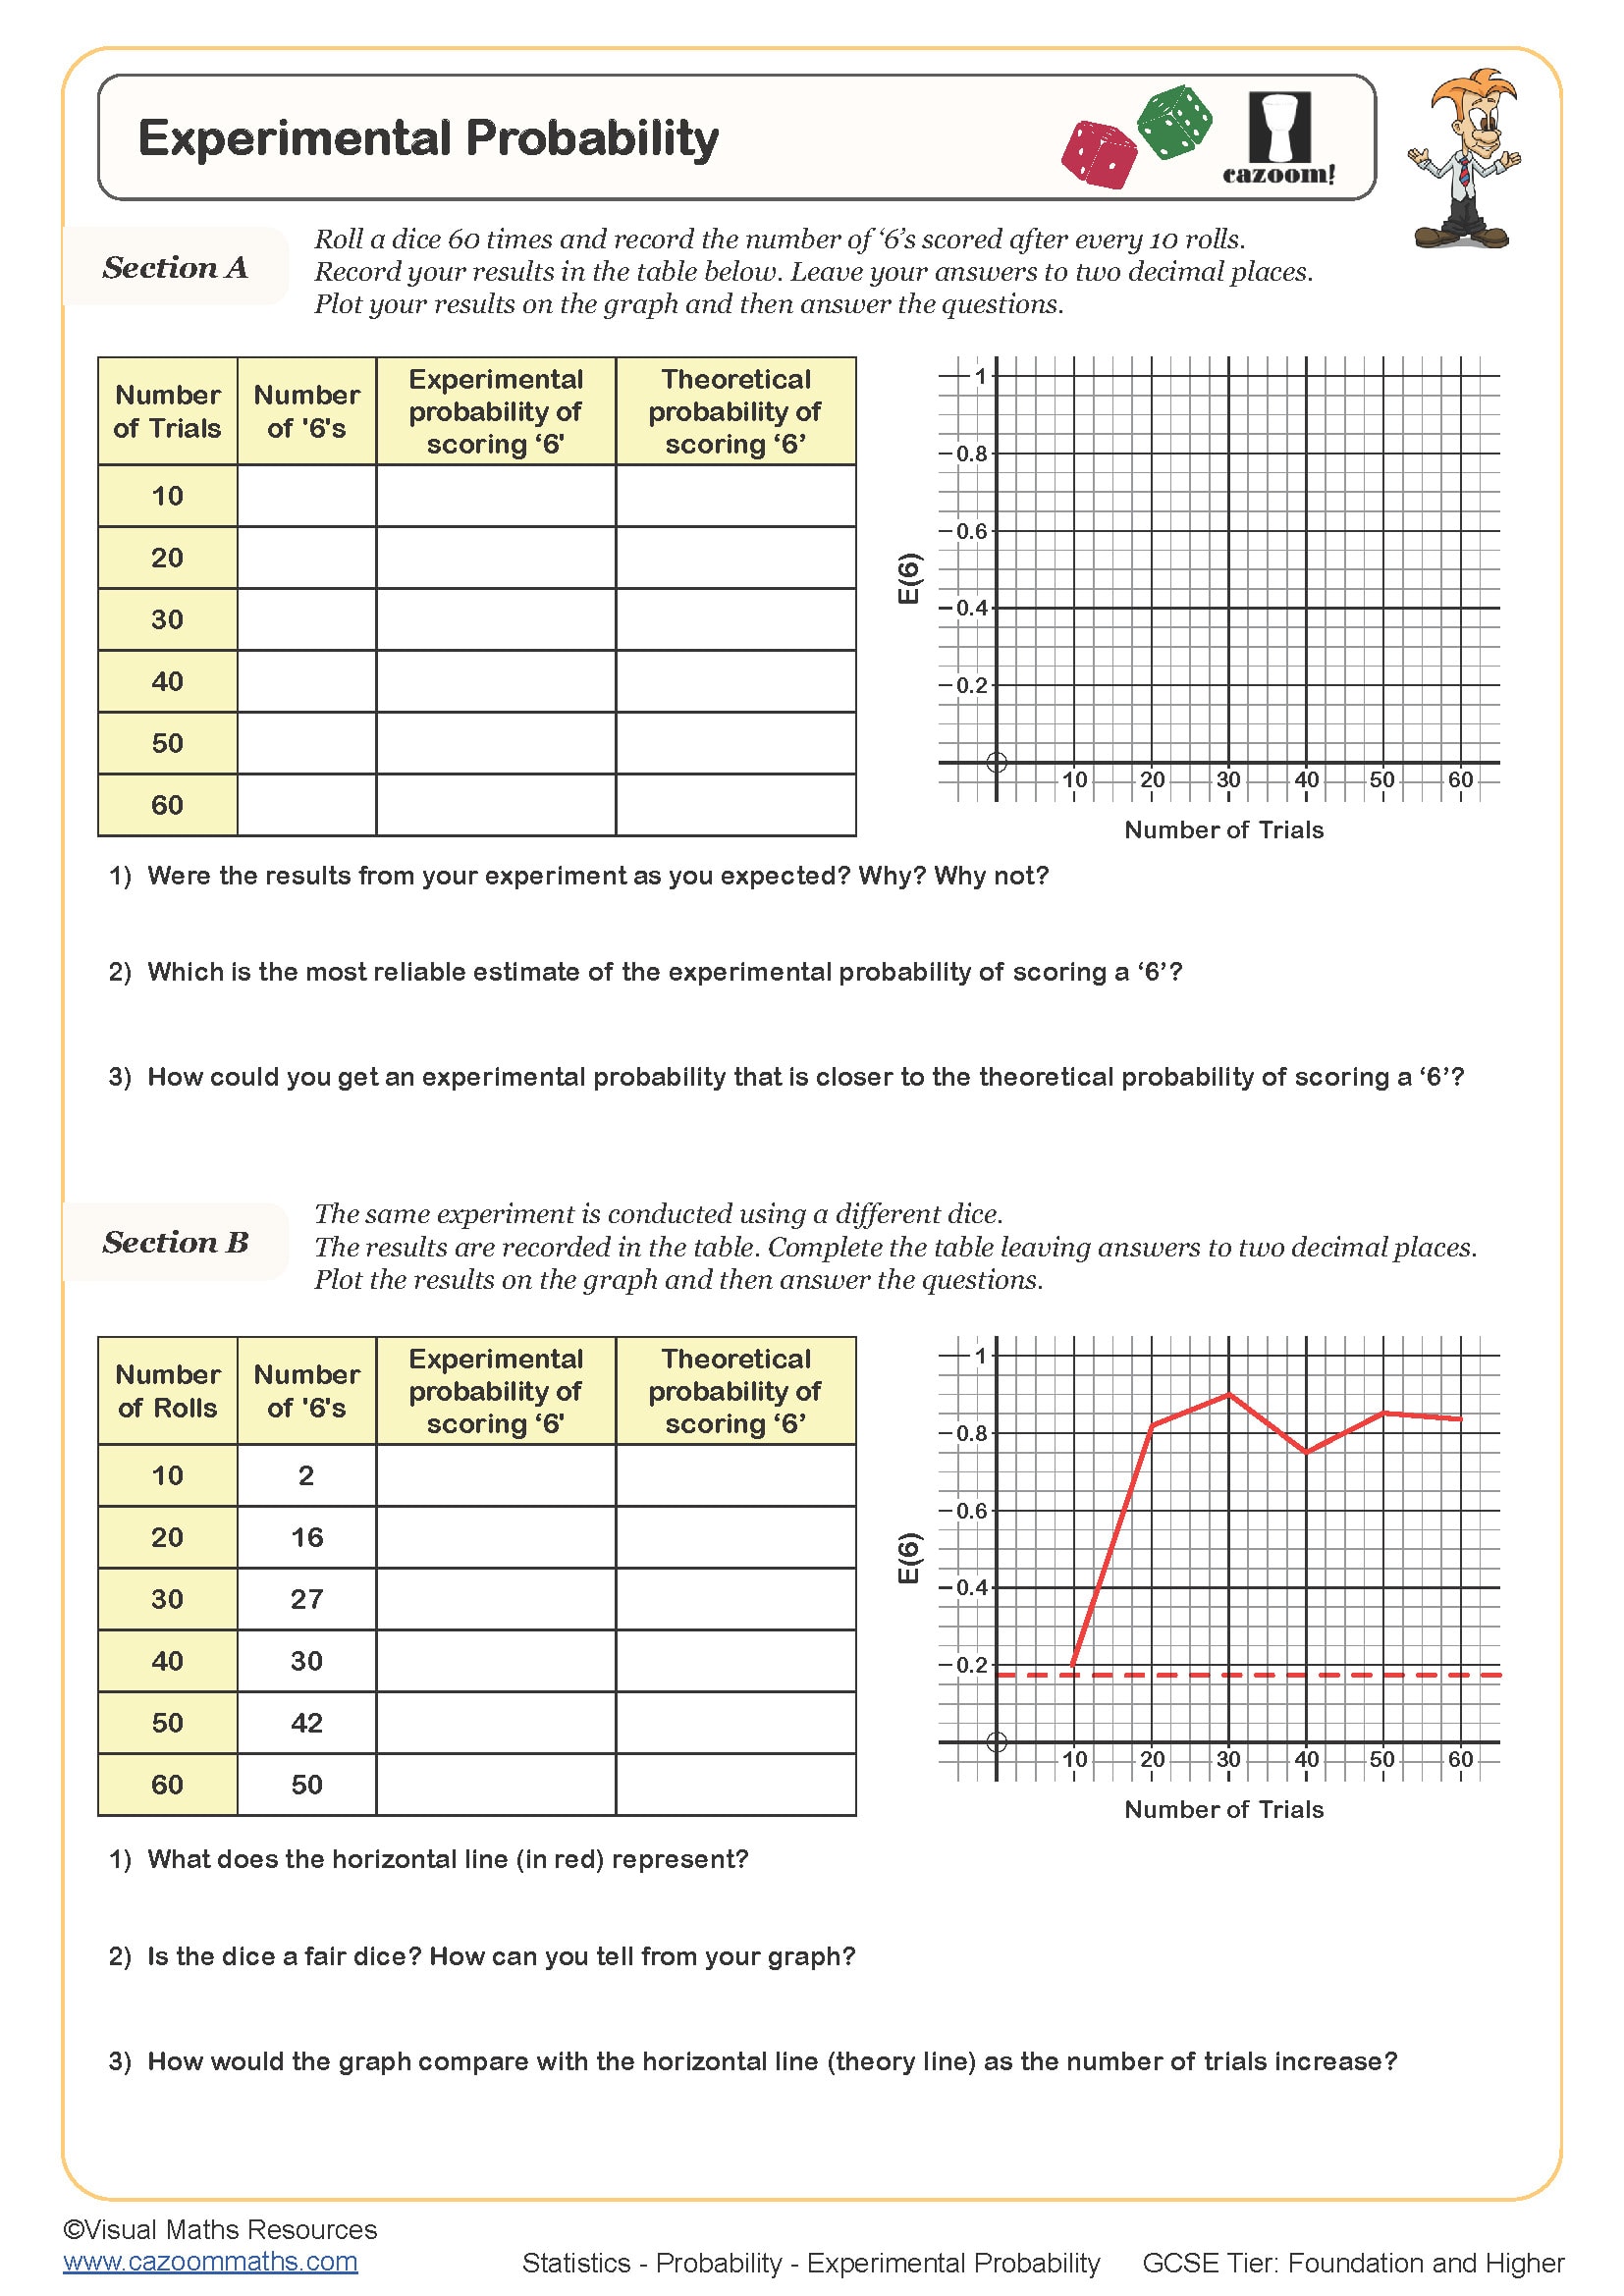
Experimental Probability
Year groups: 9, 10, 11
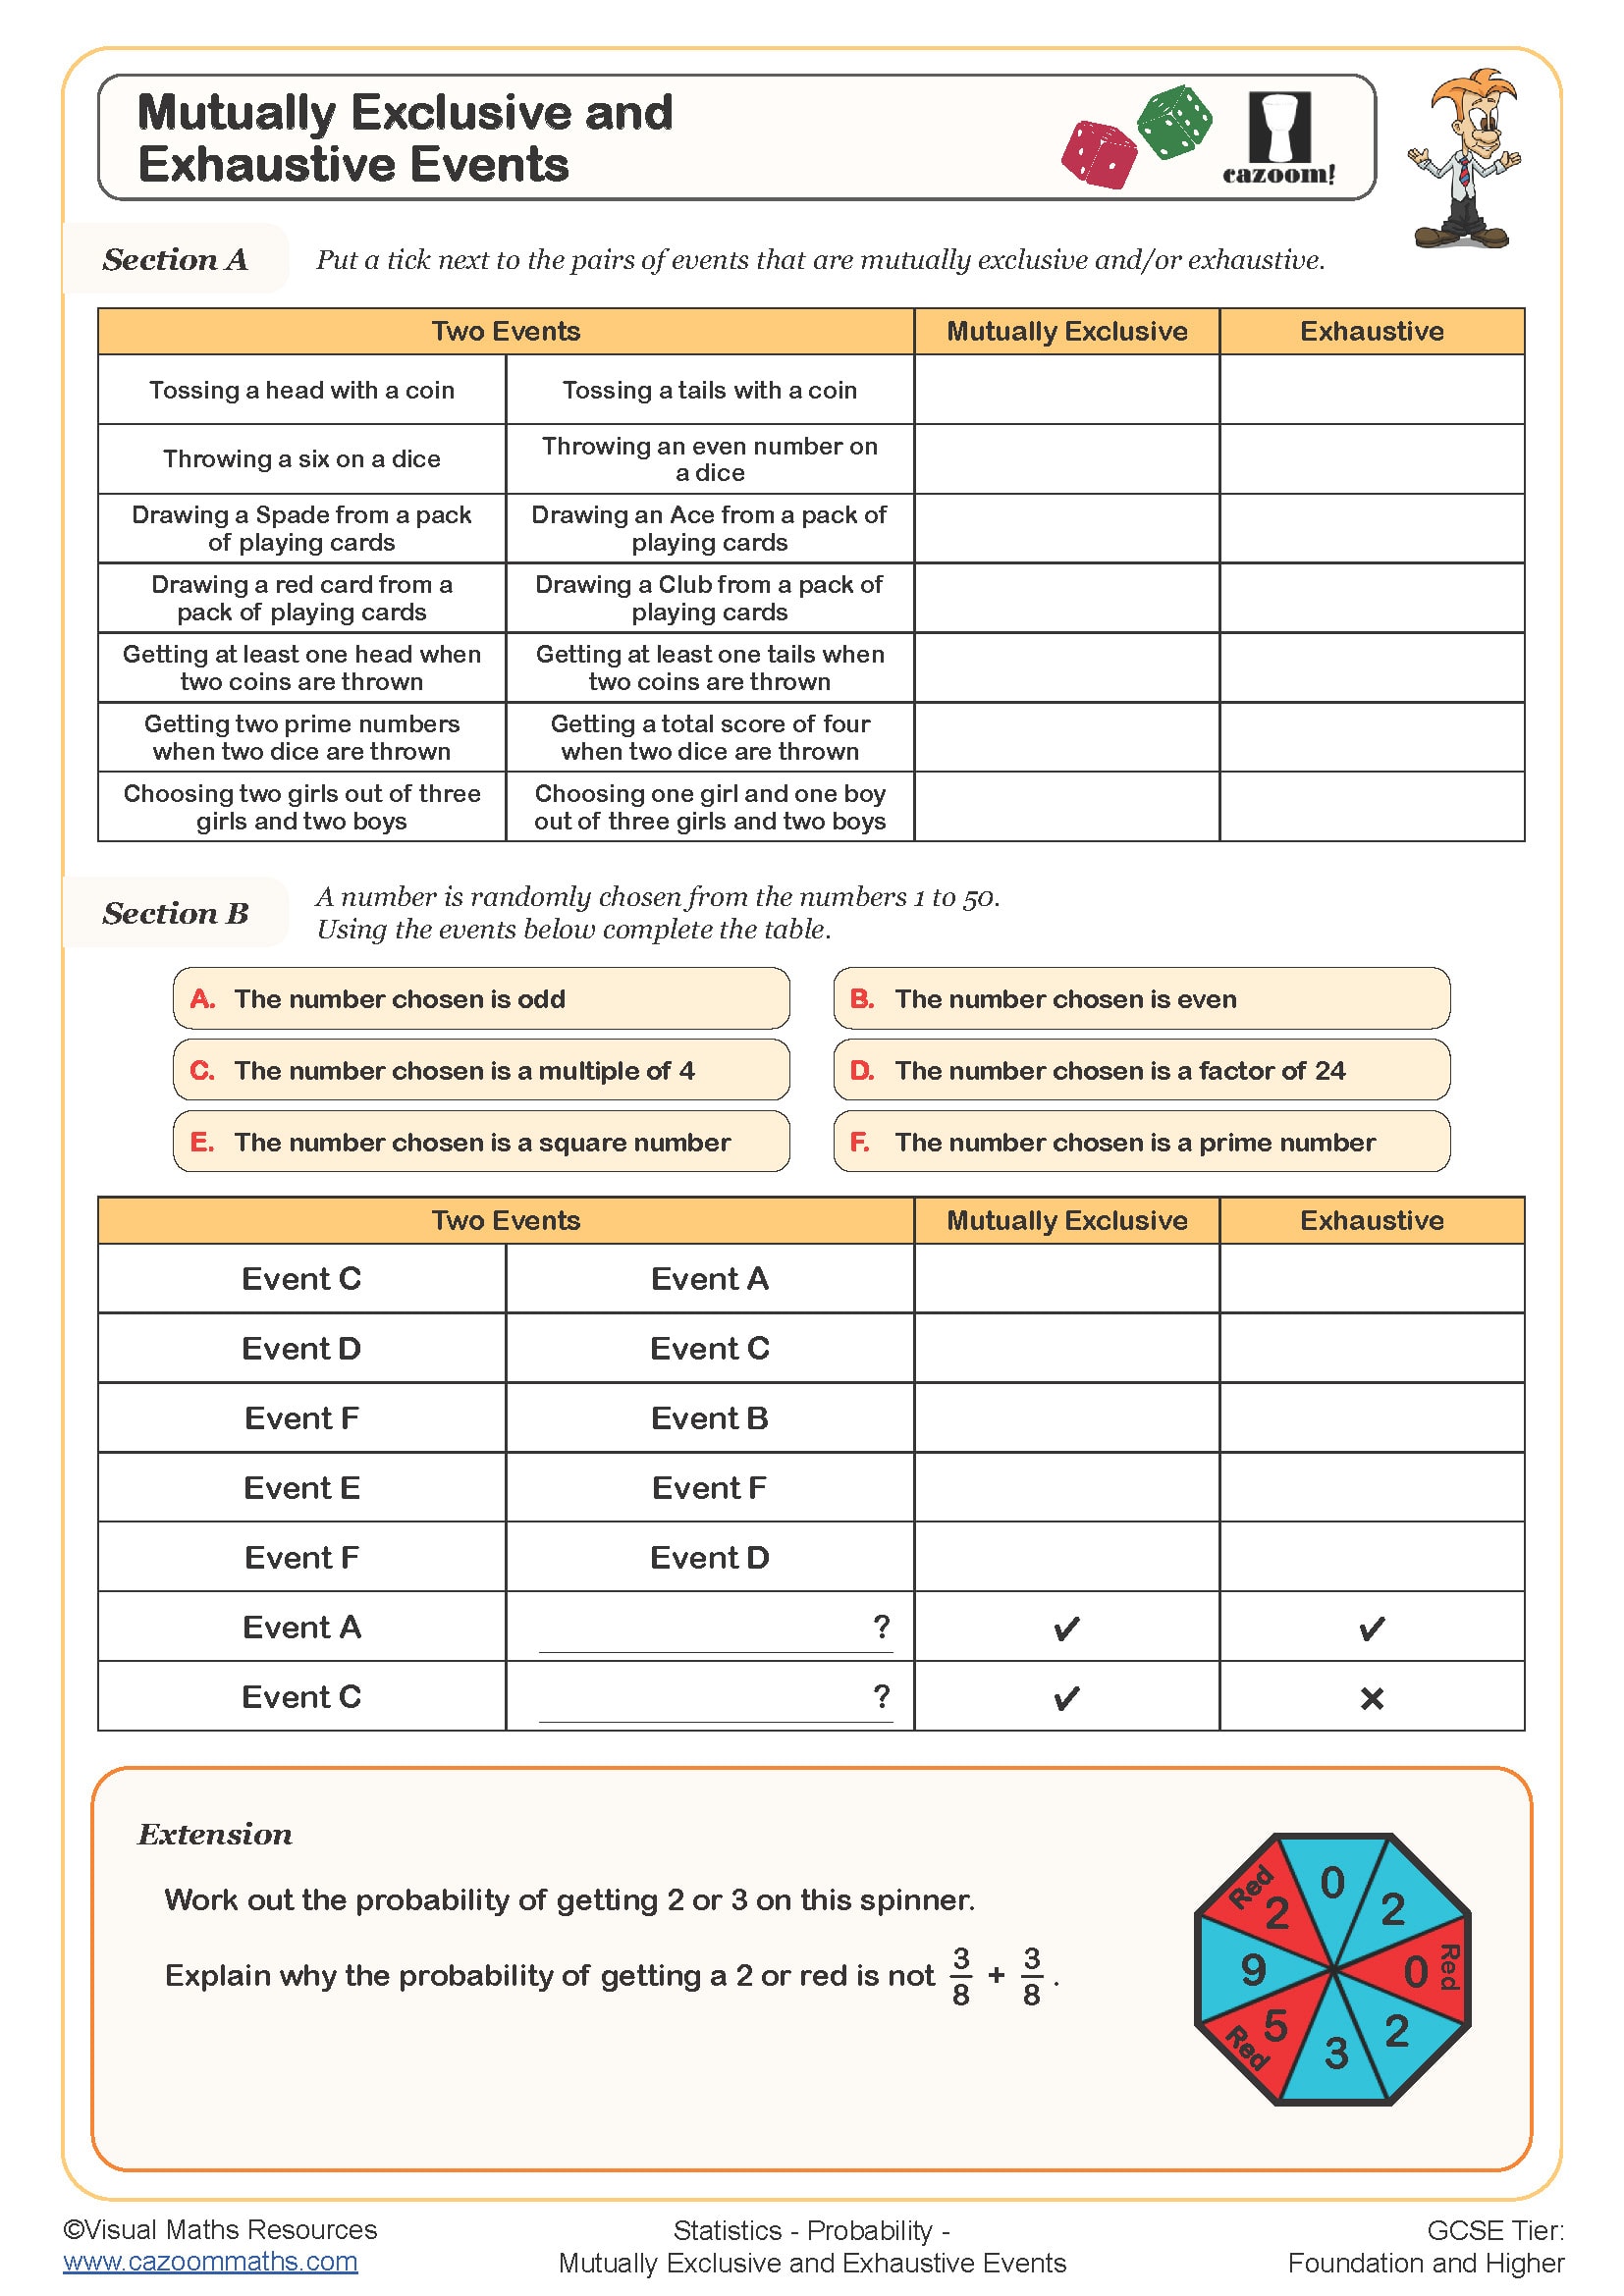
Mutually Exclusive and Exhaustive Events
Year groups: 9, 10, 11
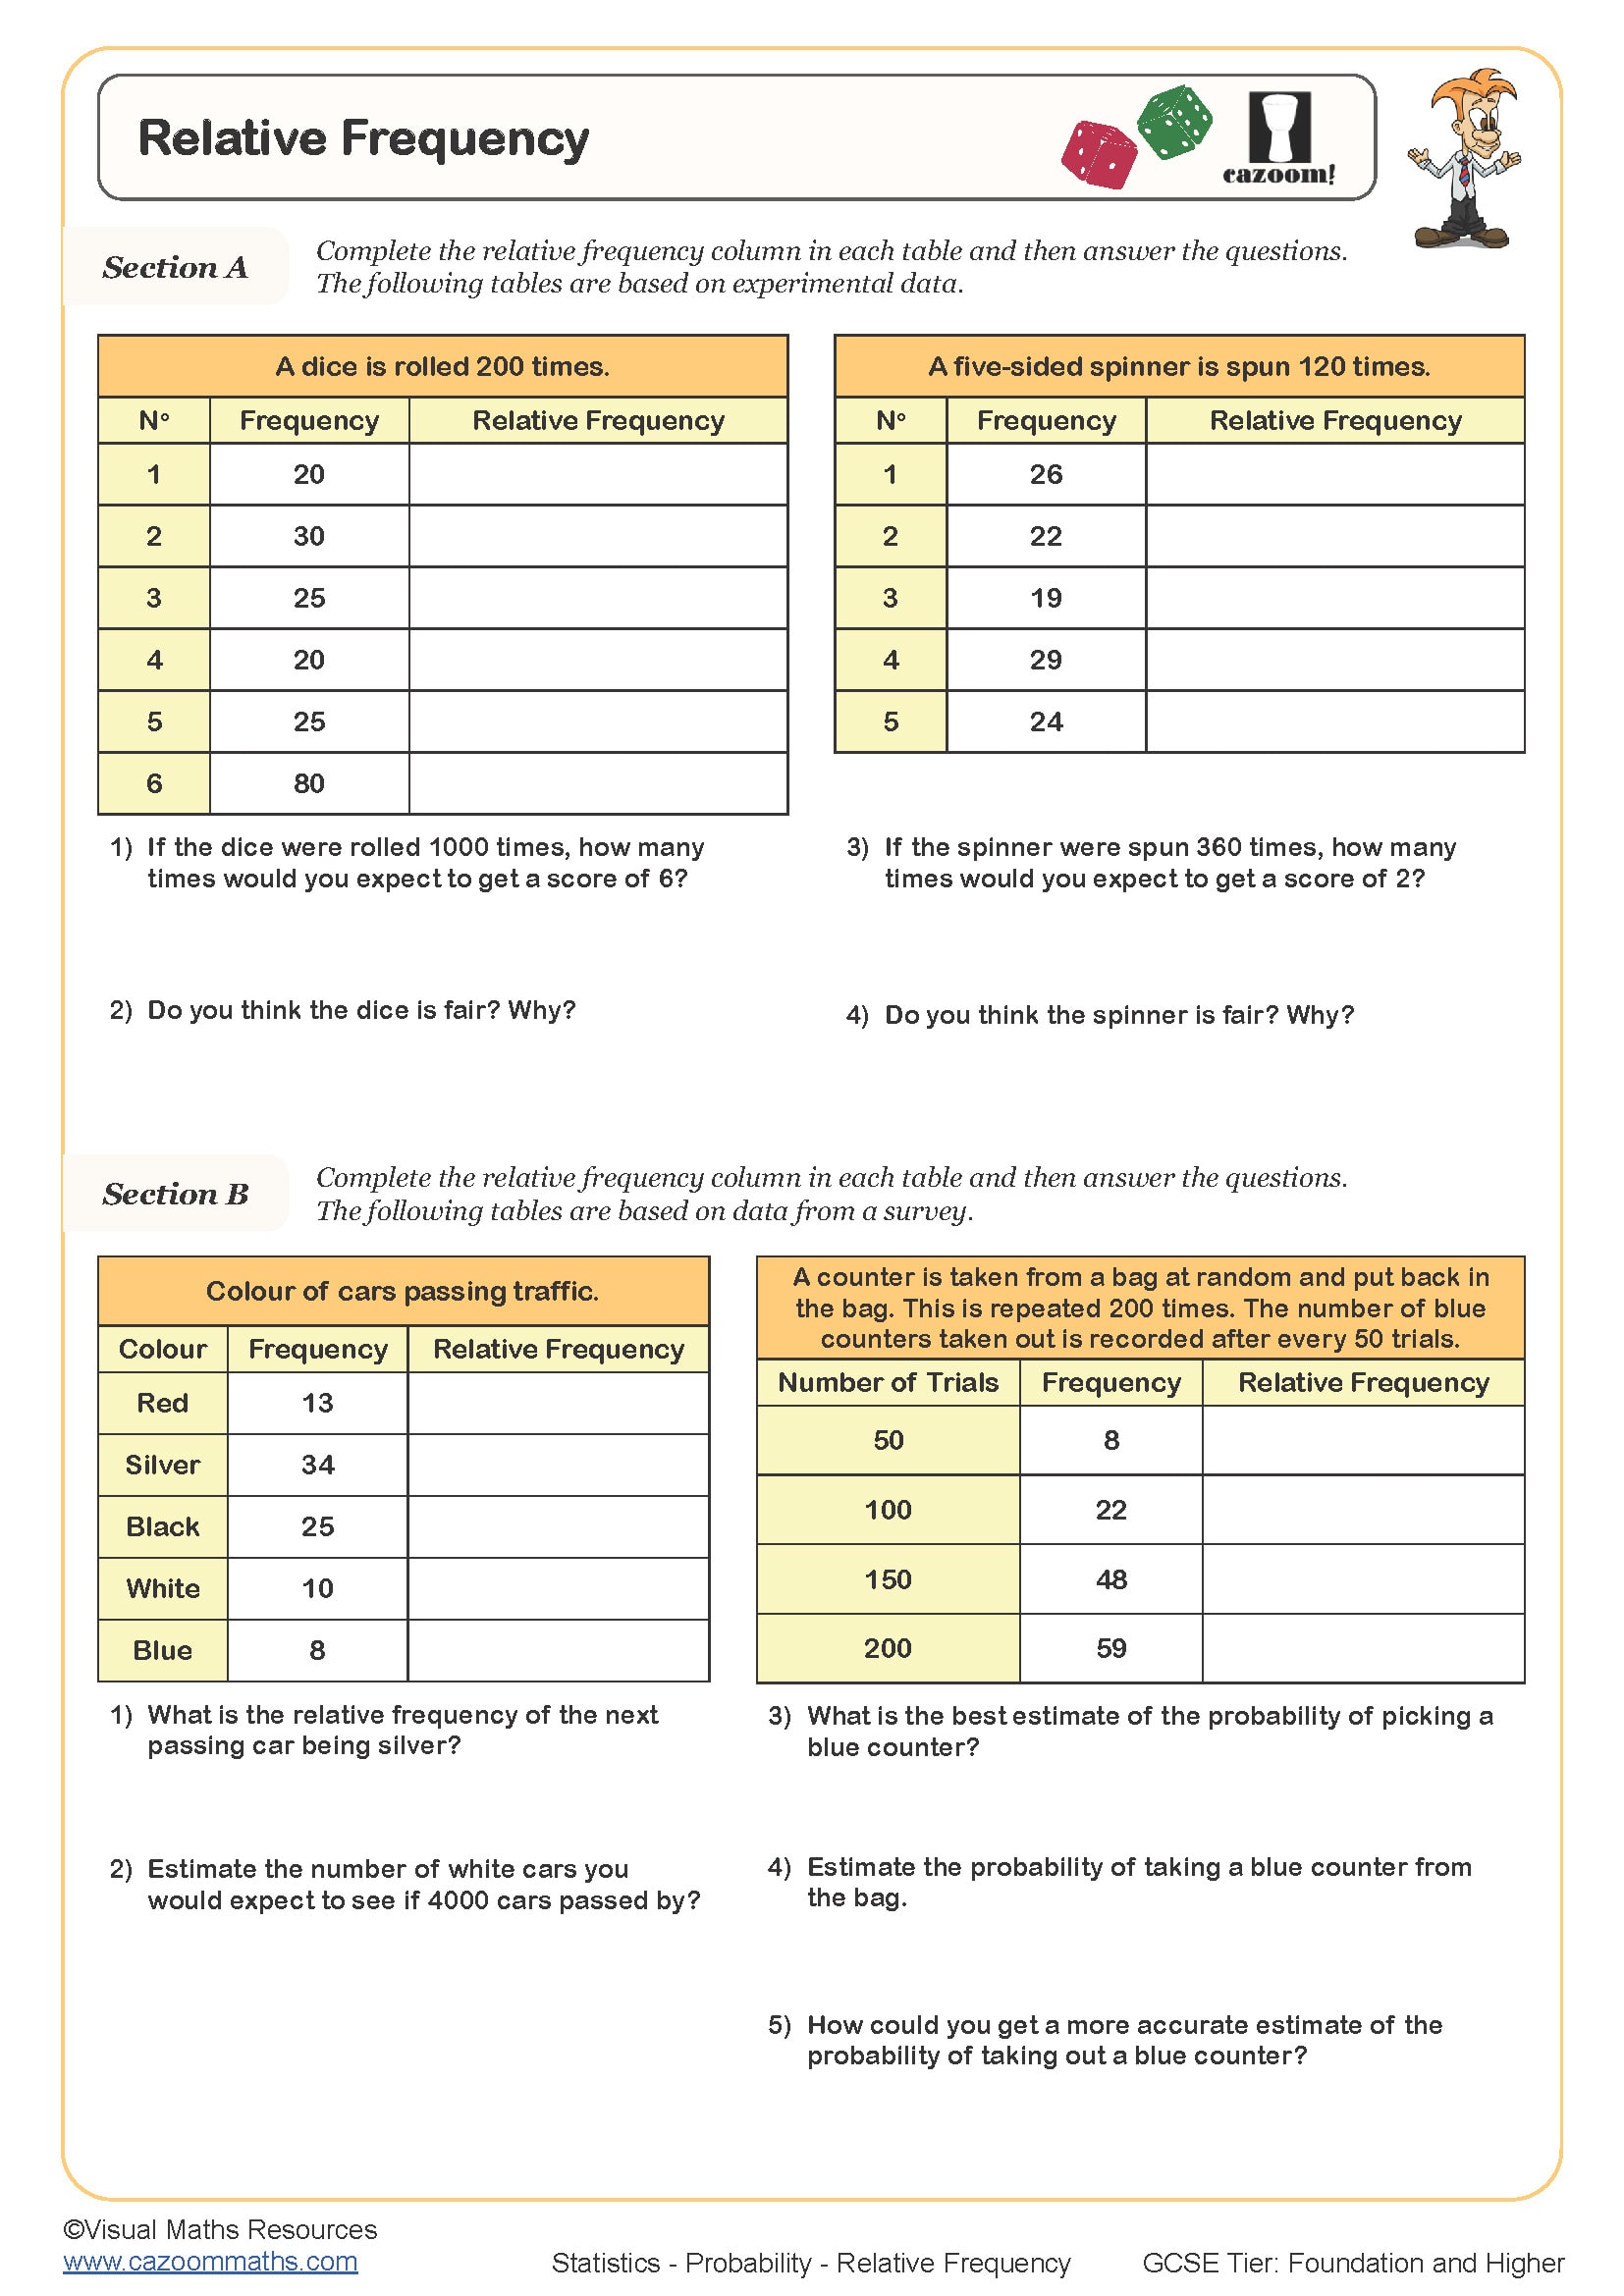
Relative Frequency
Year groups: 9, 10, 11
All worksheets are created by the team of experienced teachers at Cazoom Maths.
What is single event probability and how do you calculate it?
Single event probability measures the likelihood of one specific outcome occurring in a single trial or experiment. Students calculate this by dividing the number of favourable outcomes by the total number of possible outcomes, expressing their answer as a fraction, decimal, or percentage. The National Curriculum introduces this concept in KS3, with formal probability notation and calculations becoming central to GCSE assessment, particularly in the Foundation tier where probability questions typically account for 8-12 marks.
A common error occurs when students count outcomes incorrectly, especially with playing cards where they might forget there are 13 cards of each suit or four of each value. Teachers often observe students writing probabilities greater than 1 or less than 0, revealing fundamental misconceptions about what probability represents. Exam mark schemes regularly penalise students who fail to simplify fractions, so practice with reducing answers like 13/52 to 1/4 remains crucial throughout both key stages.
Which year groups study single event probability?
These worksheets cover single event probability for Year 7, Year 8, Year 9, Year 10, and Year 11, spanning both KS3 and KS4. The National Curriculum introduces basic probability in Year 7, where students work with simple experiments using coins, dice, and spinners, developing the fundamental formula and understanding the probability scale from 0 to 1. By Year 8, students encounter more complex scenarios involving playing cards, coloured counters, and biased events.
As students progress into KS4, the complexity increases significantly. Year 9 and Year 10 students tackle probability problems that require them to interpret real-world situations, work with non-uniform sample spaces, and connect probability to ratio and proportion. Year 11 revision focuses on exam technique, particularly identifying when events are equally likely versus when different outcomes have different probabilities. GCSE questions often embed probability within worded contexts, requiring students to extract information before calculating, which many teachers find their students initially struggle with.
How do you work with sample space diagrams for probability?
Sample space diagrams provide a systematic method for listing all possible outcomes when conducting probability experiments, particularly useful when dealing with two or more events simultaneously, though they're introduced here with single events to build foundational skills. Students create these diagrams as tables or grids, ensuring they've identified every possible outcome before calculating probabilities. This visual approach helps students who struggle with abstract probability concepts, as they can physically count outcomes rather than relying purely on calculation.
Sample space diagrams connect directly to quality control processes in manufacturing and STEM fields. Engineers use probability calculations to determine defect rates in production lines, where understanding single event probability helps predict how many items in a batch might fail quality testing. Weather forecasters apply similar principles when calculating the likelihood of specific weather events, using historical data to determine probabilities that inform public warnings and agricultural planning. These real-world applications demonstrate why accurate probability calculation matters beyond the classroom.
How can teachers use these probability worksheets effectively?
The worksheets build from straightforward calculations with fair dice and coins towards more challenging scenarios involving playing cards, biased spinners, and real-world contexts. This graduated difficulty allows teachers to target specific skill gaps, with answer sheets enabling students to self-check their working and identify where they've made errors. Many teachers use the earlier worksheets for whole-class teaching, working through examples together before moving to independent practice with the more complex sheets.
These resources work particularly well for intervention sessions with students who struggle to convert word problems into probability calculations, as the worksheets provide repeated exposure to common question types. During GCSE revision, teachers often use selected worksheets as starters or homework to maintain probability skills alongside other topics. The answer sheets also support paired work, where students can check each other's methods and explain their reasoning, helping to address misconceptions about what constitutes a favourable outcome or how to simplify fractional probabilities correctly.