Two Way Tables Worksheets
All worksheets are created by the team of experienced teachers at Cazoom Maths.
What are two way tables in maths?
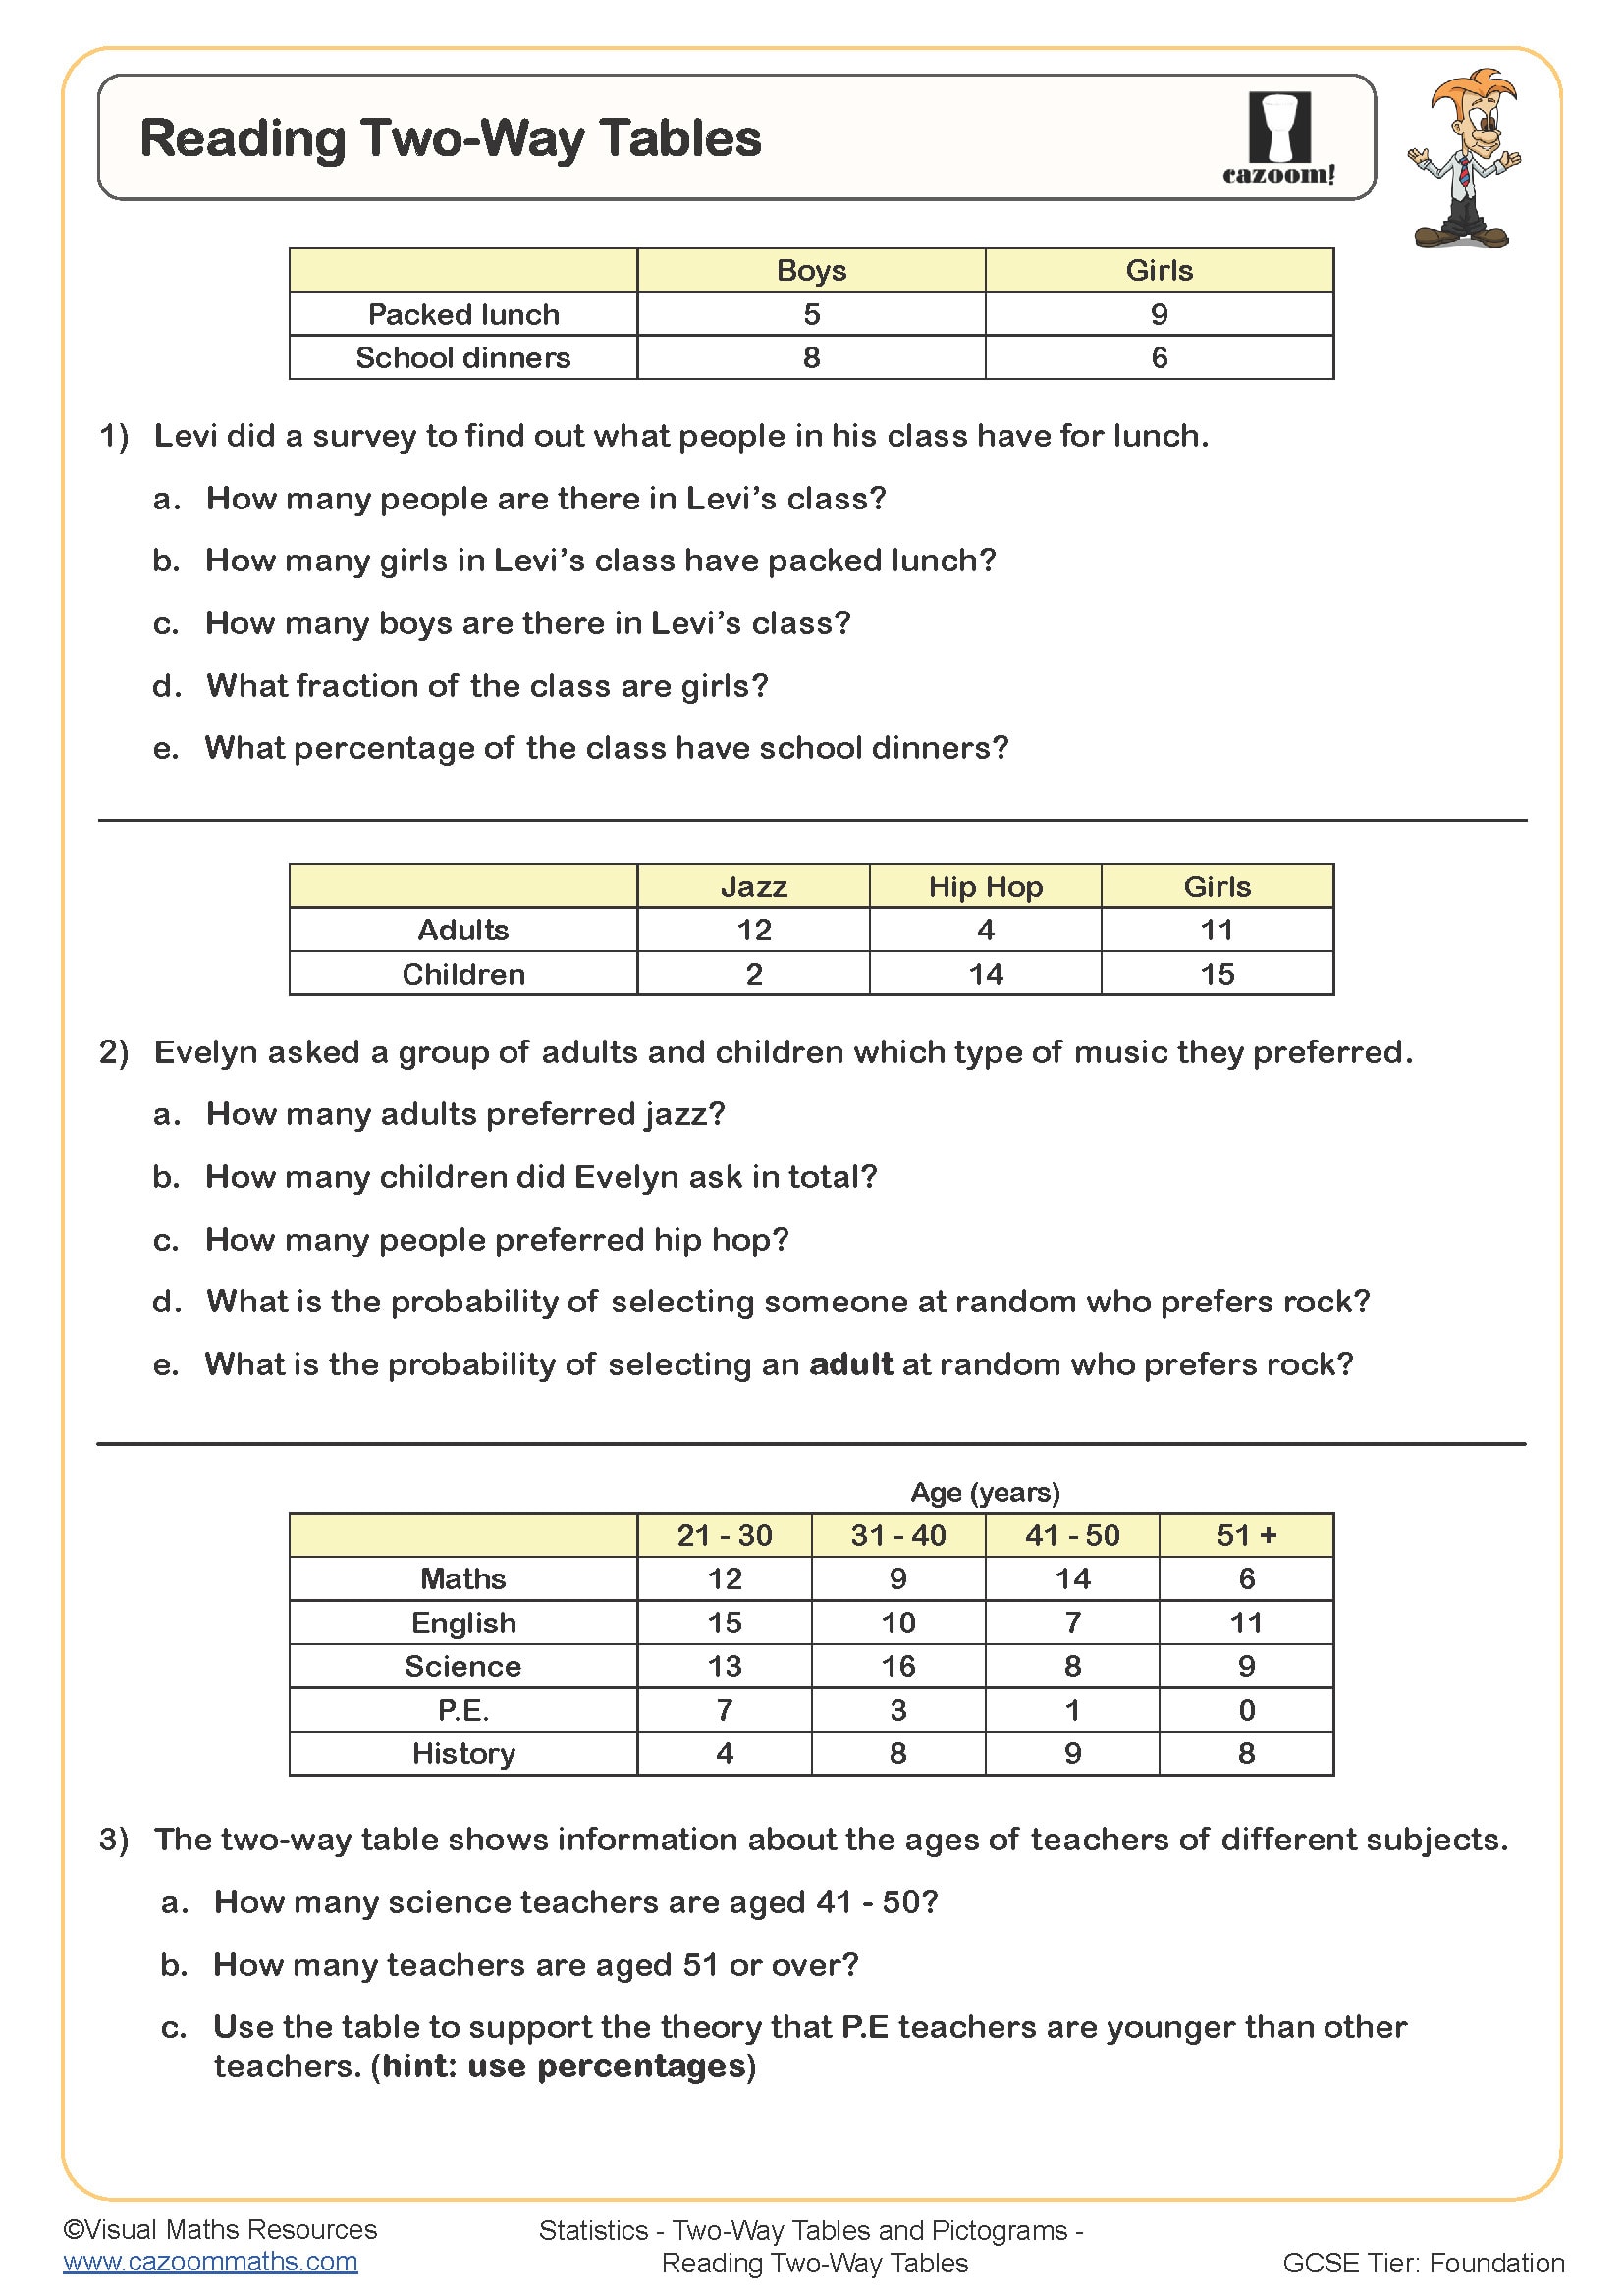
A two way table (also called a contingency table) displays the frequency of two categorical variables simultaneously, with one variable shown in rows and the other in columns. Students use these tables to organise survey data or experimental results, making it easier to spot patterns and relationships between the two variables. The intersection of each row and column shows how many data items share both characteristics.
A common error occurs when students confuse the totals row and column with data categories. For example, in a table showing eye colour versus hair colour, students sometimes try to add the 'Total' row as if it were another category like 'Brown' or 'Blue'. Exam mark schemes penalise this heavily, particularly when students then use incorrect totals in probability calculations. Understanding that totals are summaries, not additional data points, is fundamental to working accurately with two way tables.
Which year groups study two way tables?
These worksheets cover two way tables for Year 8 and Year 9 students at KS3. The topic appears in the National Curriculum under statistics, where students must collect, organise and interpret data. At this level, students move beyond simple tally charts to handle more complex datasets involving two variables simultaneously, preparing them for GCSE statistics requirements.
Progression across these year groups focuses on increasing complexity of the data and questions asked. Year 8 work typically involves completing tables with given totals and extracting straightforward information. By Year 9, students encounter tables with missing values that require algebraic thinking to solve, and questions that combine two way tables with probability calculations or percentage comparisons. This builds the analytical skills needed for GCSE Foundation and Higher tier statistics questions.
How do you find missing values in two way tables?
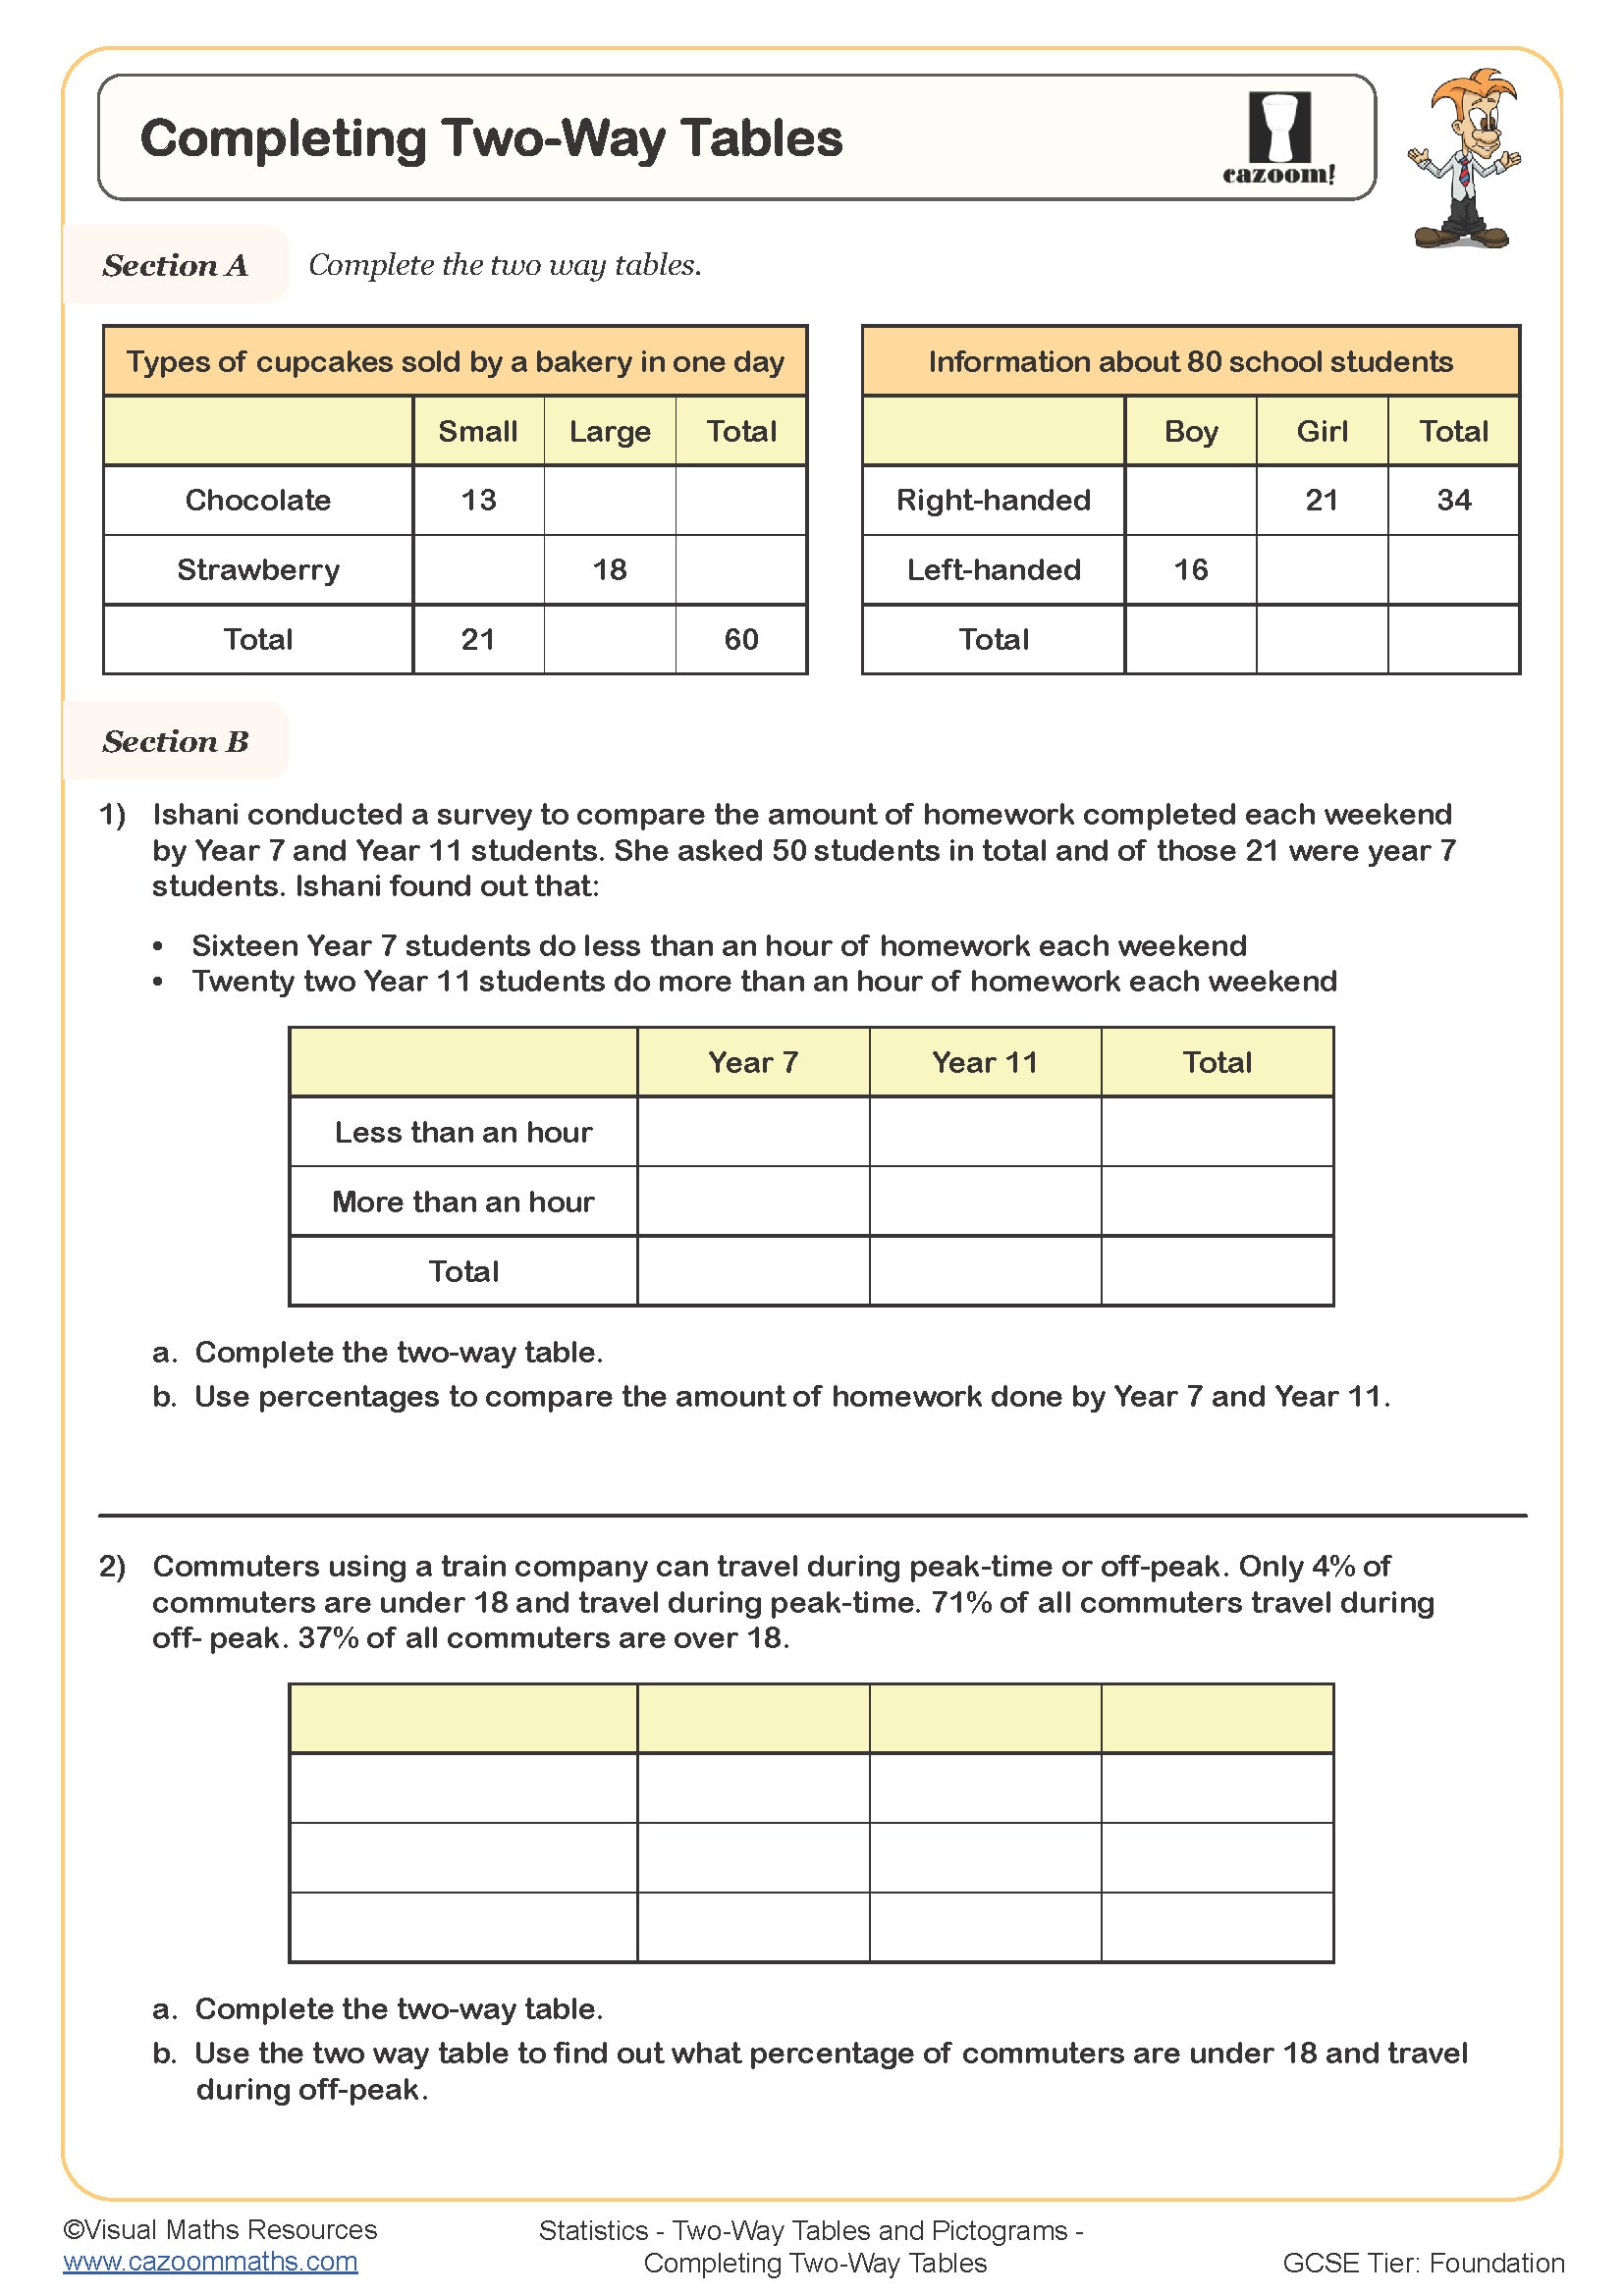
Finding missing values requires students to use the fact that each row total equals the sum of its cells, and each column total equals the sum of its cells. Students work systematically, identifying rows or columns where only one value is missing, then using subtraction from the total. This process often needs repeating several times as each discovered value unlocks others, requiring logical thinking and careful organisation.
This skill connects directly to data analysis in scientific research and market research. Scientists use two way tables when analysing clinical trial results (comparing treatment groups against outcomes) or ecological surveys (species counts across different habitats). Market researchers analyse consumer preferences by age group or region using exactly these techniques. Students who master finding missing values develop problem-solving approaches applicable across STEM fields, where incomplete datasets require logical deduction to fill gaps before analysis can proceed.
How can teachers use these two way tables worksheets effectively?
The worksheets build confidence through carefully structured questions that progress from reading completed tables to filling in missing values and interpreting results. Complete answer sheets allow students to self-check their work, identifying calculation errors before they become embedded misconceptions. Teachers report this immediate feedback particularly valuable for statistics, where one wrong cell value affects every subsequent calculation.
Many teachers use these resources for targeted intervention with students who struggle to organise data systematically. The worksheets work well in paired activities where students explain their reasoning to partners, verbalising which total they're using and why. They're equally effective as homework following initial teaching, or as revision before assessments. For mixed-ability classes, teachers often differentiate by assigning different worksheets or setting time challenges for more confident students, whilst providing additional support frames for those who need prompting about which operation to use.