Year 10 Proportion Worksheets
All worksheets are created by the team of experienced teachers at Cazoom Maths.
What makes an effective direct proportion graphs worksheet?
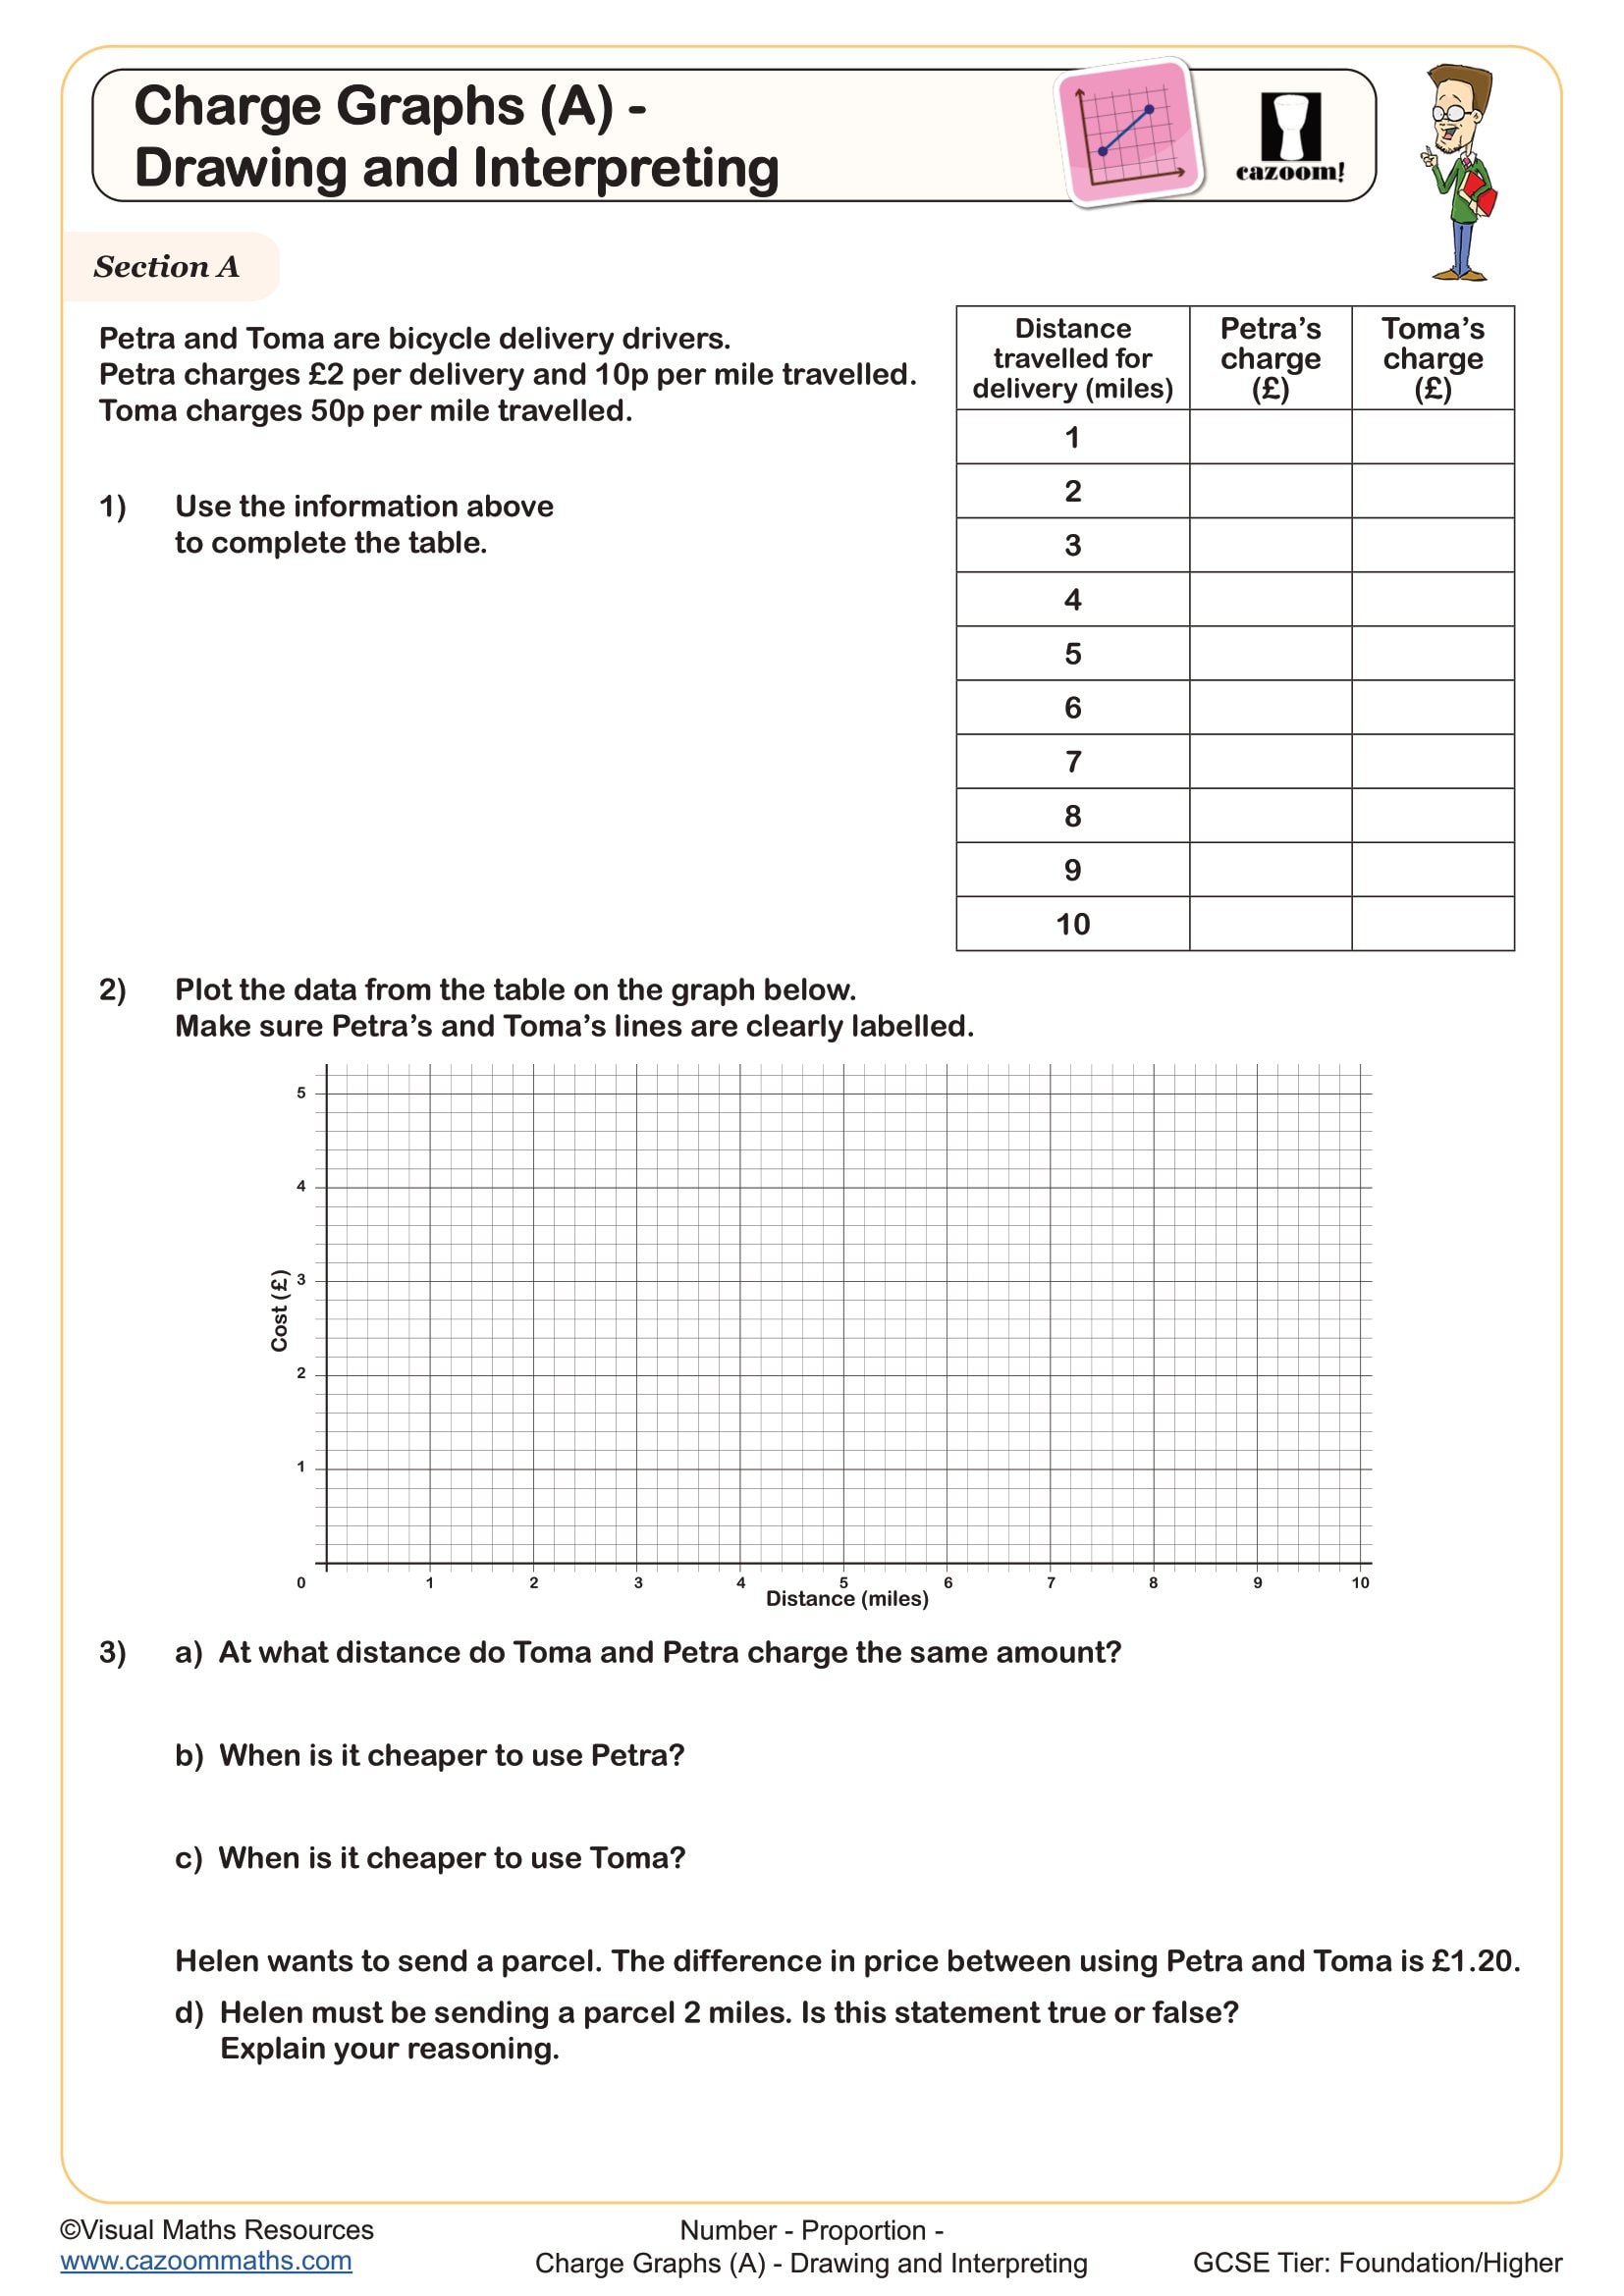
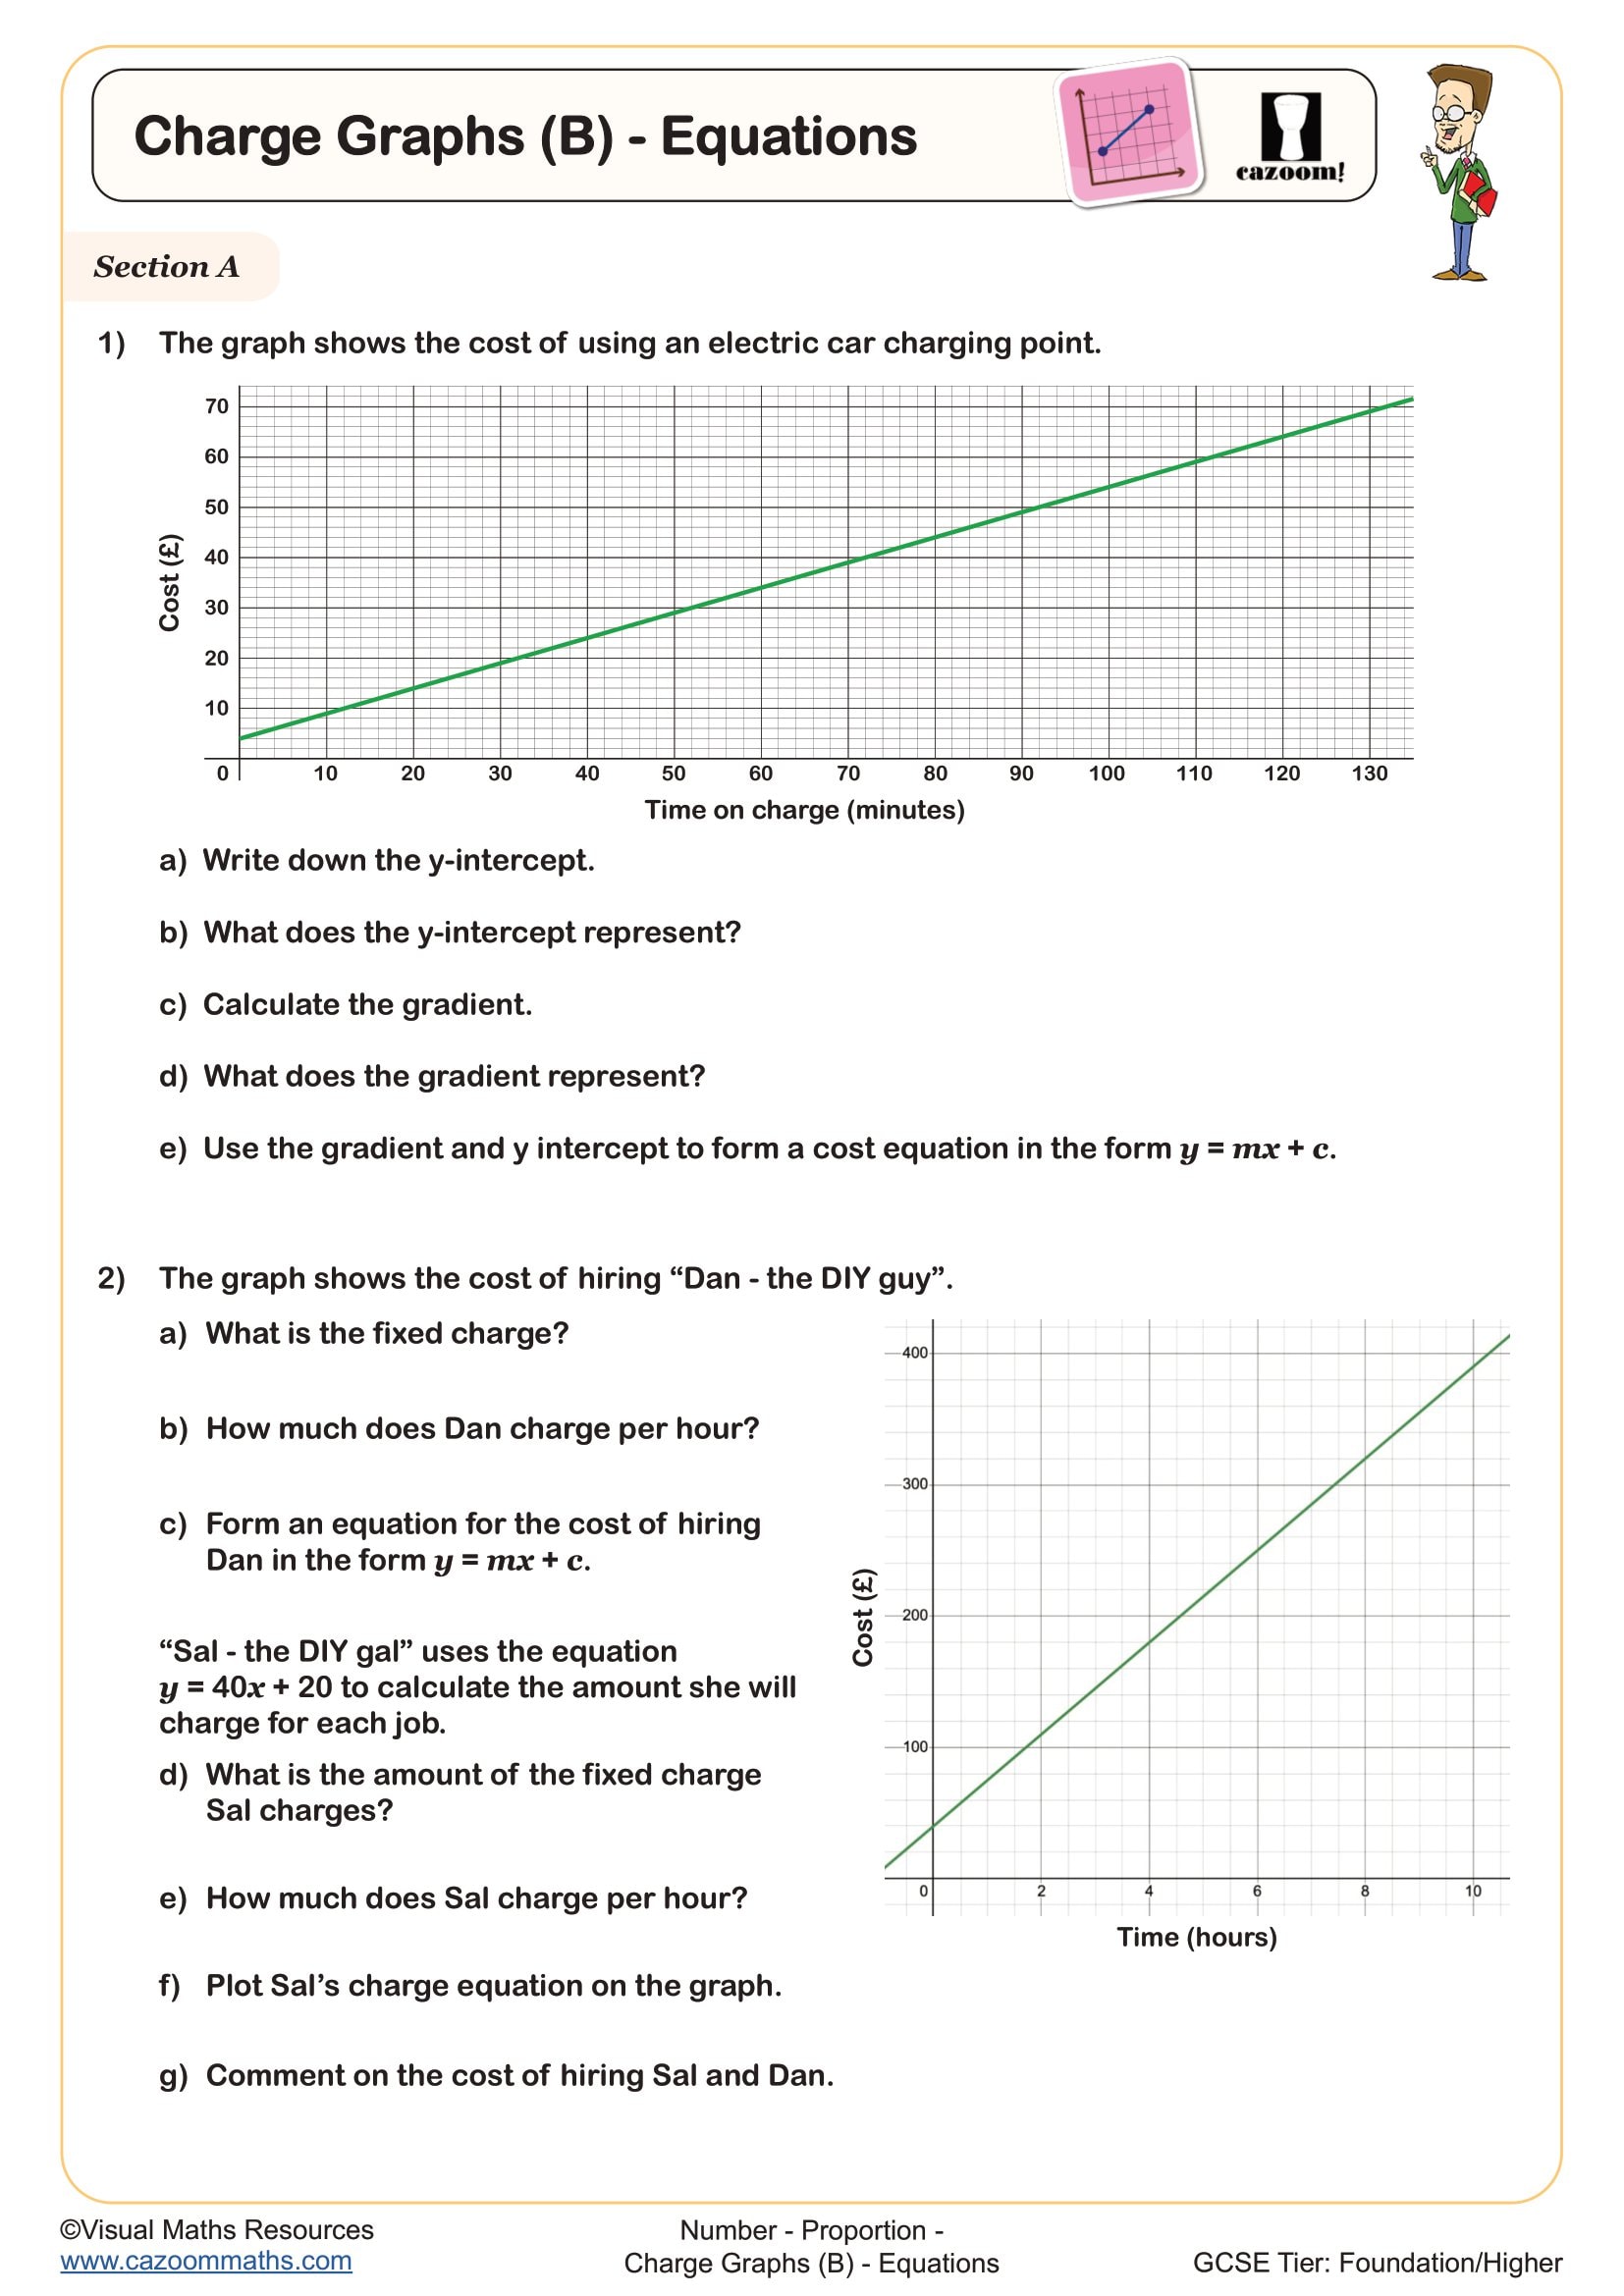
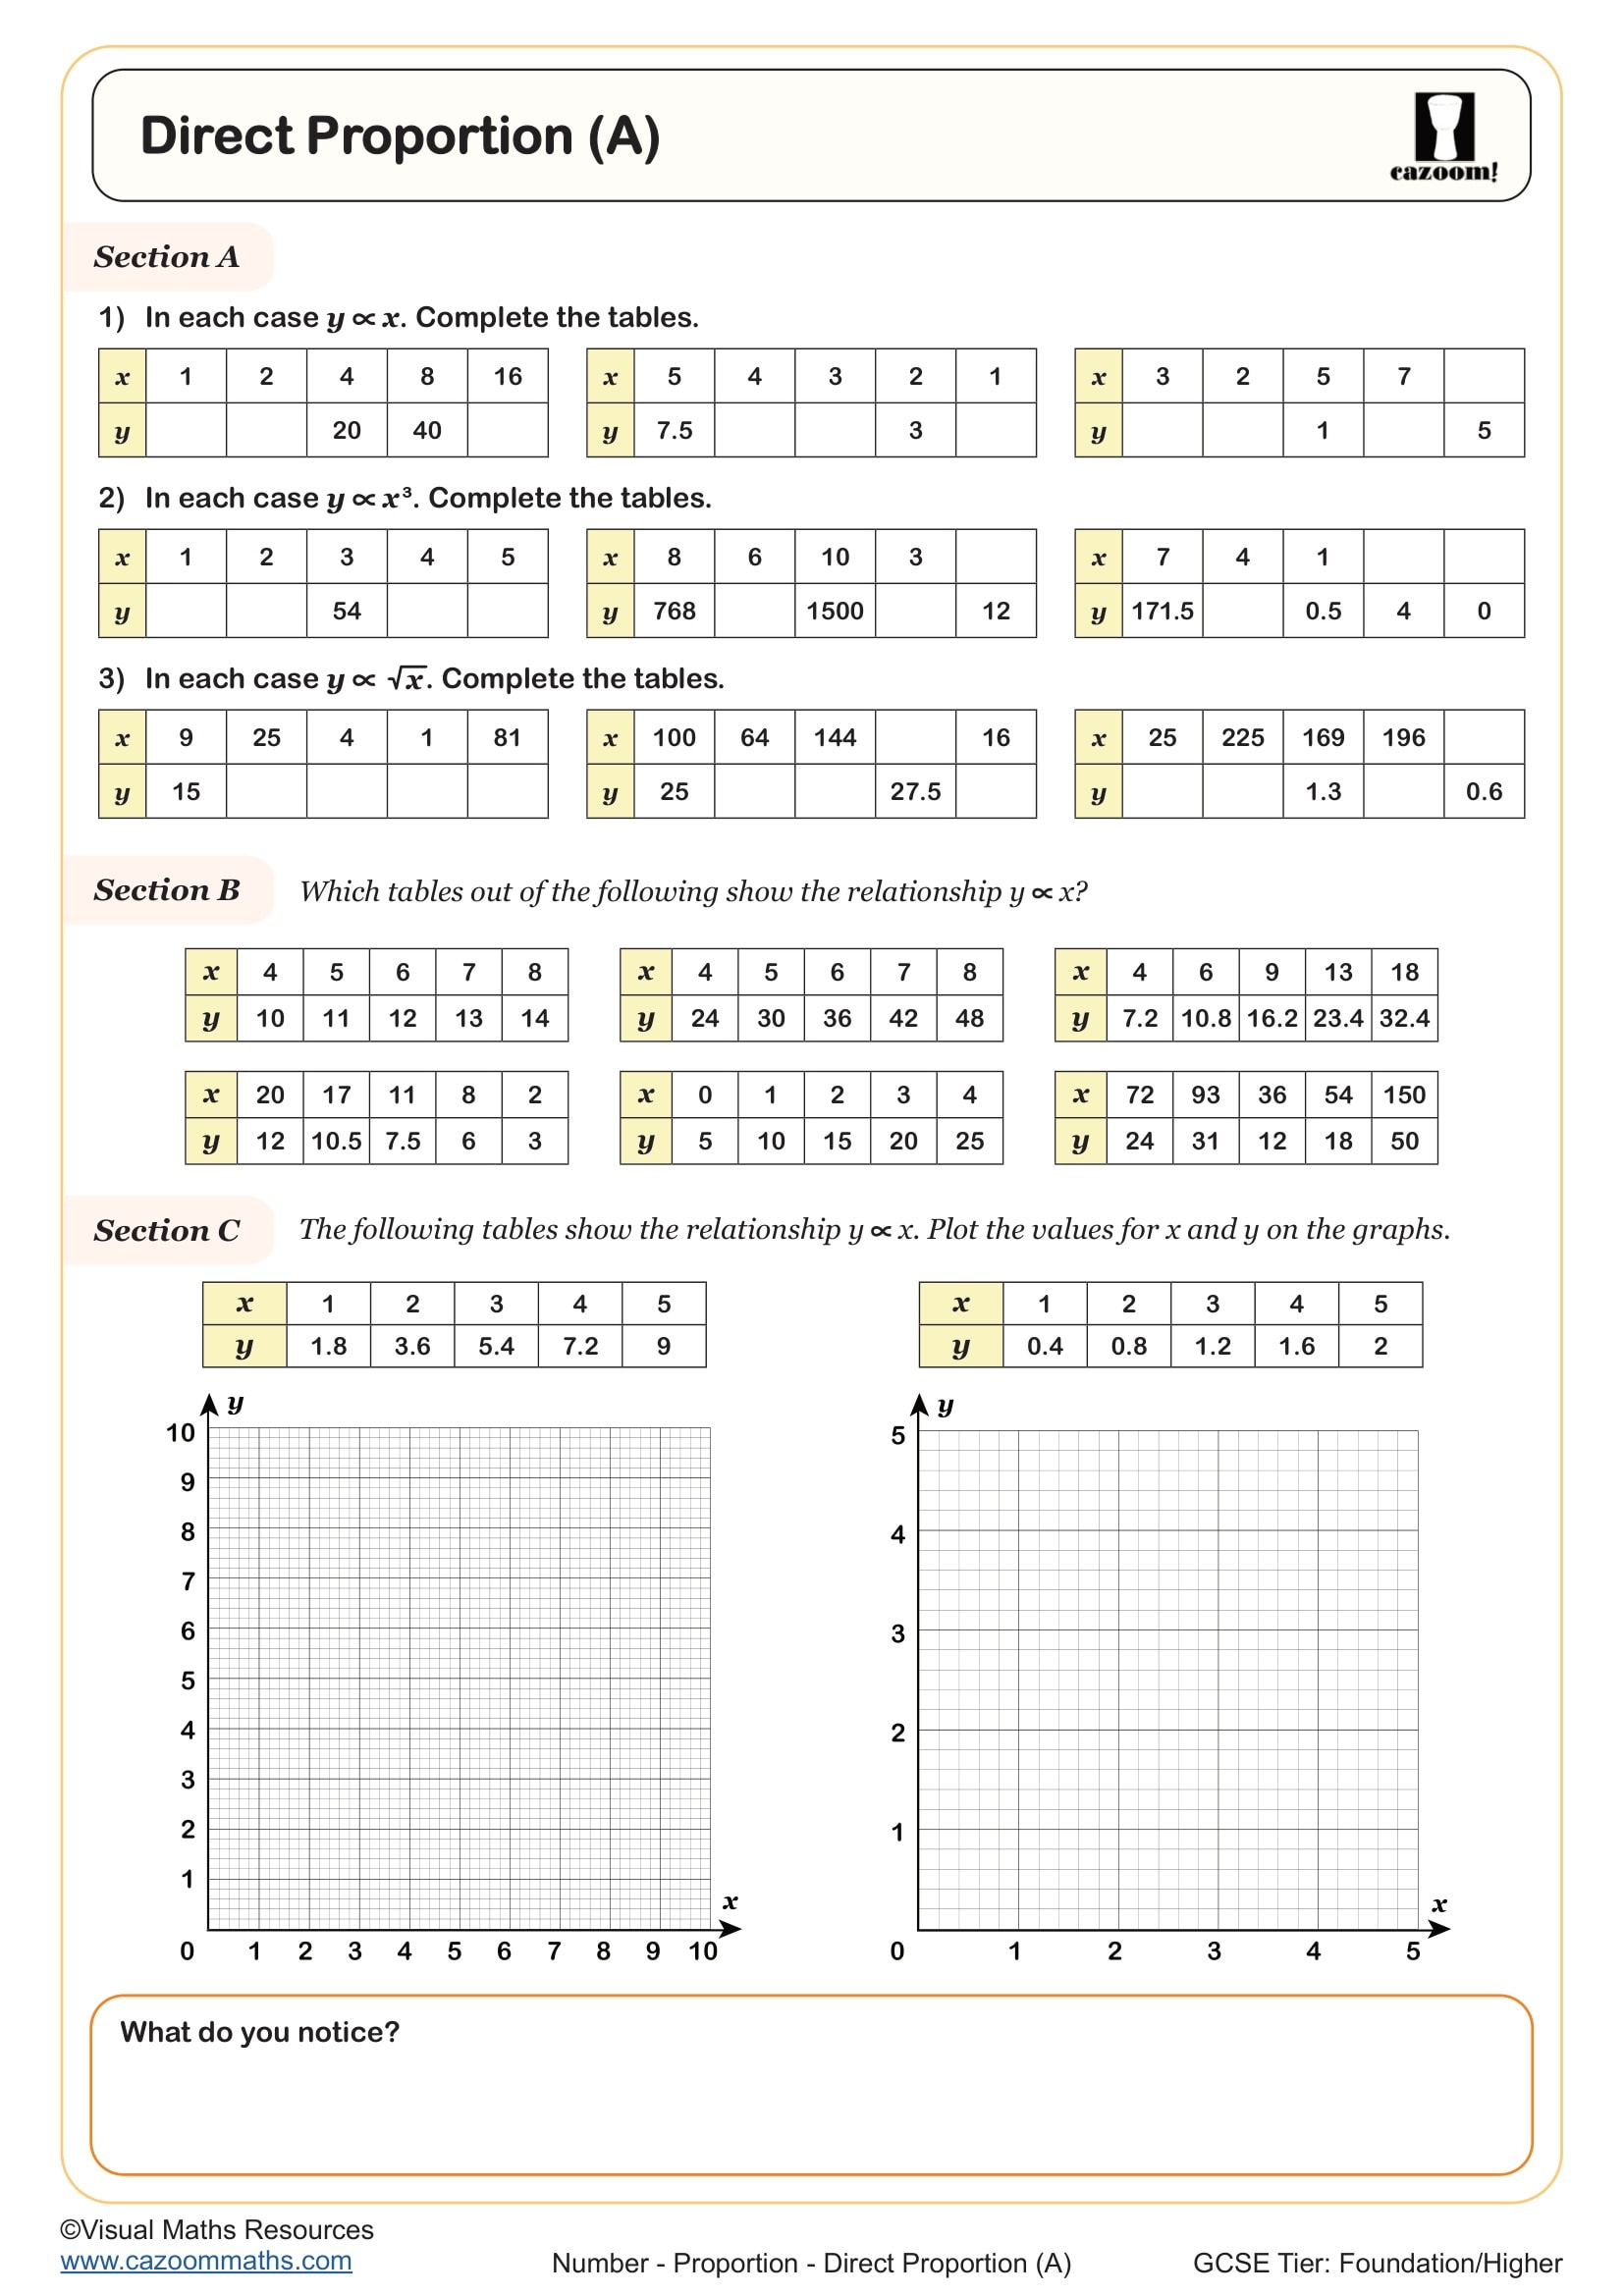
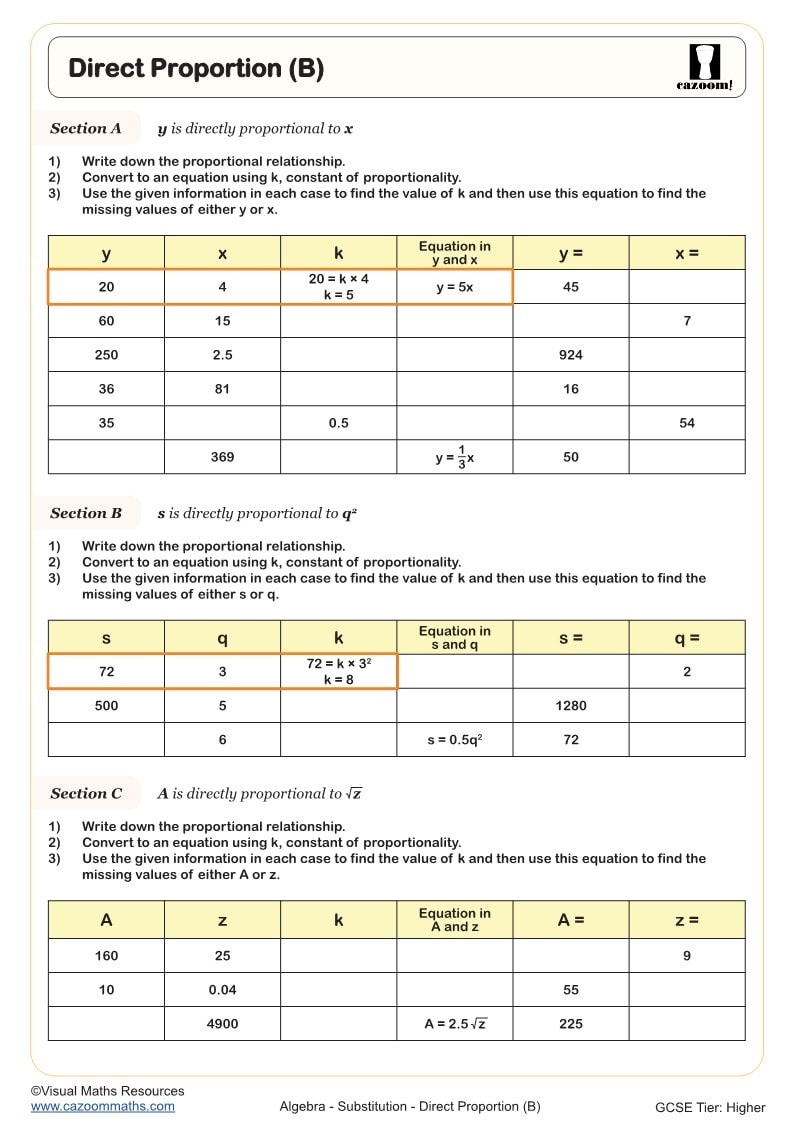
An effective direct proportion graphs worksheet combines coordinate plotting with algebraic interpretation, helping students recognise that direct proportion graphs always pass through the origin with equation y = kx. The best worksheets include varied contexts such as currency conversion, recipe scaling, and distance-speed relationships that demonstrate proportional thinking across GCSE mathematics.
Maths teachers notice students frequently plot points correctly but fail to verify whether relationships are truly proportional. Quality worksheets address this by asking students to calculate ratios between coordinates and identify the constant of proportionality, reinforcing the connection between graphical and algebraic representations.
Which year groups benefit most from proportional graphs worksheets?
Proportional graphs worksheets work effectively across Years 9 and 10, though teachers typically introduce basic concepts during Year 9 before developing sophistication in Year 10. The topic appears in GCSE Foundation and Higher tier examinations, making thorough understanding targeted for all students regardless of target grade.
Year 9 students focus on recognising proportional relationships and plotting basic graphs, while Year 10 students tackle inverse proportion, combined with direct proportion problems, and application to complex real-world scenarios. Teachers find that students who master proportion graphs in Year 9 show stronger algebraic reasoning skills when approaching quadratic and exponential graphs later.
How do proportion graphs connect to other GCSE topics?
Proportion graphs provide foundational understanding for gradients, equation of straight lines, and similarity in geometry. Students who grasp that direct proportion creates straight lines through the origin find y = mx + c much more accessible, as they already understand how gradients relate to rates of change.
Teachers observe strong connections between proportion work and similar triangles, where students apply proportional reasoning to calculate missing lengths. The graphical approach particularly helps visual learners understand why scale factors remain constant across similar shapes, creating bridges between algebra and geometry that strengthen overall mathematical understanding.
How should teachers use proportion graphs worksheets in lessons?
Teachers achieve best results when combining proportion graphs worksheets with practical demonstrations using real data, such as plotting conversion rates or analysing linear relationships from science experiments. Starting lessons with physical activities like measuring shadows at different times helps students visualise proportional relationships before moving to abstract graphs.
Structured worksheet progression works effectively, beginning with simple integer coordinates before introducing decimal and fractional values. Teachers find that providing answer sheets enables students to self-assess their plotting accuracy, while peer discussion about different approaches to finding constants of proportionality deepens understanding and builds confidence.