Year 9 Proportion Worksheets
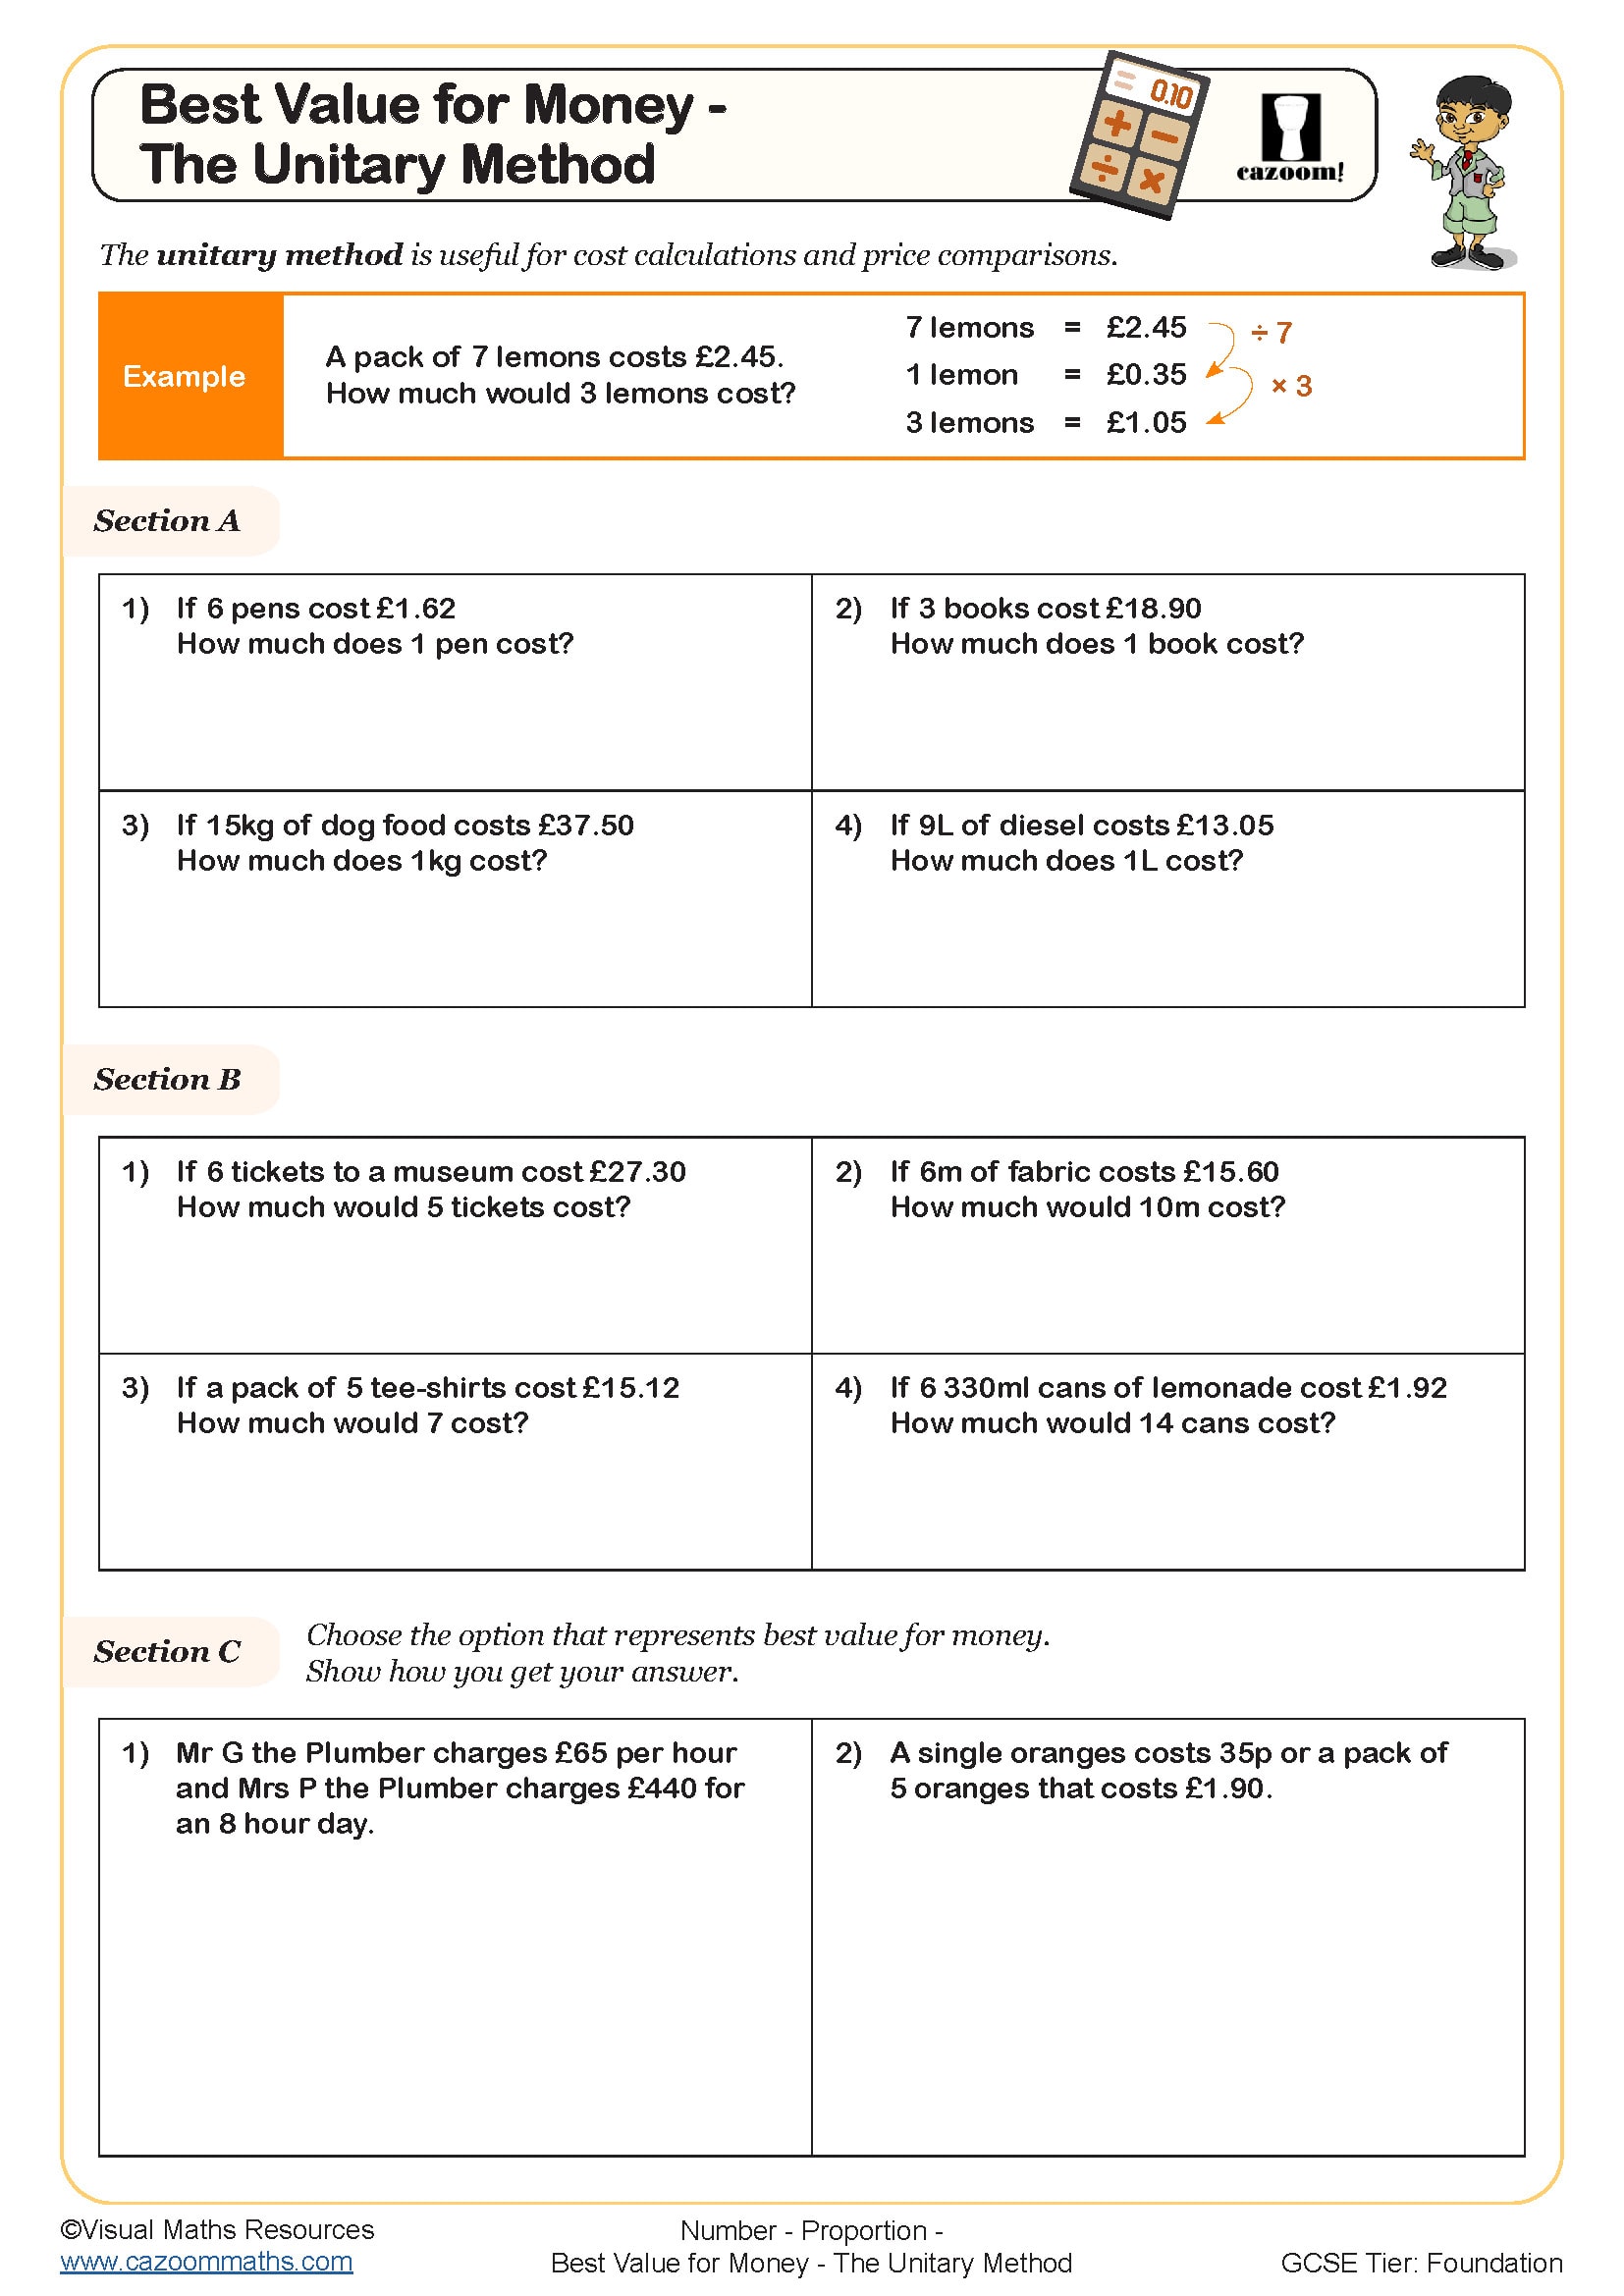
Best Value for Money - the Unitary Method
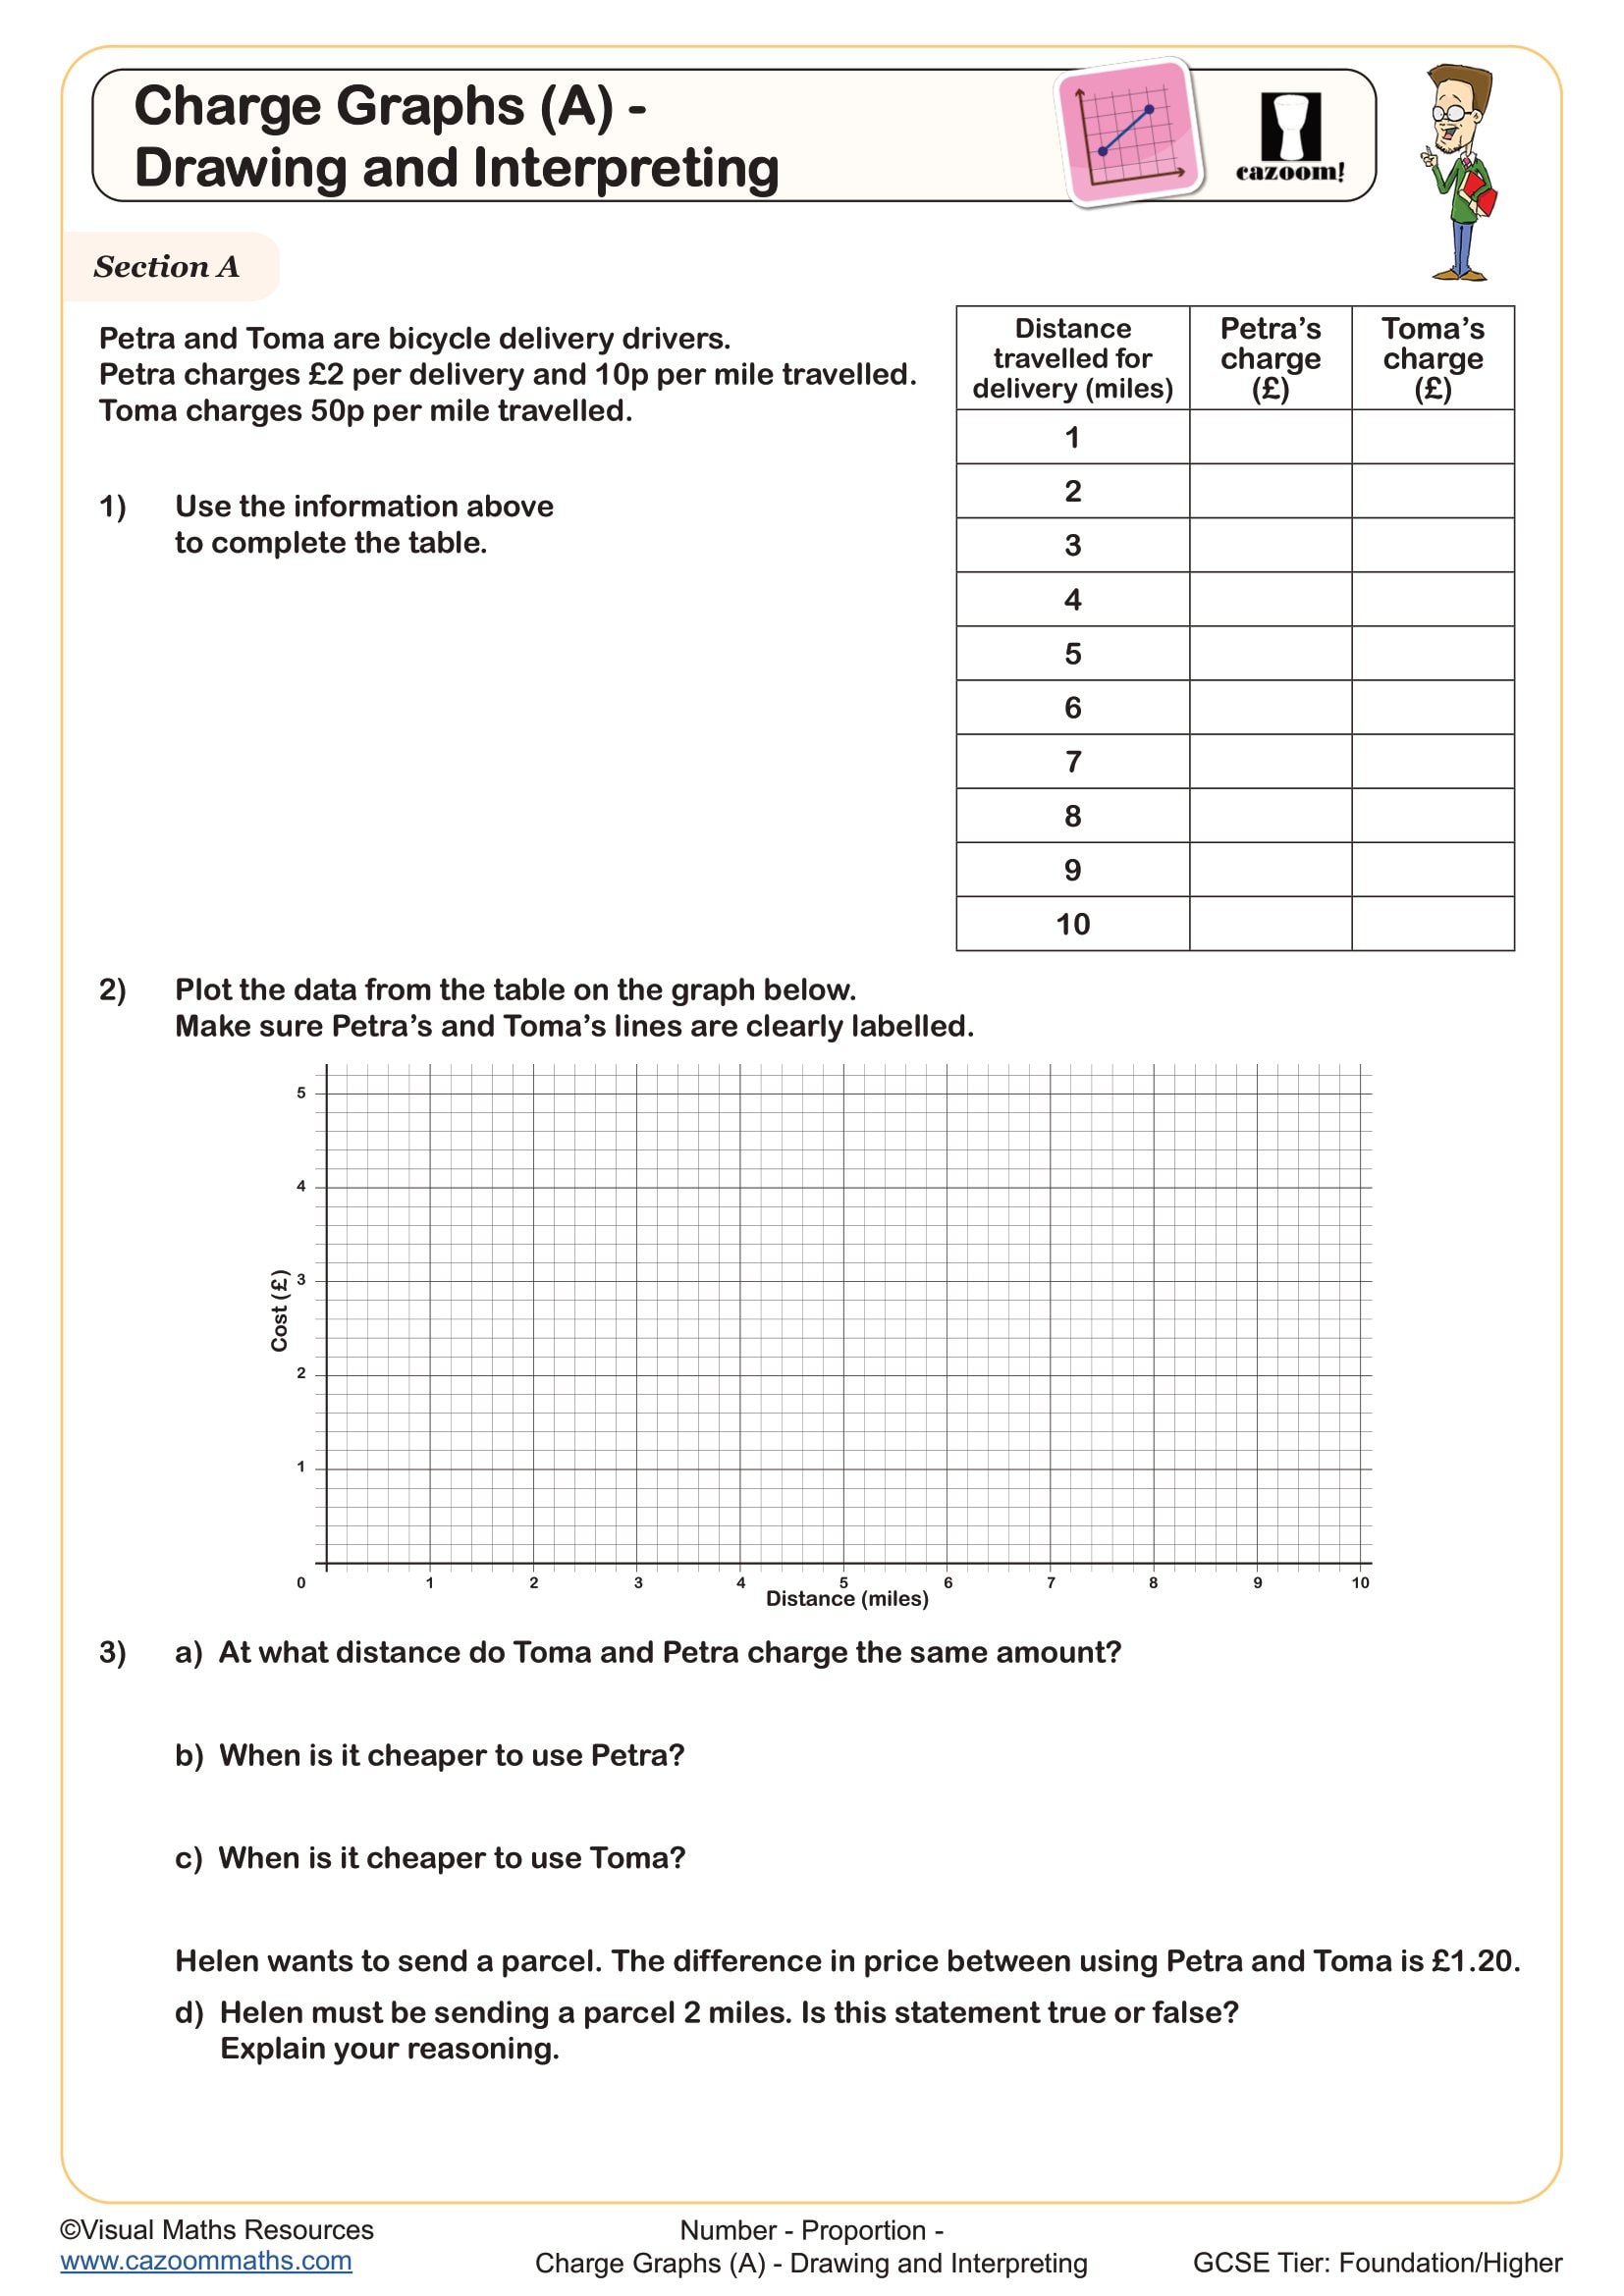
Charge Graphs (A) - Drawing and Interpreting
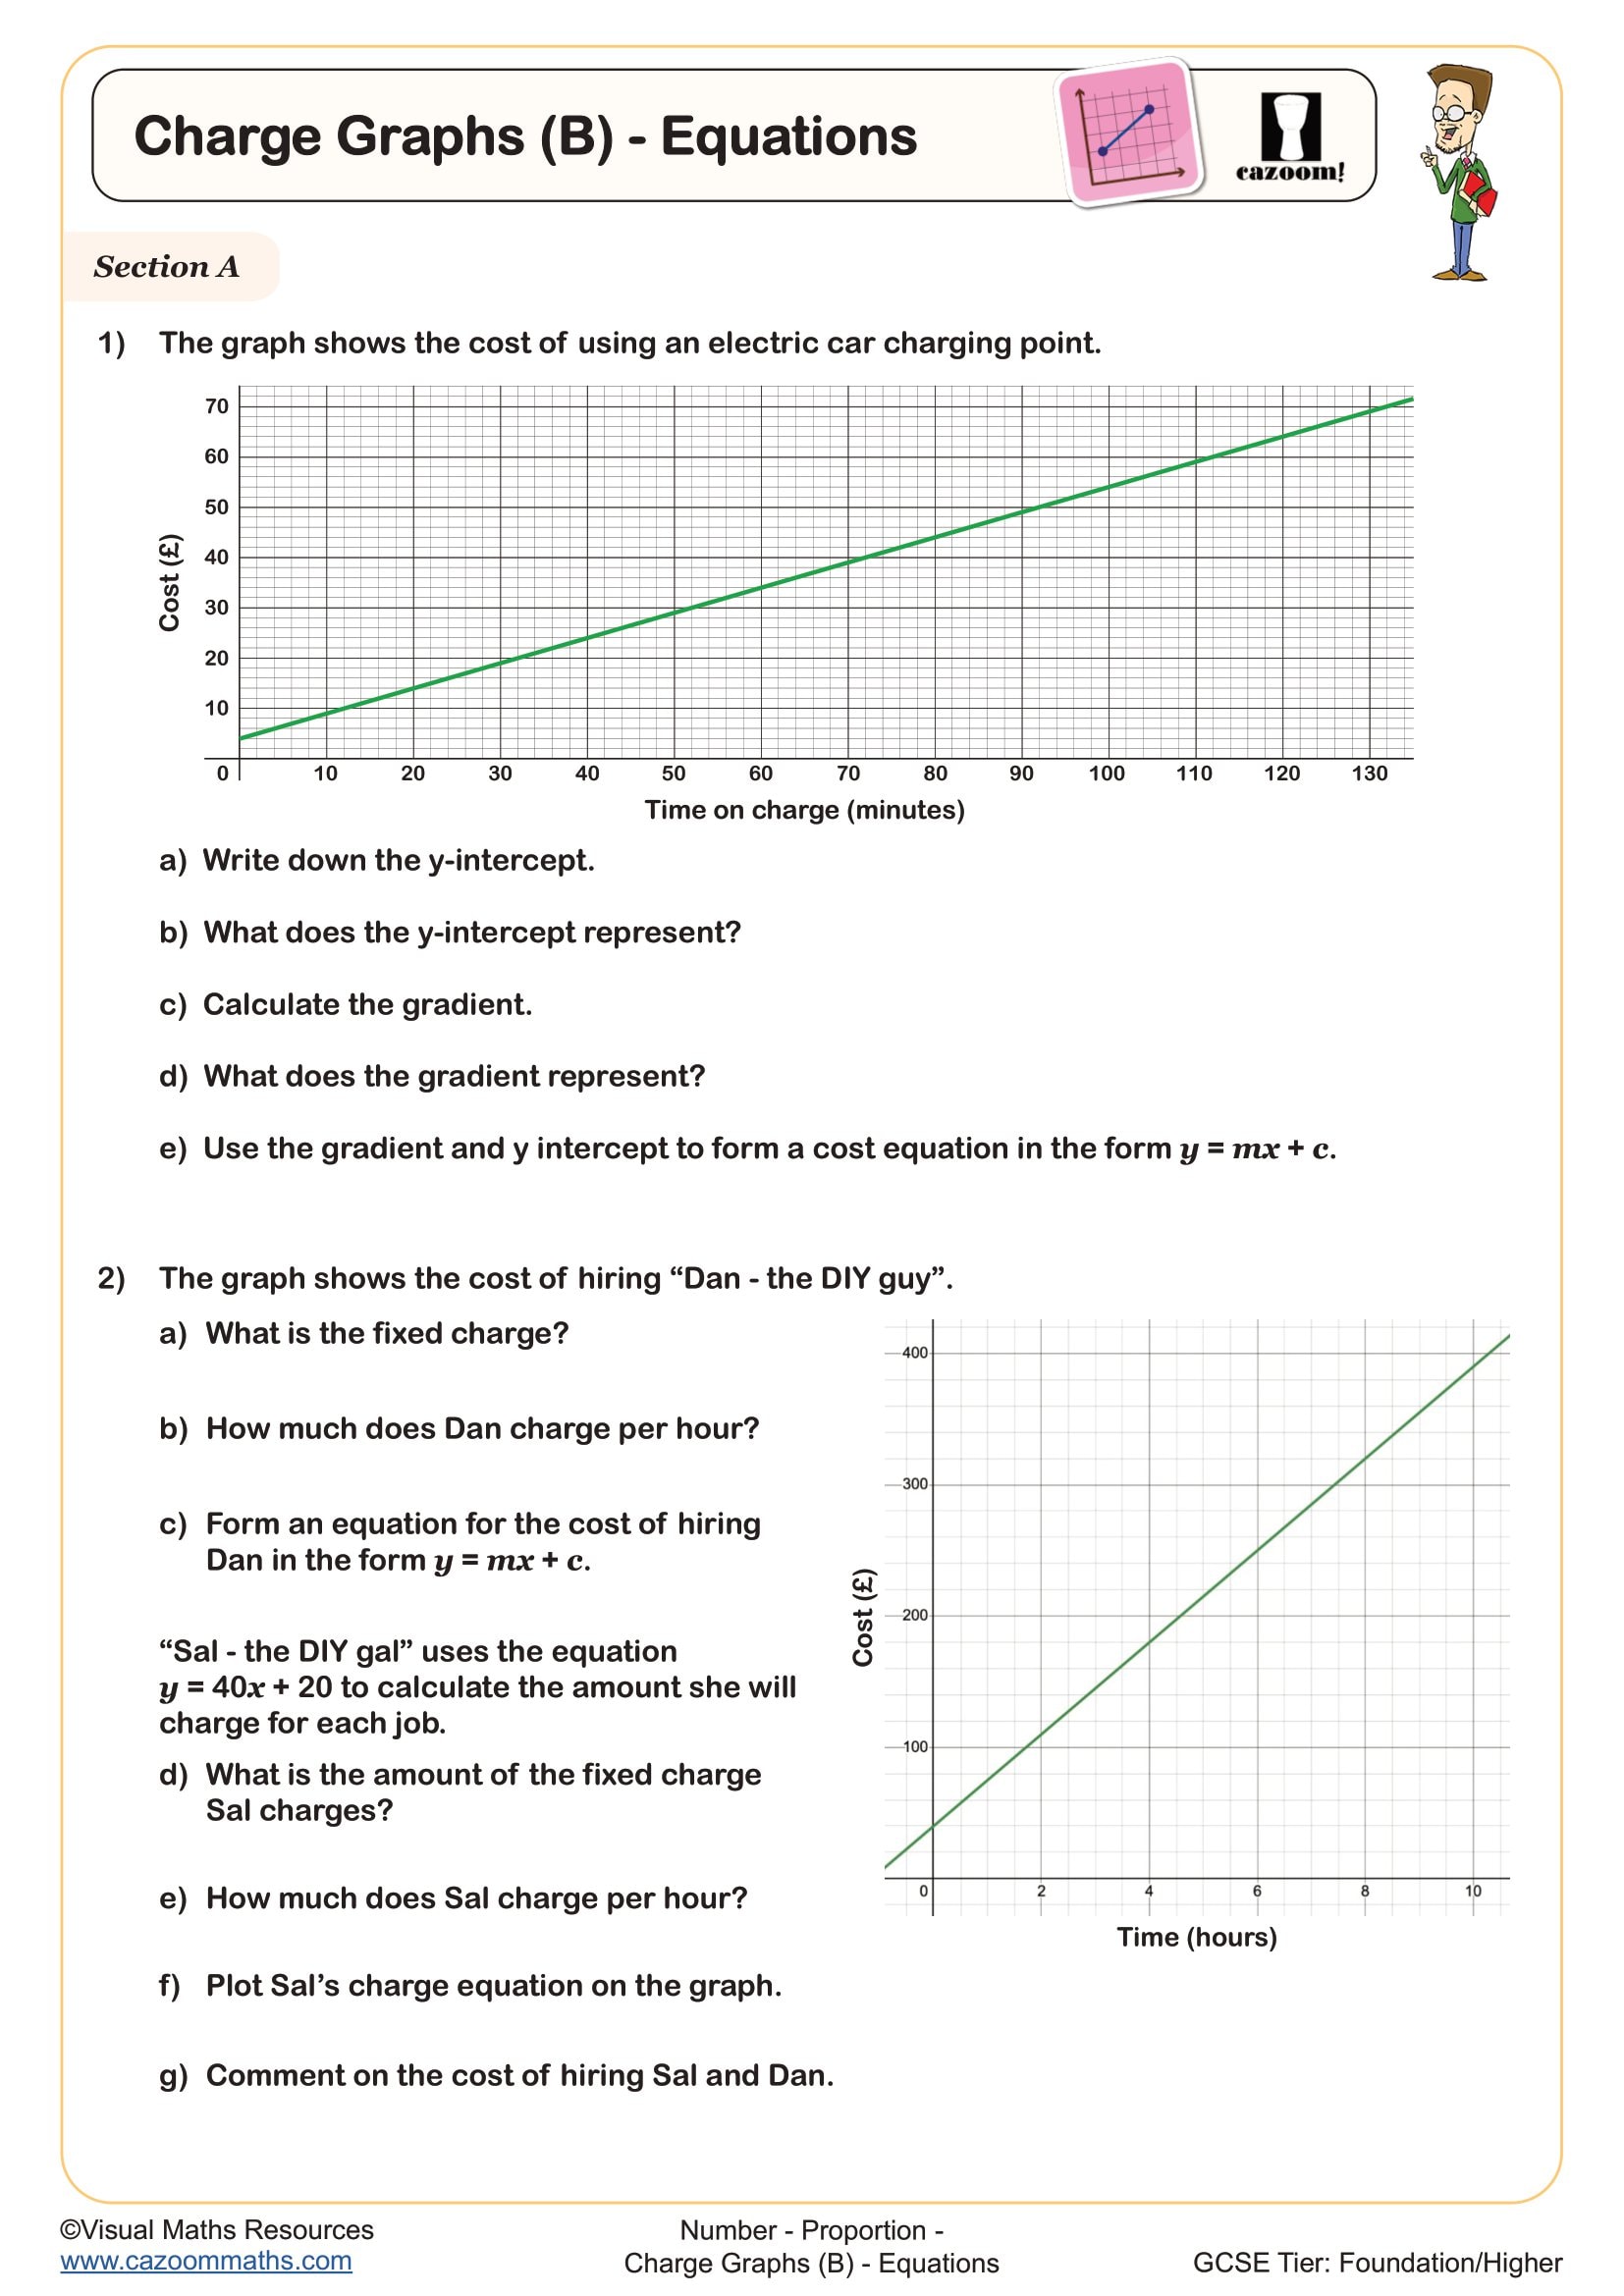
Charge Graphs (B) - Equations
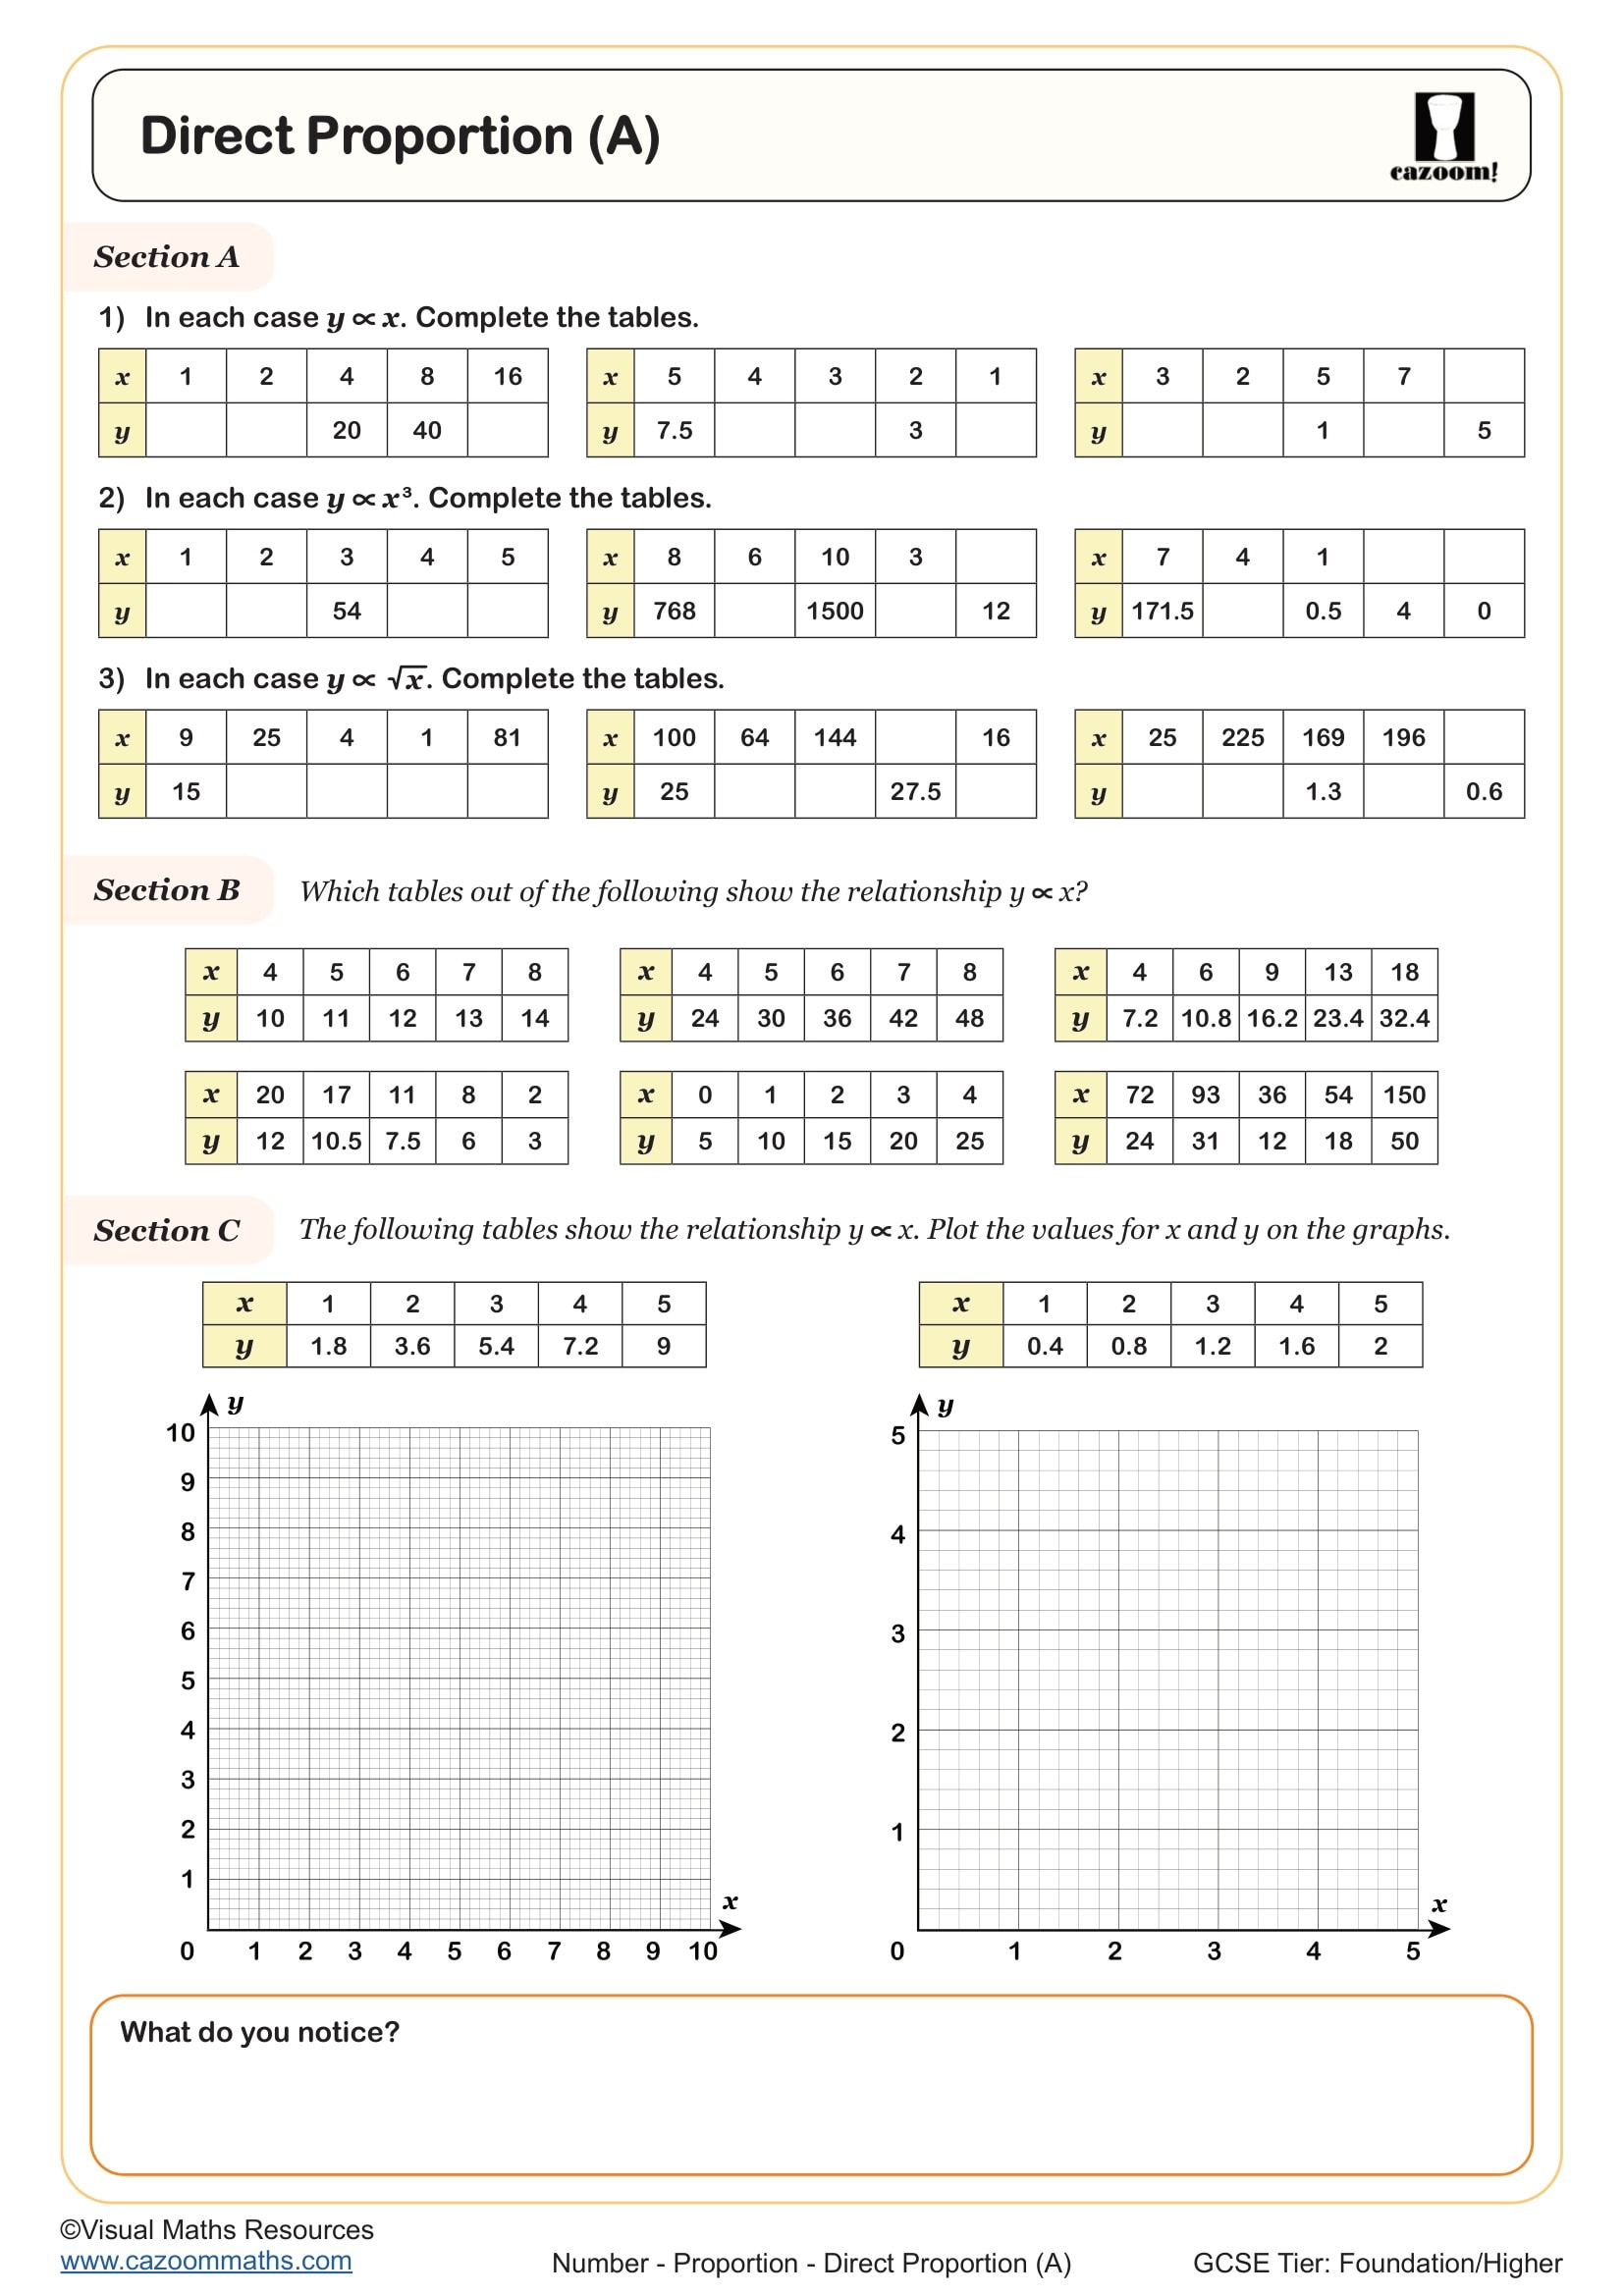
Direct Proportion A
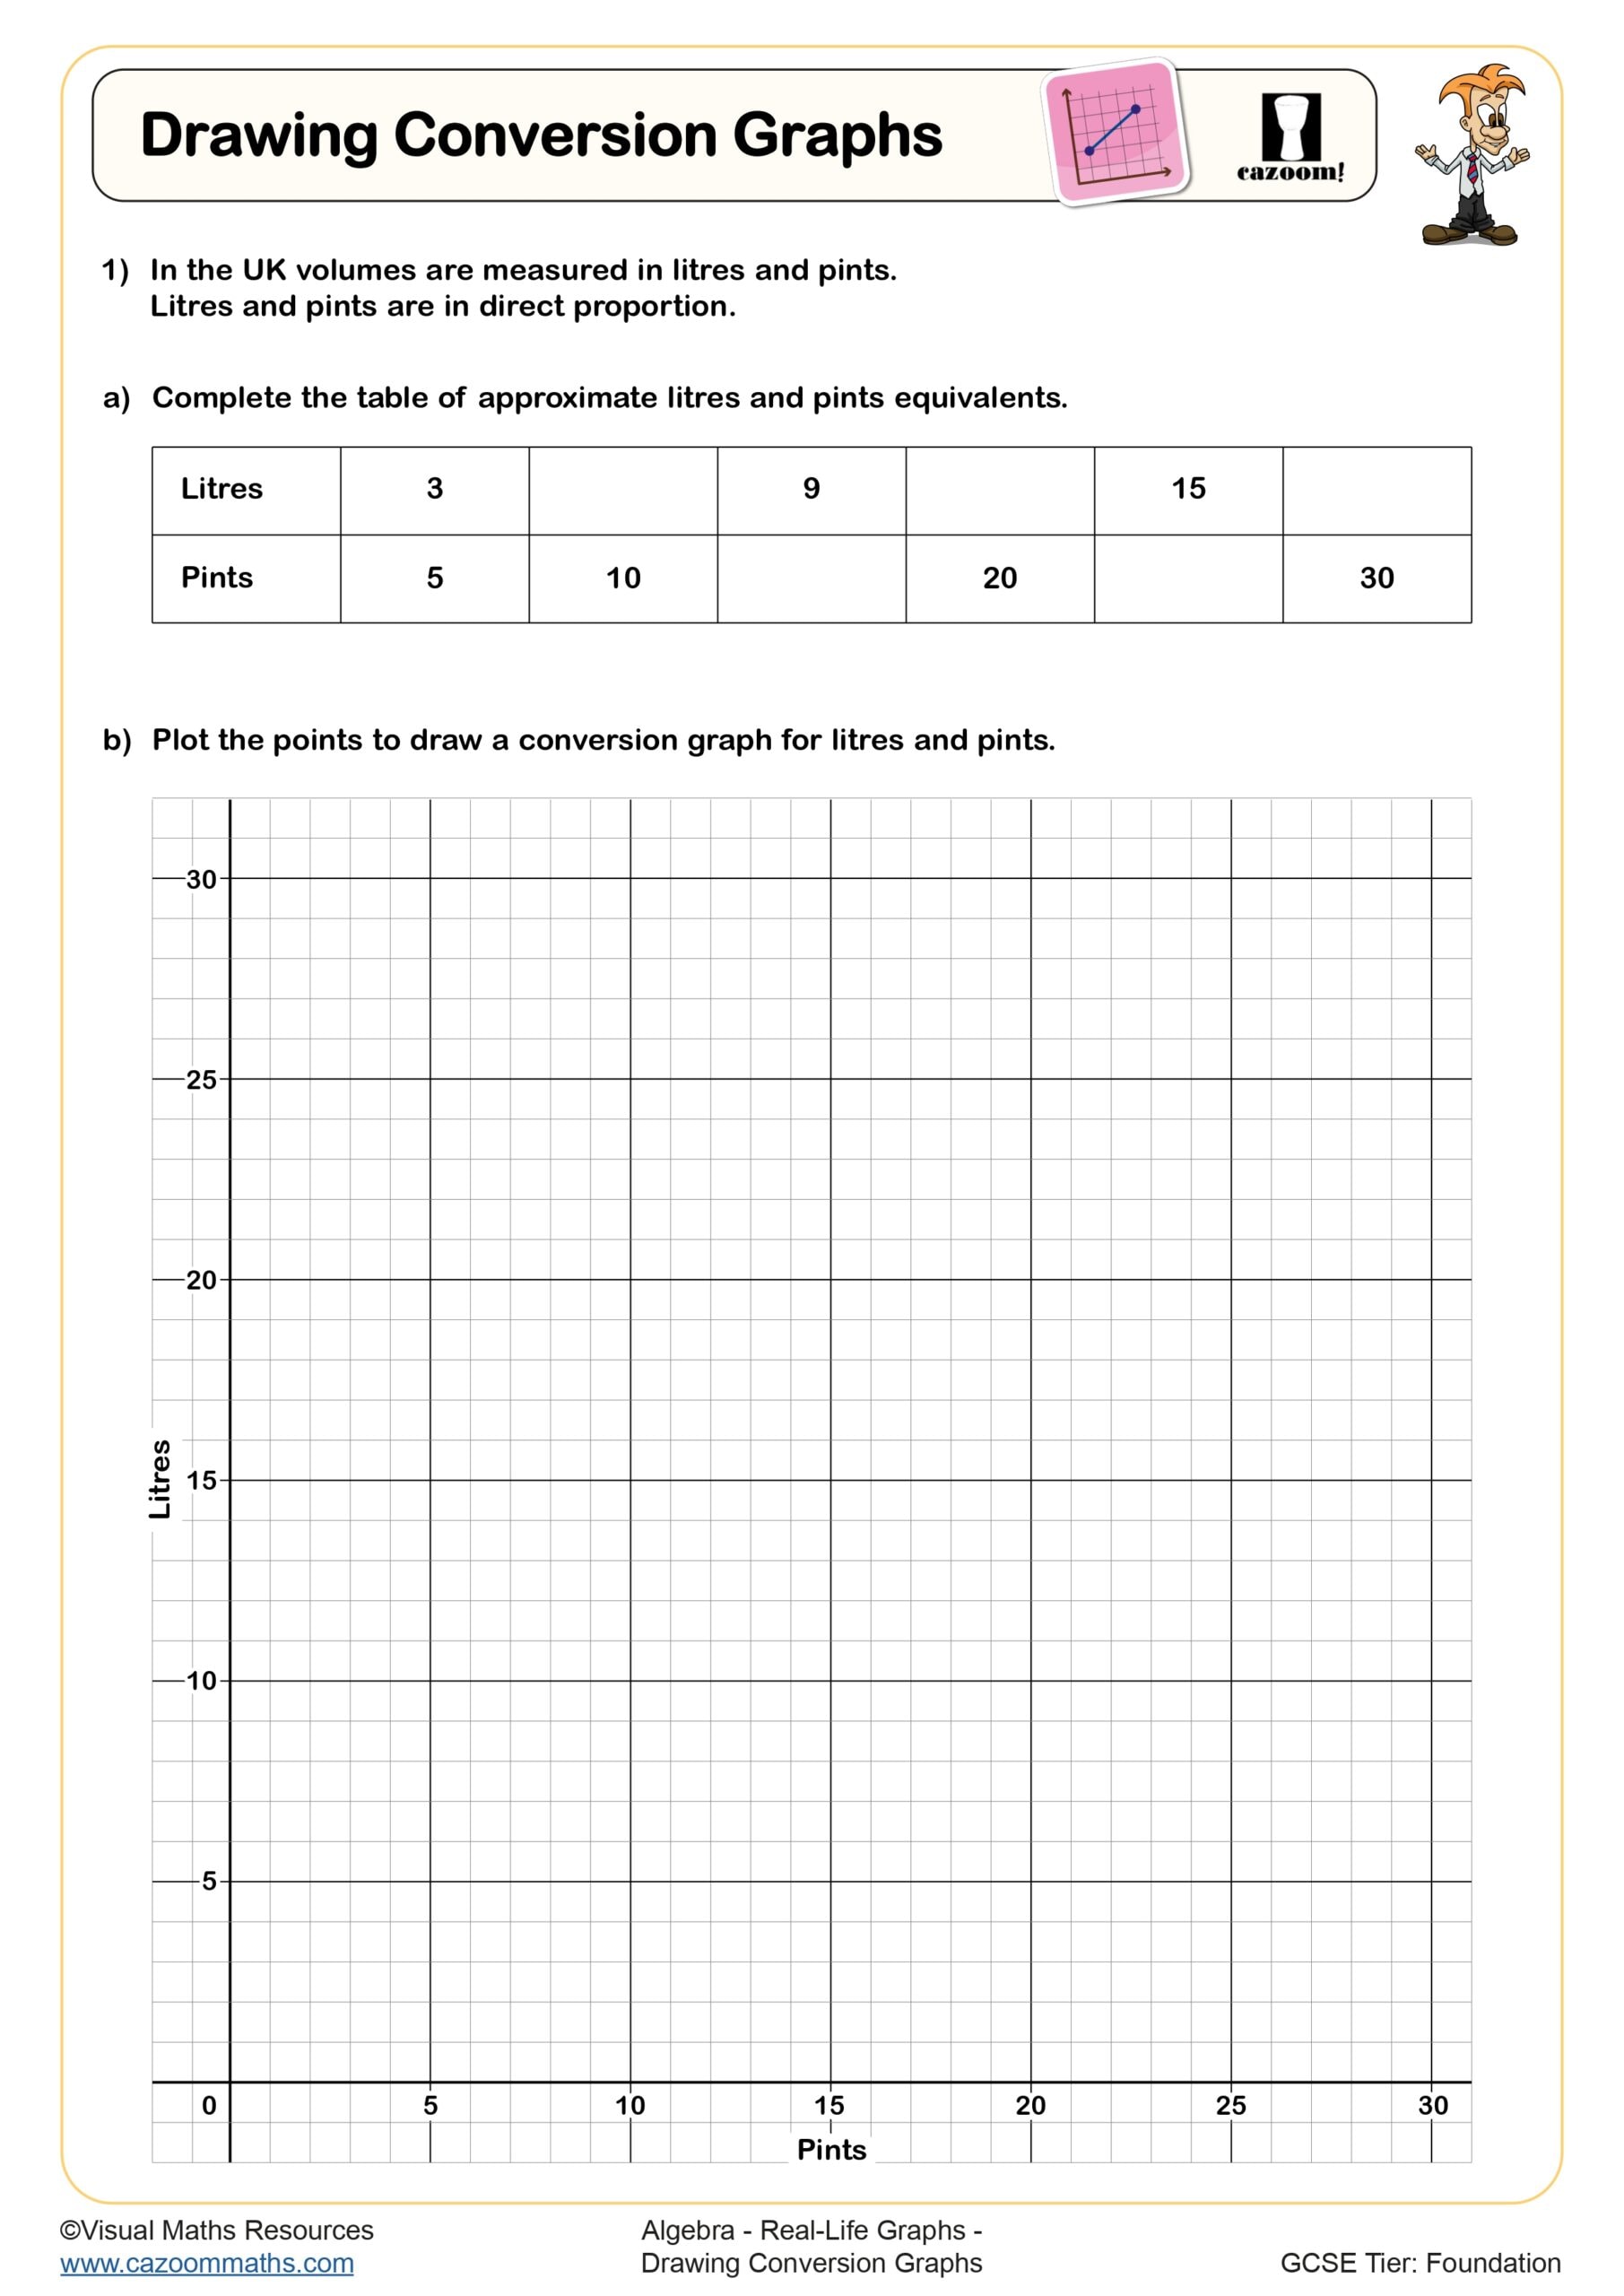
Drawing Conversion Graphs
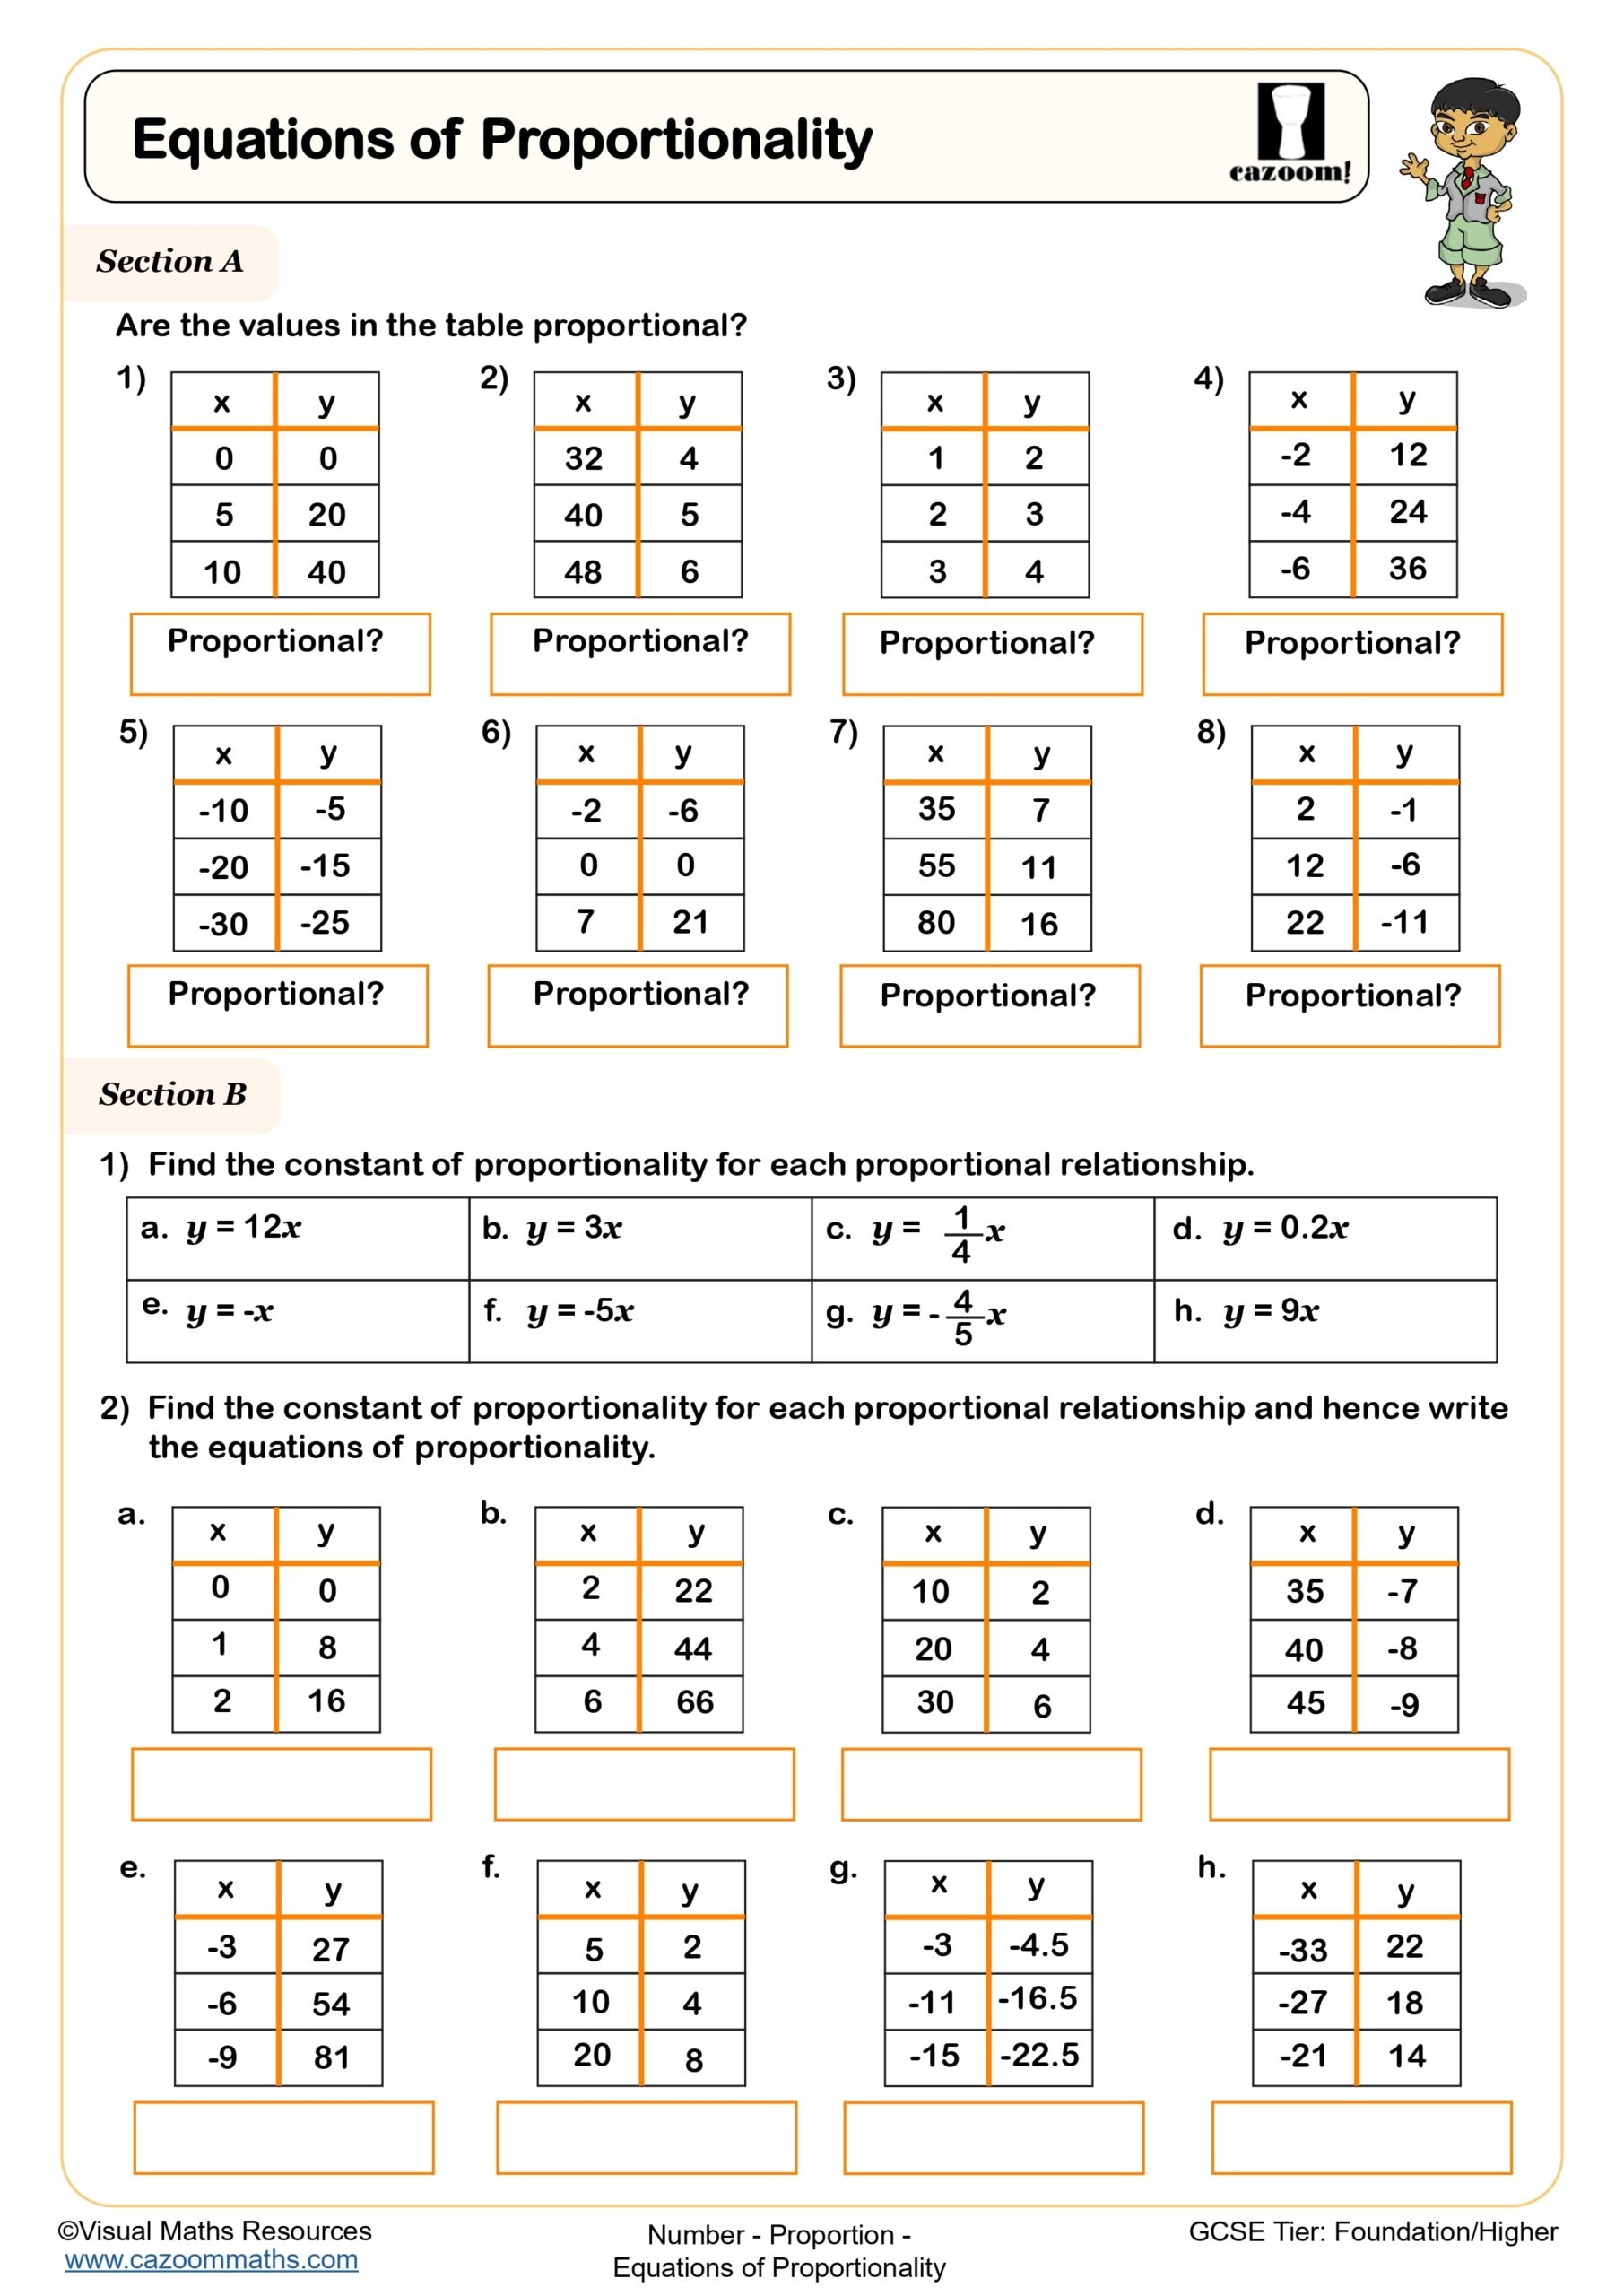
Equations of Proportionality
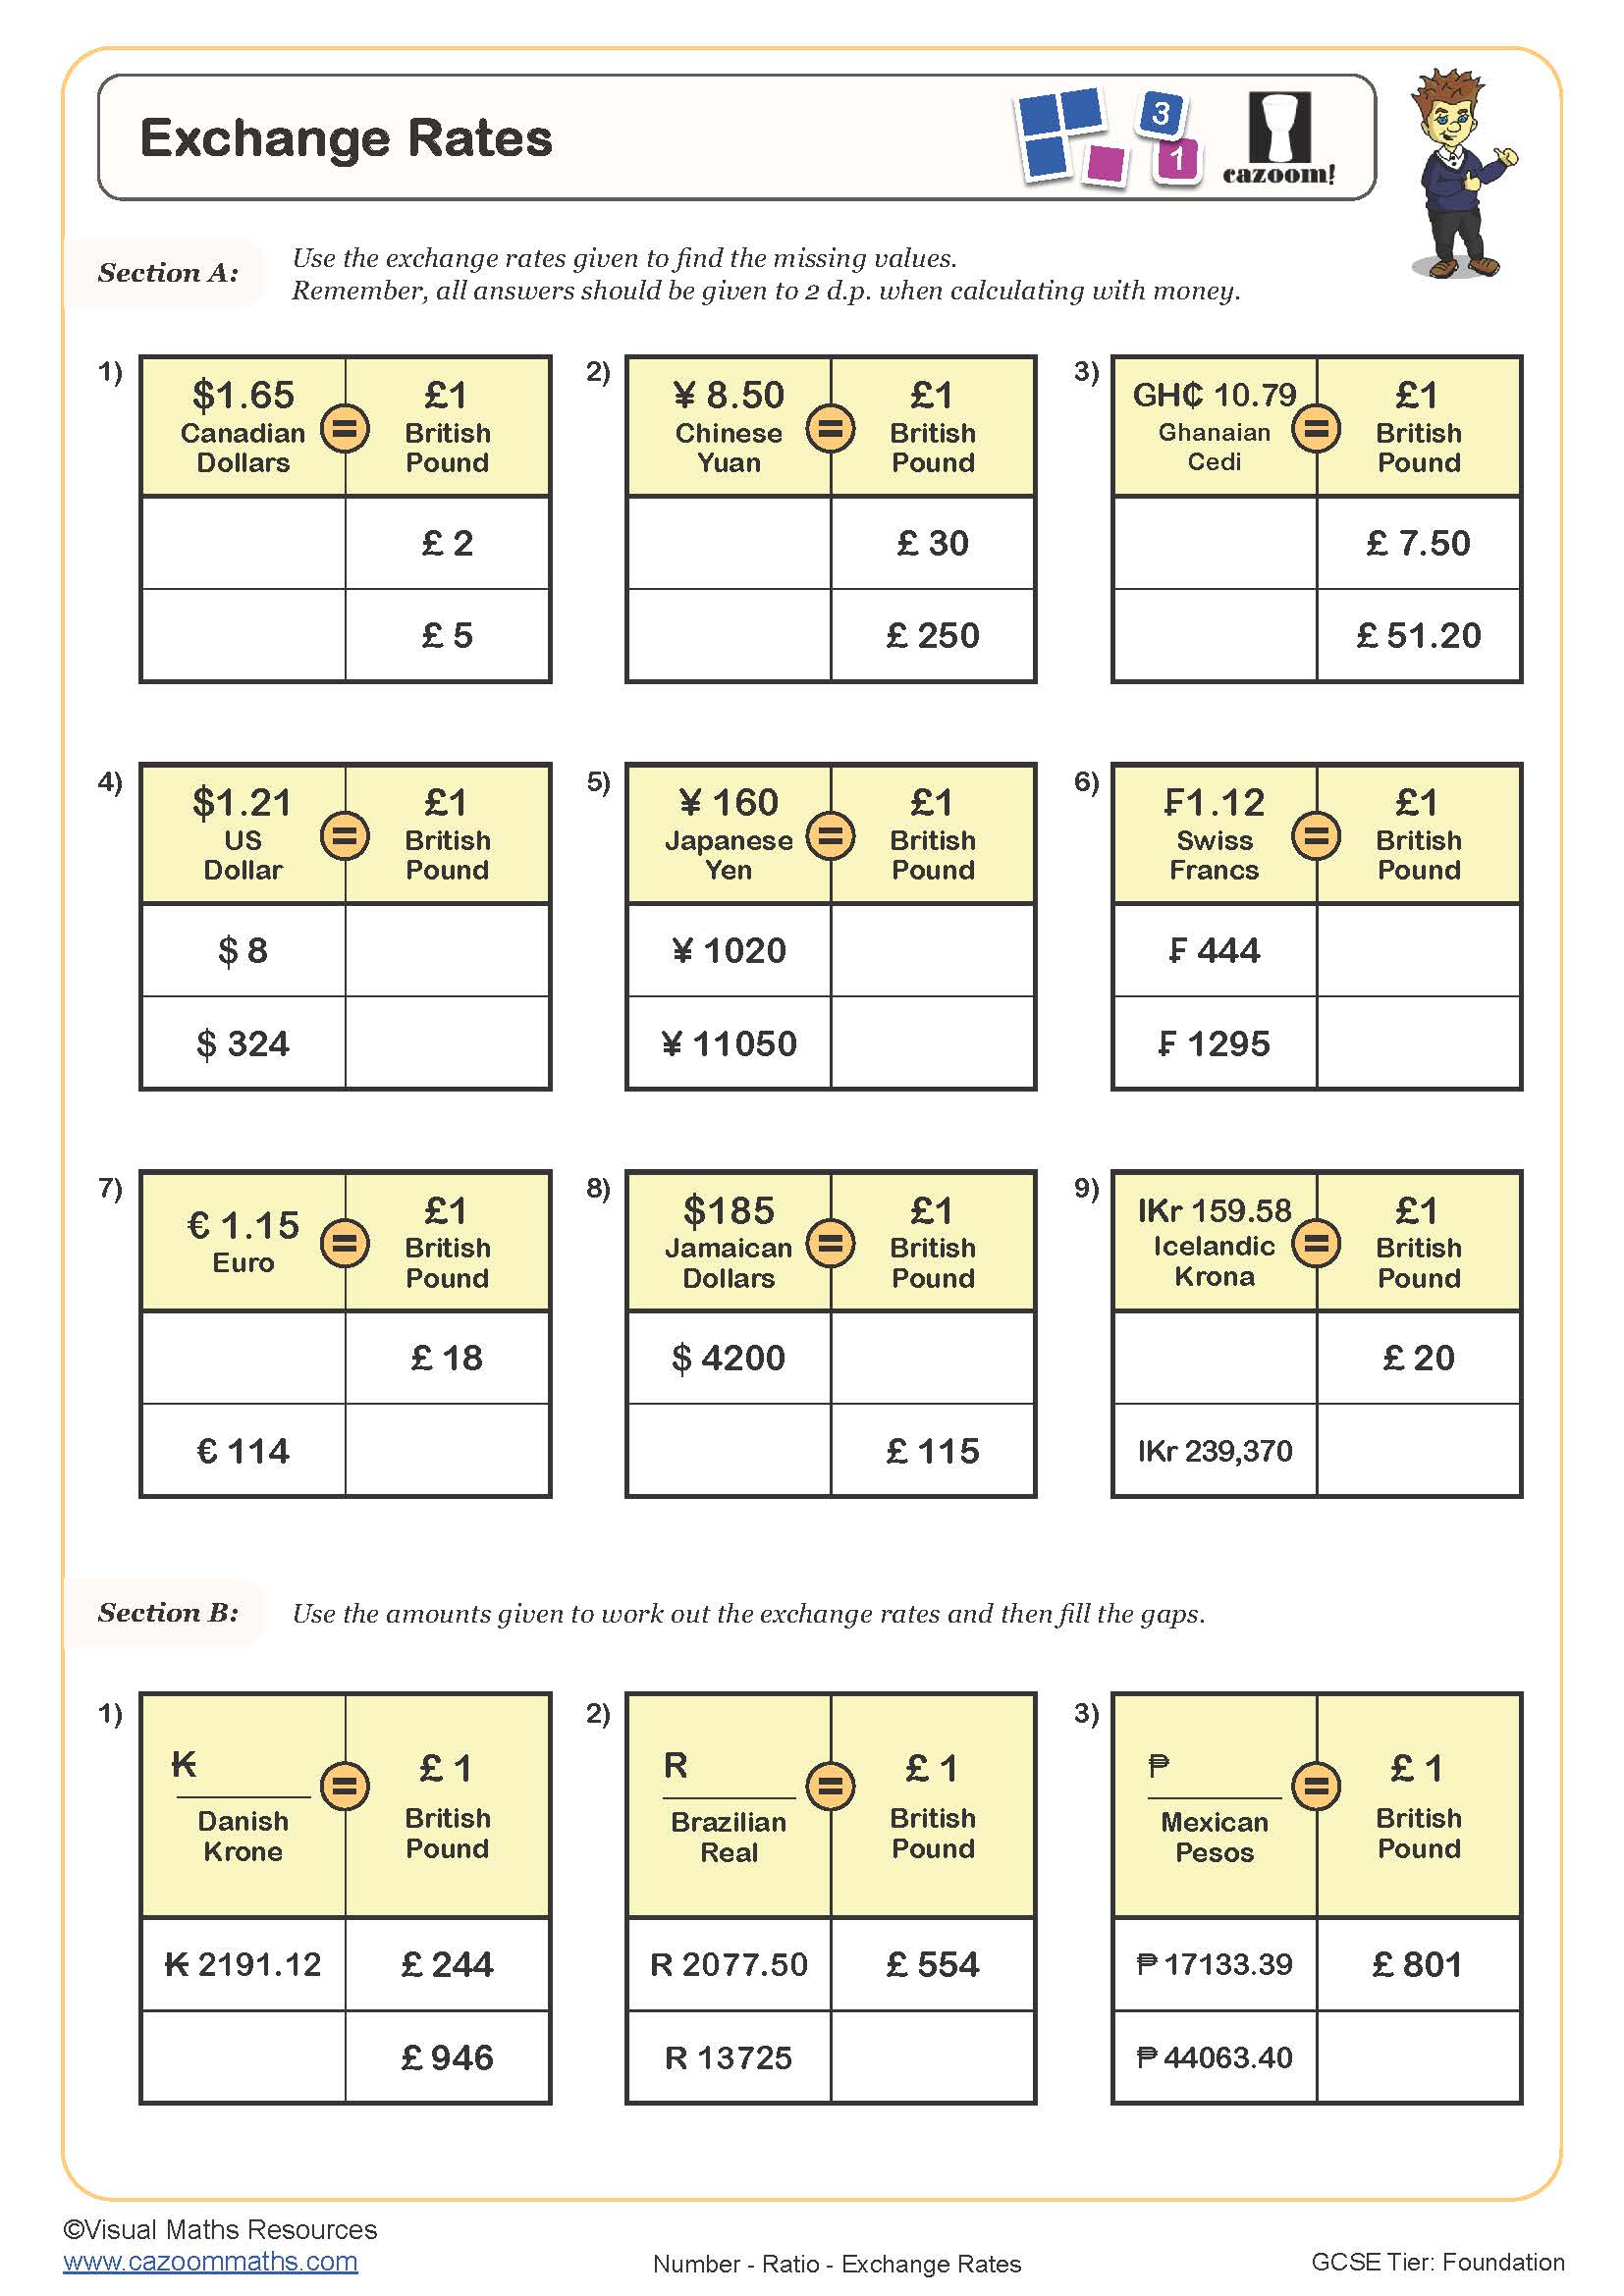
Exchange Rates
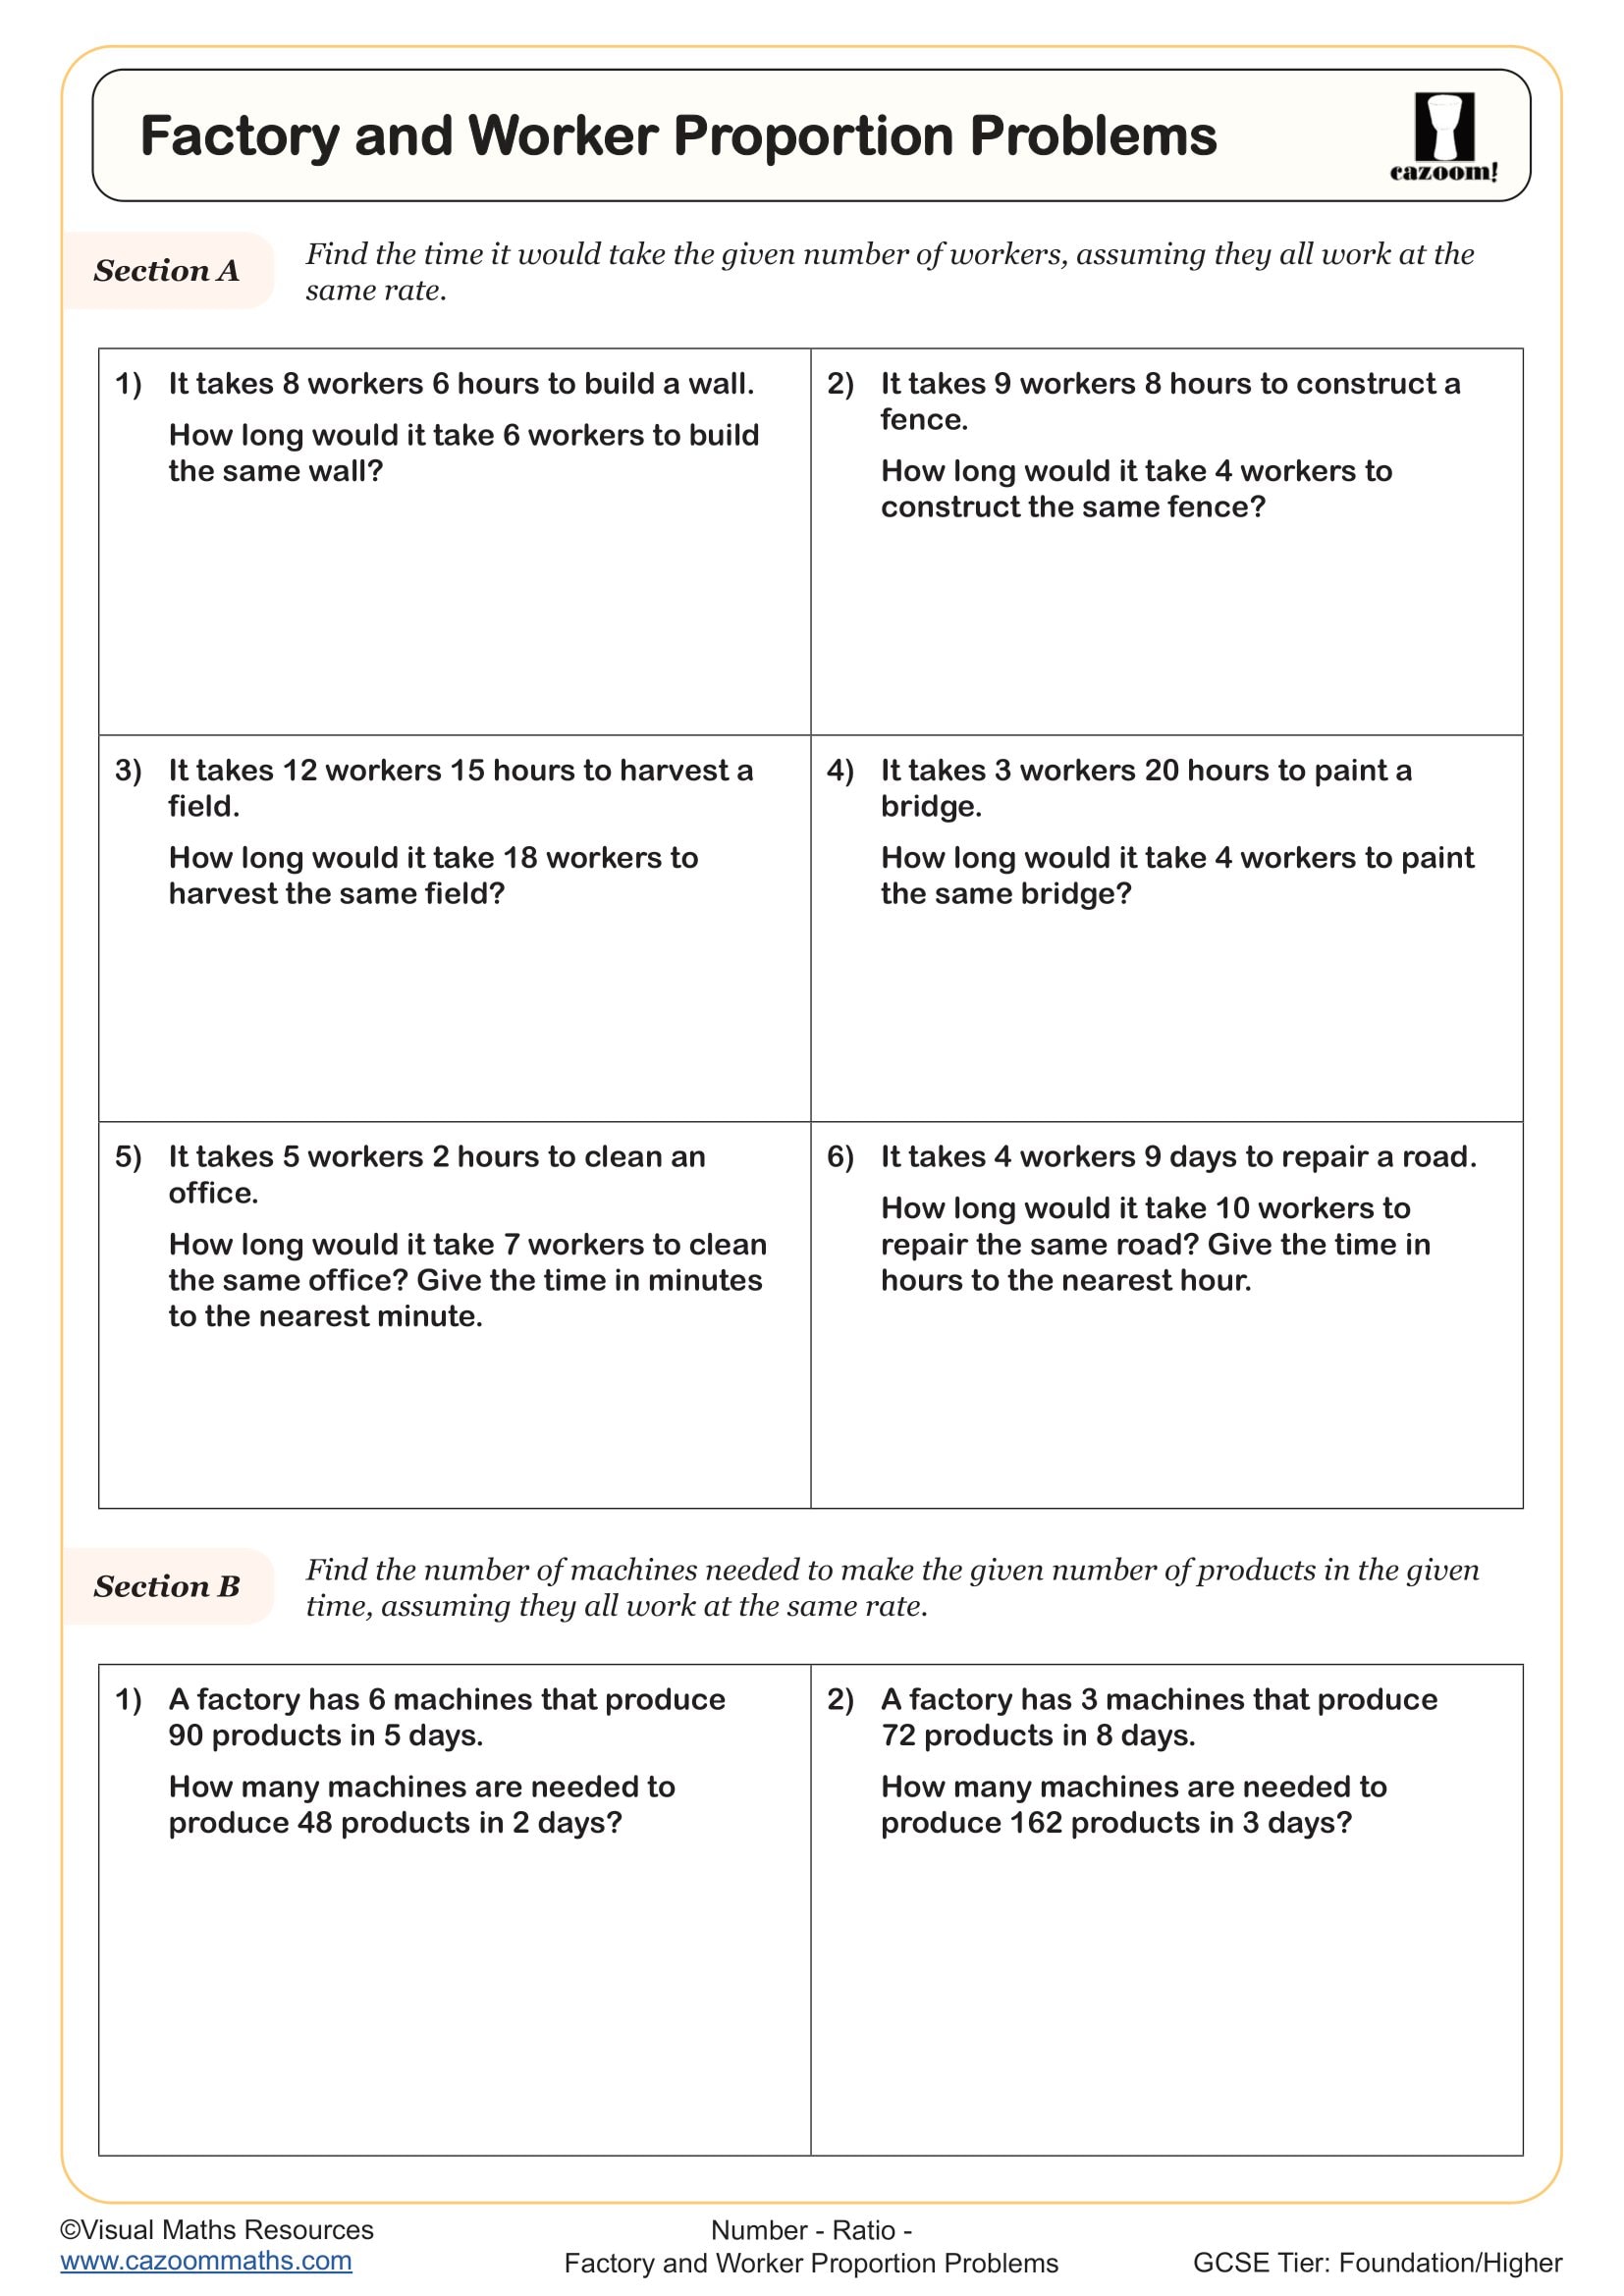
Factory and Worker Proportion Problems
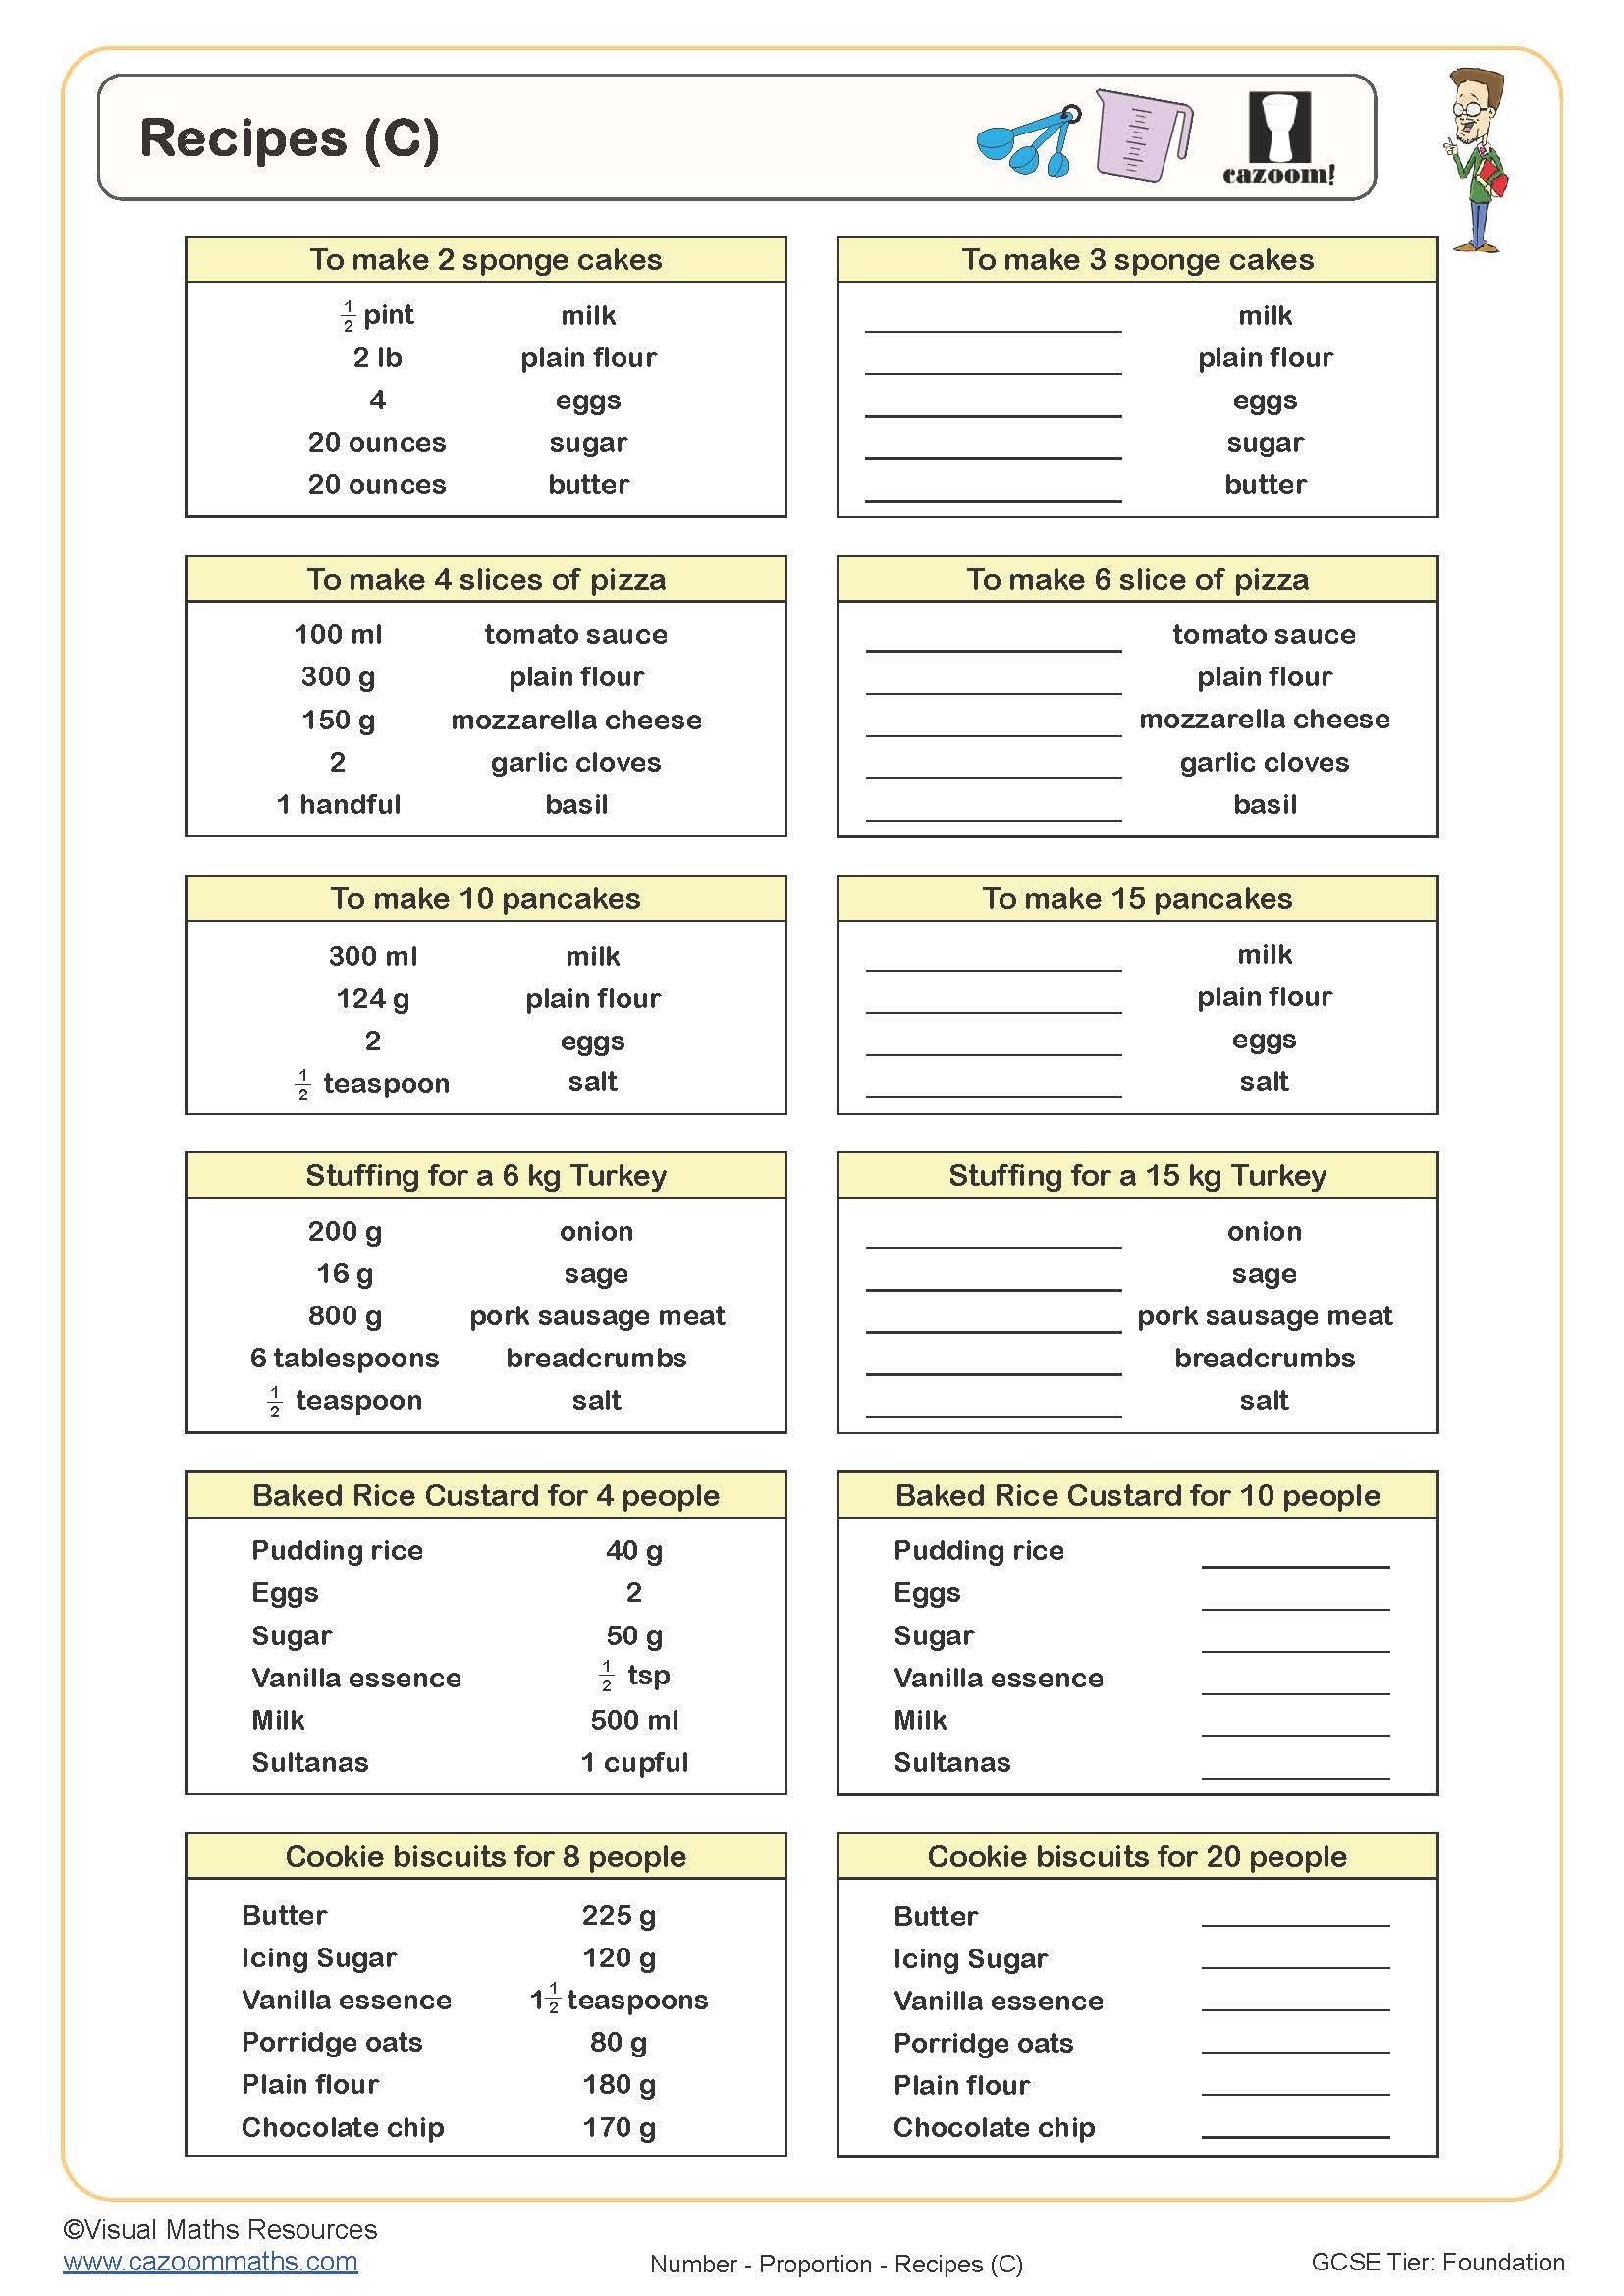
Recipes (C)
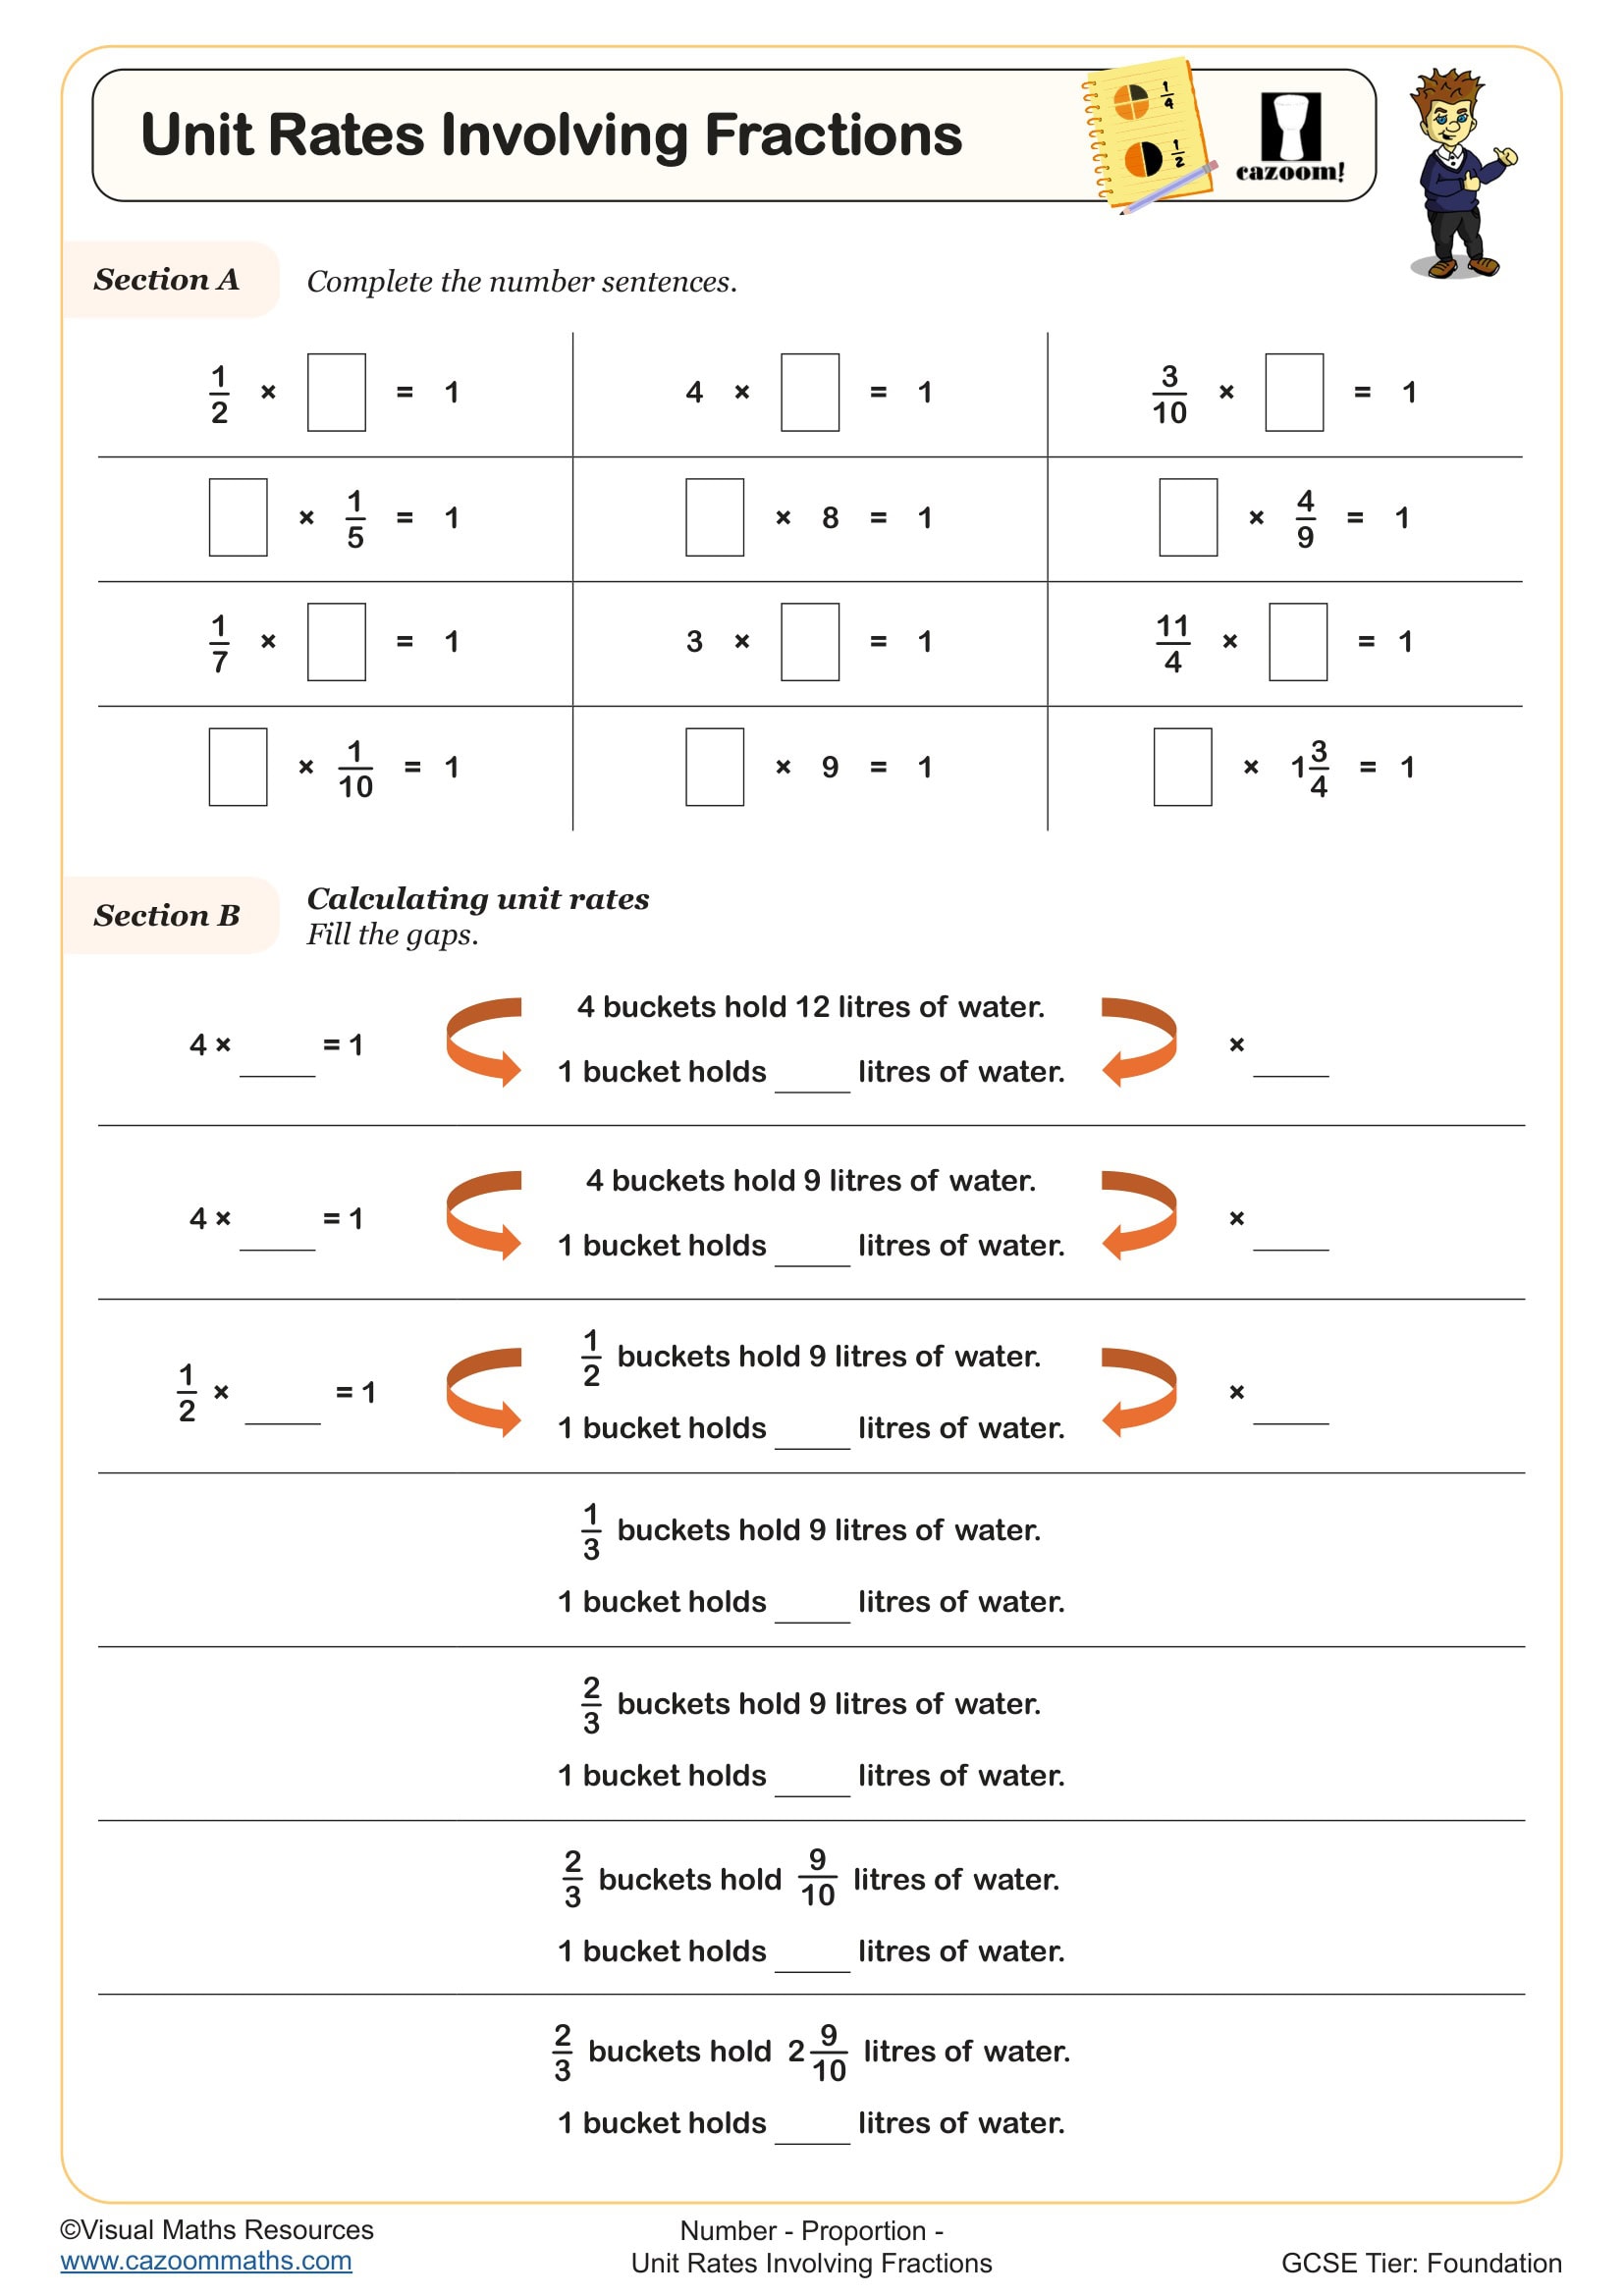
Unit Rates Involving Fractions
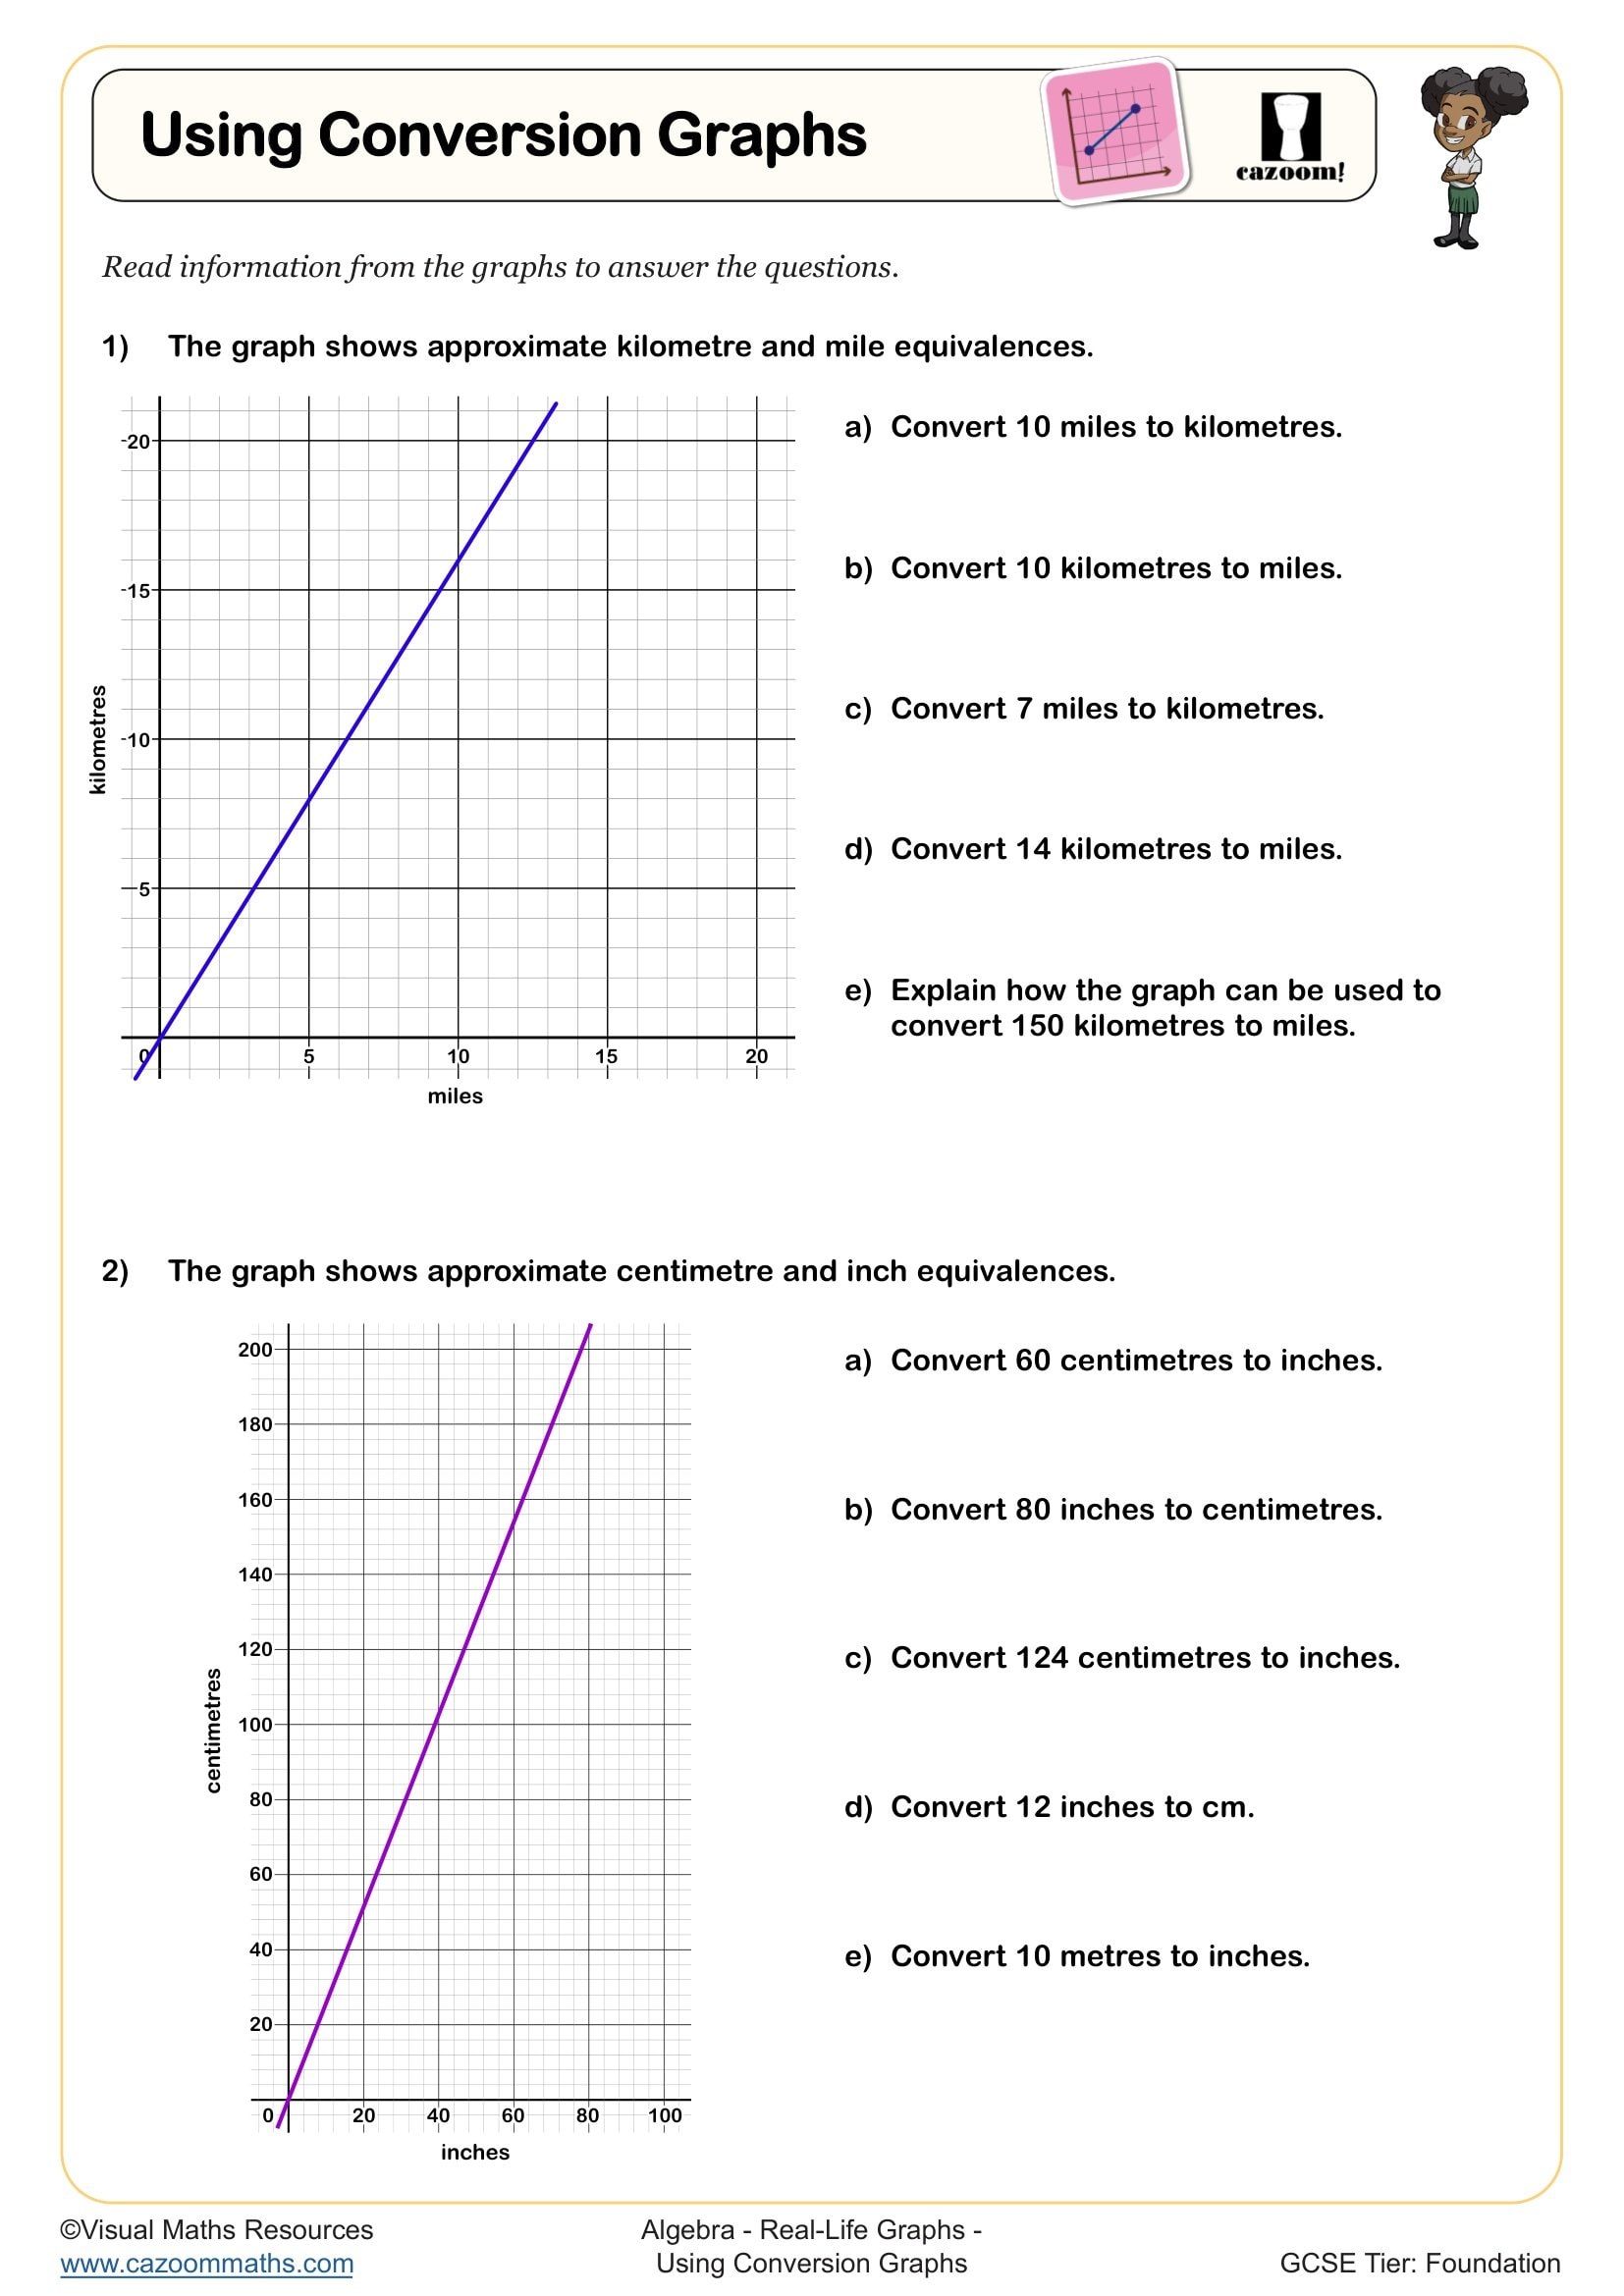
Using Conversion Graphs
All worksheets are created by the team of experienced teachers at Cazoom Maths.
What makes proportions different from other mathematical relationships?
Proportions represent relationships where one quantity increases at a constant rate relative to another, expressed as y = kx for direct proportion or xy = k for inverse proportion. The National Curriculum expects Year 9 students to recognise, represent and solve problems involving direct and inverse proportionality, distinguishing these from simple linear relationships that don't pass through the origin.
Teachers frequently observe that students confuse proportional relationships with any increasing pattern. A common error occurs when students assume that because two quantities both increase, they must be proportional. Effective proportion worksheets include non-examples alongside proportional relationships, helping students develop the discrimination skills needed for GCSE success.
How do proportion worksheets support progression from Year 8 to GCSE?
Year 9 proportion work builds on Year 8 ratio concepts while preparing students for GCSE applications in functions, graphs, and real-world problems. Students move from simple scaling and unitary method calculations to recognising proportional relationships in tables, graphs, and algebraic expressions. This progression supports the Key Stage 4 requirement to use proportion in contexts such as similar shapes, compound measures, and exponential growth.
Many teachers notice that students who struggle with proportional reasoning in Year 9 often find GCSE topics like density, speed, and percentage change particularly challenging. Strong foundation work with proportion worksheets helps students recognise the multiplicative relationships that underpin these more complex applications.
Why do students find inverse proportion more challenging than direct proportion?
Inverse proportion requires students to understand that as one quantity increases, another decreases at a predictable rate, following the relationship xy = k. This concept challenges students' intuitive understanding that 'more of one thing means more of another', which works for direct proportionality. The hyperbolic graph shape and reciprocal calculations involved often create additional cognitive load.
Classroom experience shows that students frequently attempt to solve inverse proportion problems using direct proportion methods, leading to incorrect answers. Effective worksheets include practical contexts like journey time versus speed, where students can visualise why increasing speed reduces journey time. Answer sheets become particularly valuable here, as students need immediate feedback to correct these systematic errors.
How can teachers use these worksheets to address common proportion misconceptions?
Strategic worksheet selection helps teachers target specific misconceptions systematically. Begin with problems that clearly distinguish proportional from non-proportional relationships, then progress to mixed contexts where students must identify the type of proportionality before solving. Include graphical representations alongside numerical problems, as many students understand proportion better when they can visualise the linear or hyperbolic relationships.
Teachers find that using worksheets with real-world proportion problems helps students connect mathematical concepts to practical applications. Currency conversion, recipe scaling, and map reading provide meaningful contexts that support retention. The complete answer sheets allow teachers to focus on misconceptions during lessons rather than calculation checking, making better use of teaching time.