Distance Time Graphs RESOURCE (FREE DOWNLOAD)
Distance Time Graphs RESOURCE DESCRIPTION
This resource has an image of a distance-time graph and has the different types of line and gradient labelled to describe what could be happening at each stage of the journey.
All worksheets are created by the team of experienced teachers at Cazoom Maths.

RELATED TO Distance Time Graphs
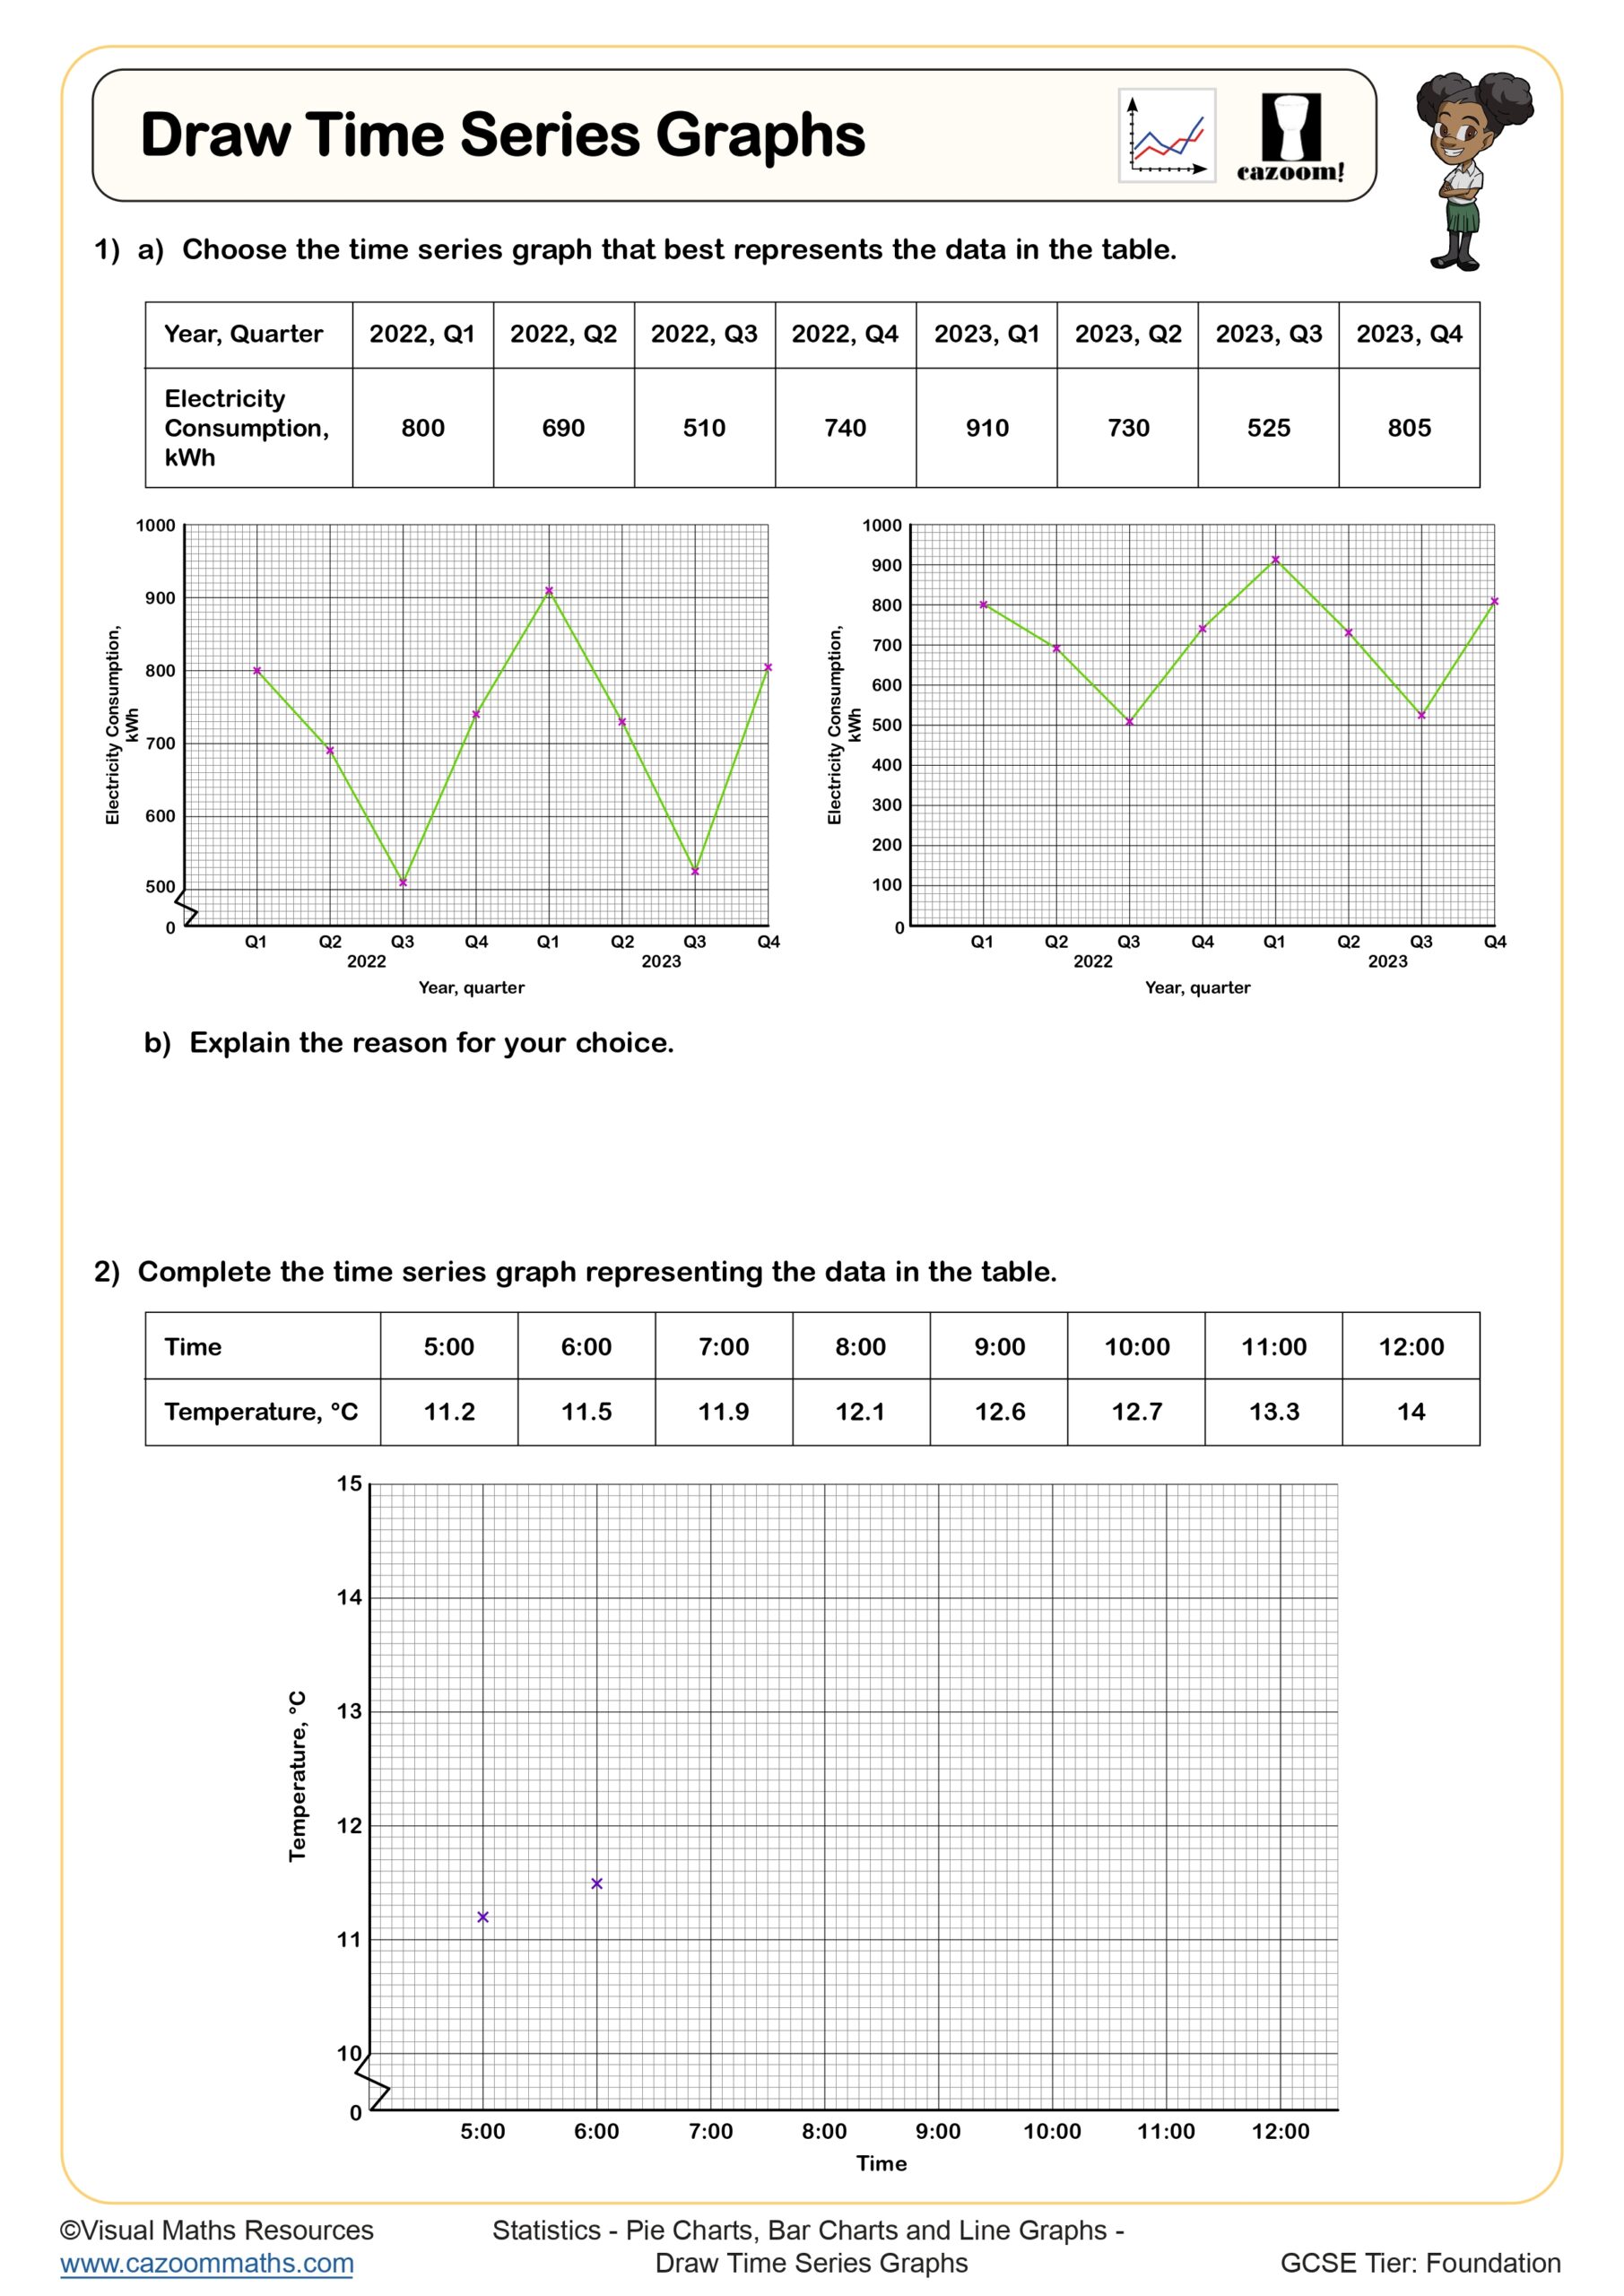
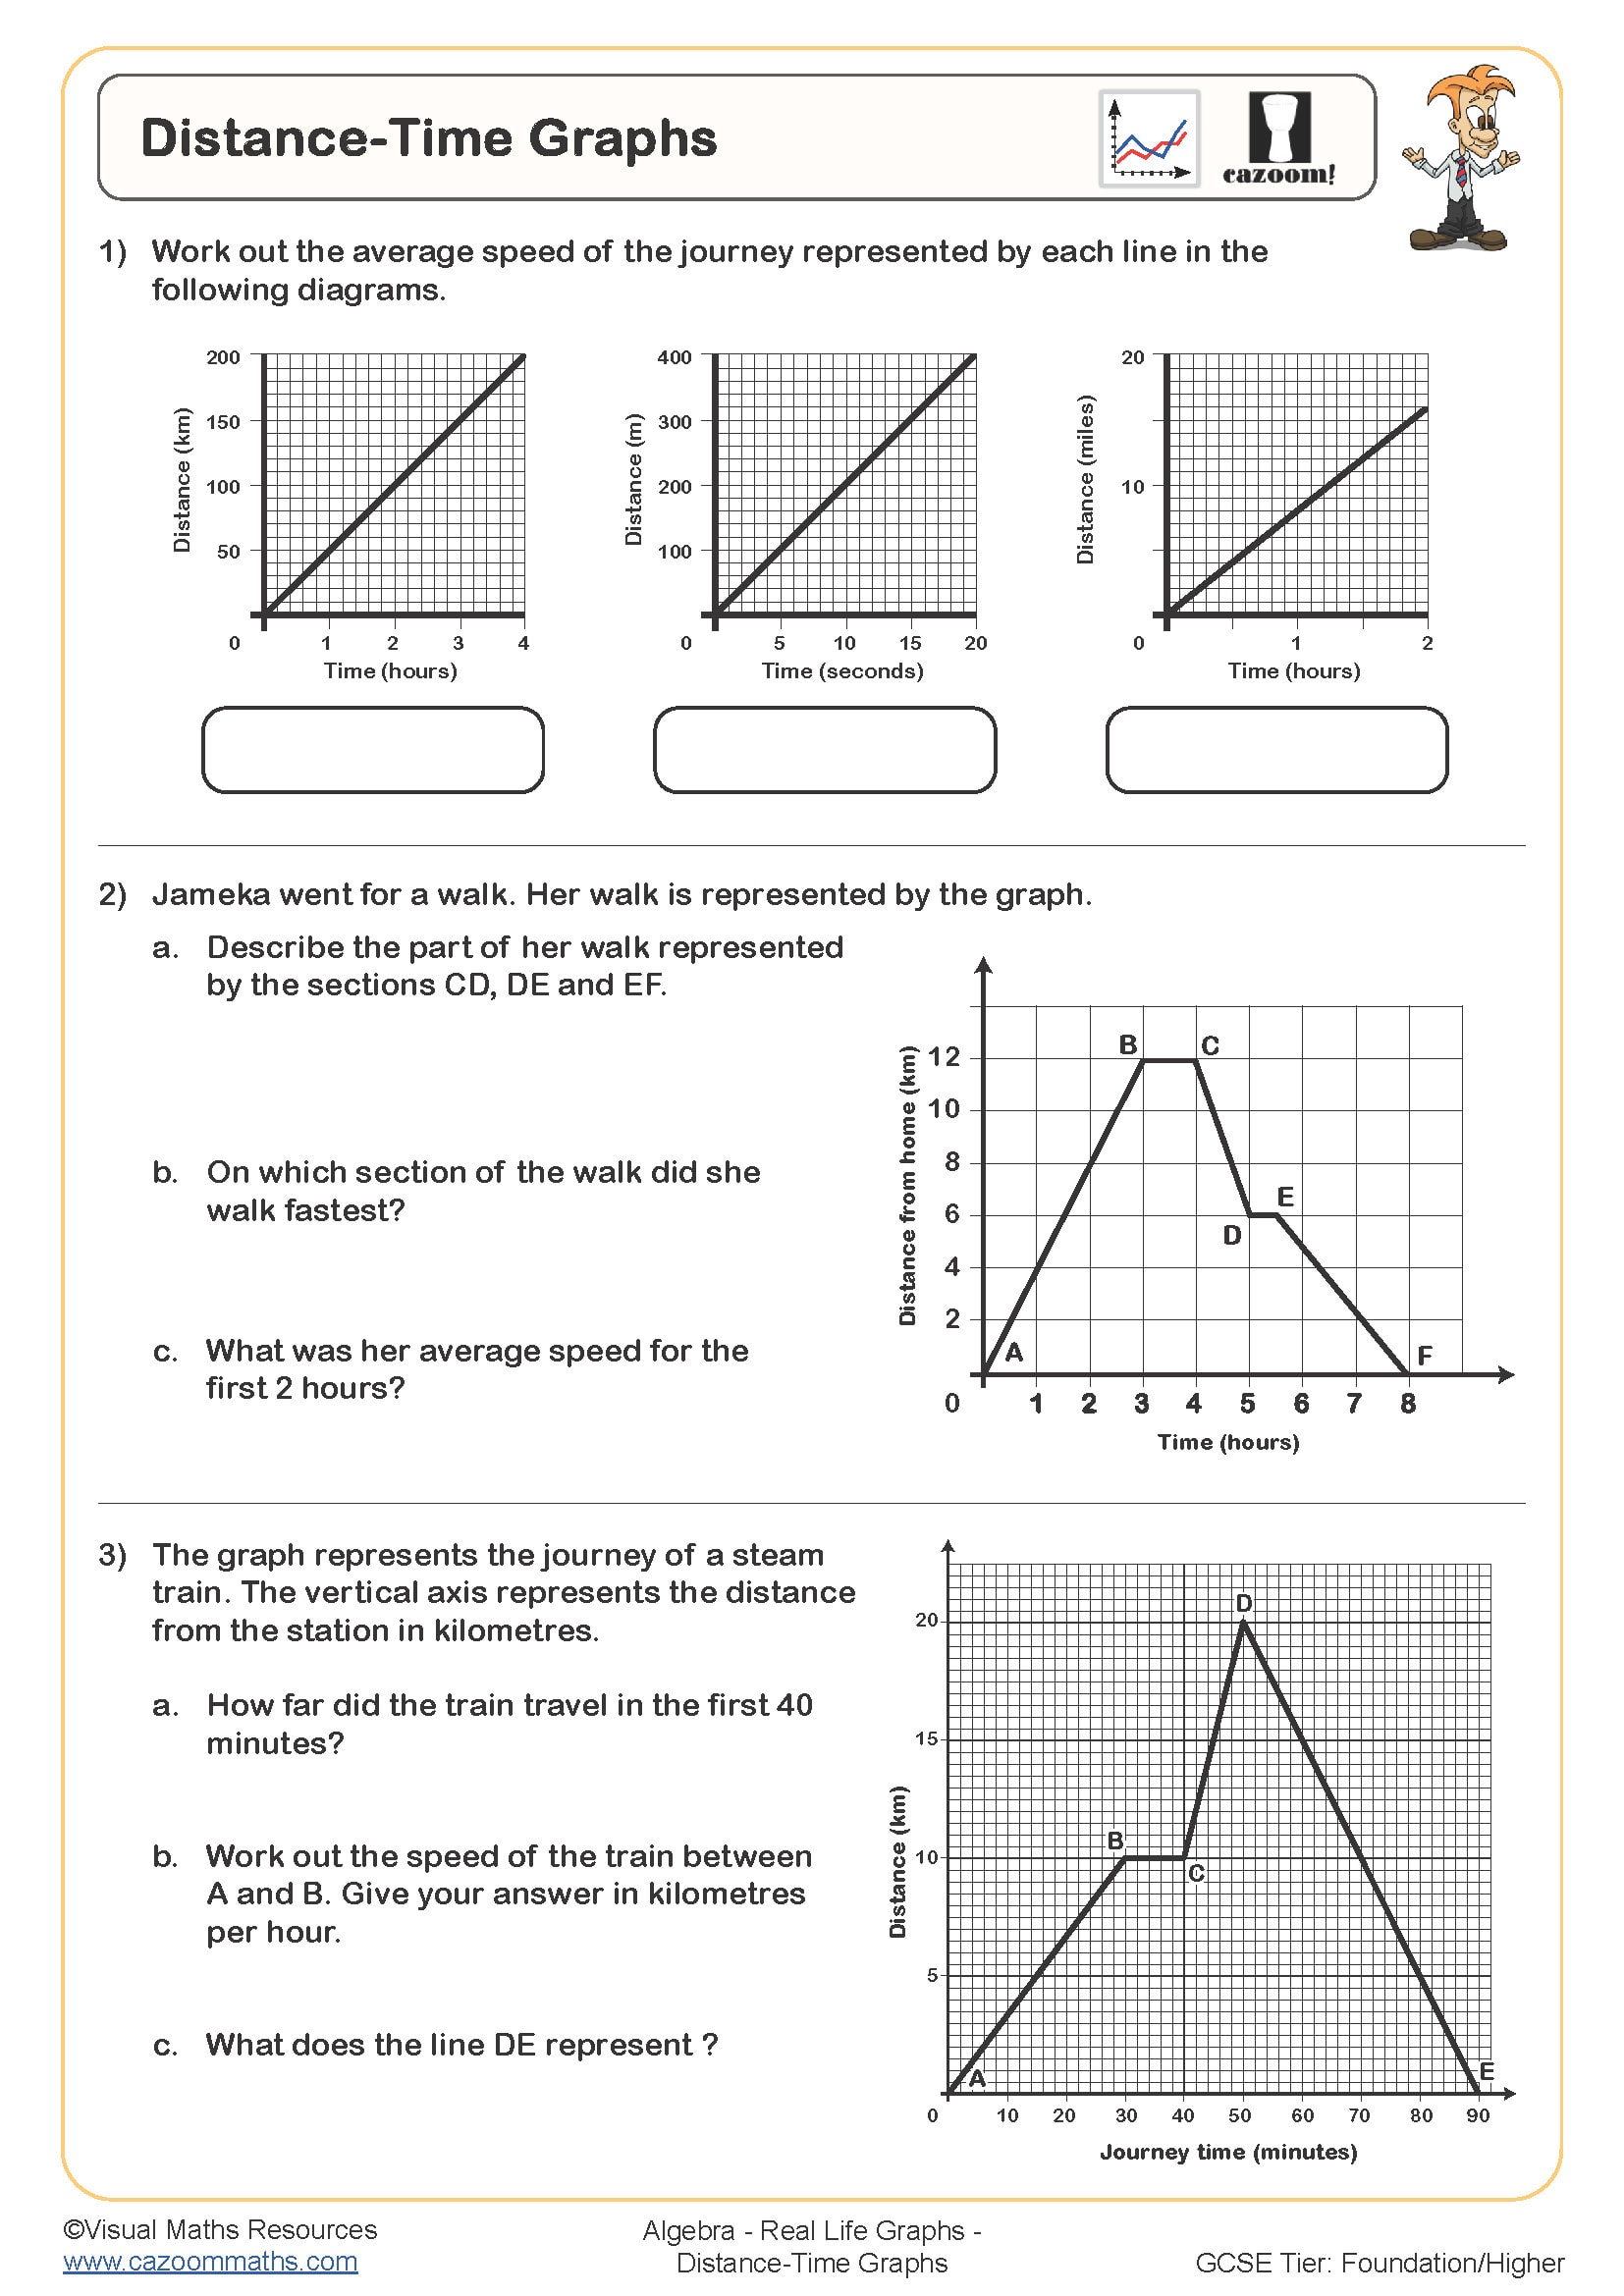
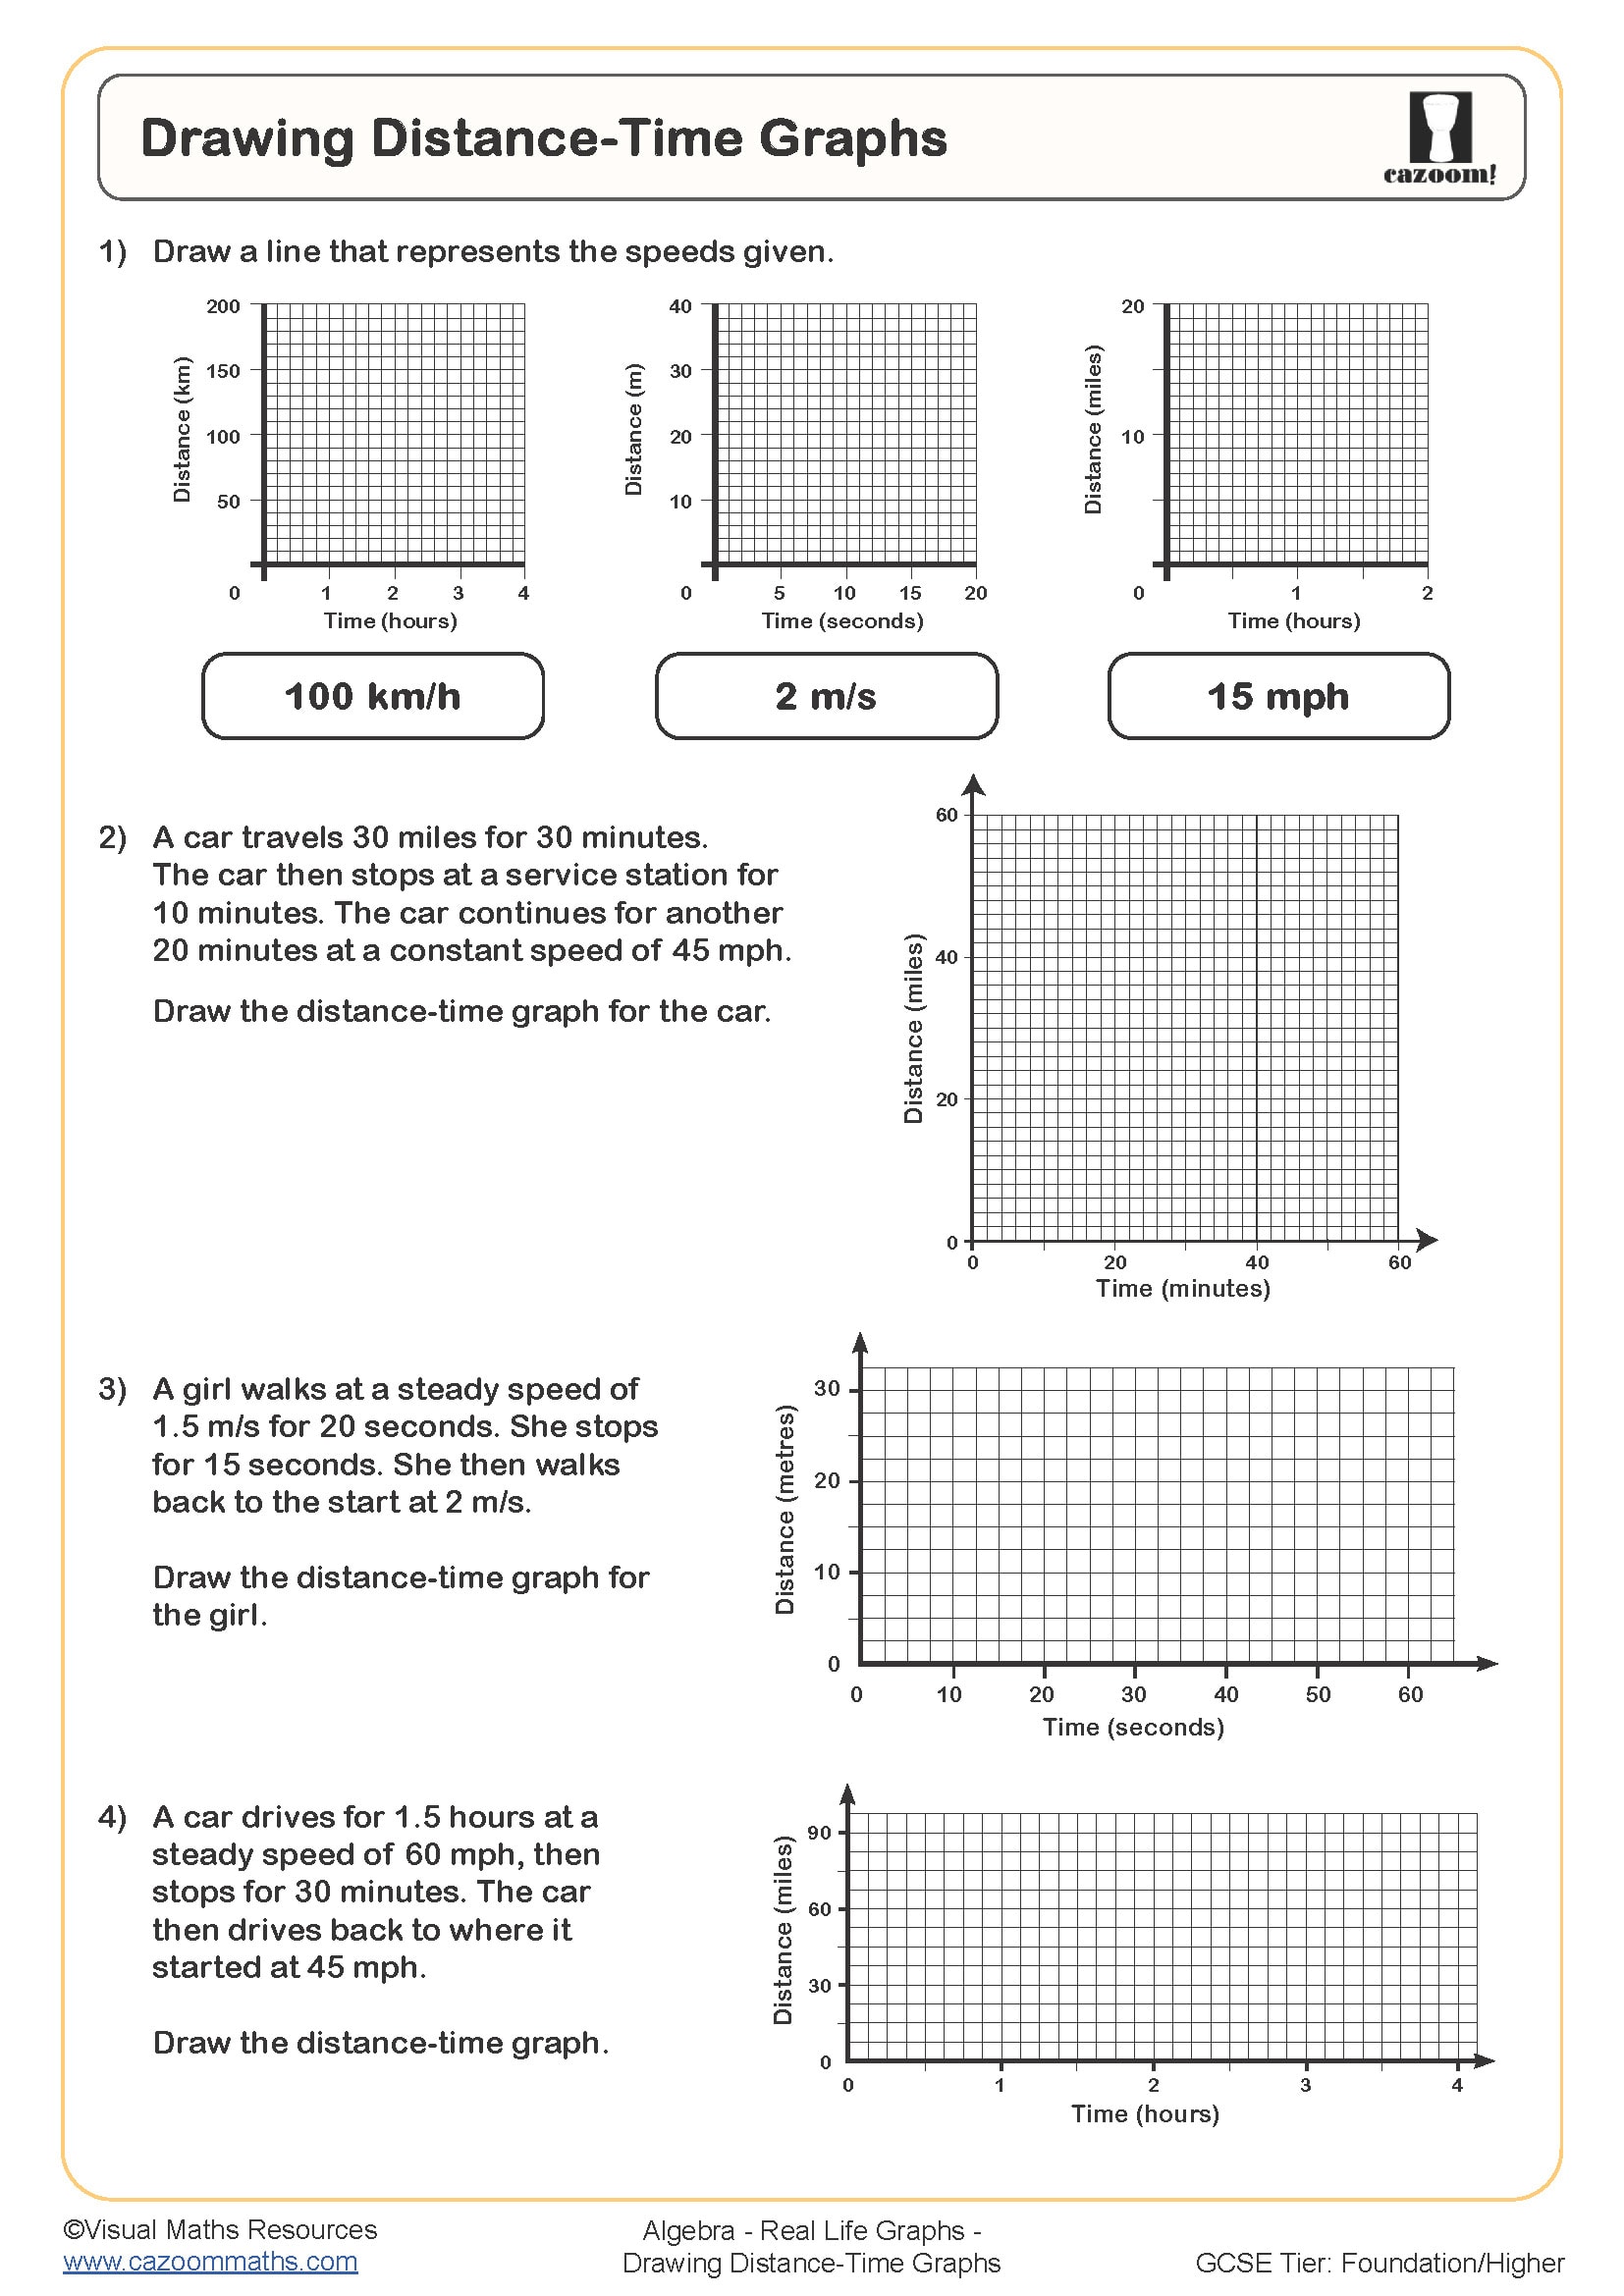
Distance Time Graphs
What is the resource?
This PDF focuses on understanding distance-time graphs. Through visual examples and explanations, it's geared towards secondary school students.
Why are distance-time graphs important?
We live in a world of motion! Distance-time graphs offer a way to visualise this:
- Travel planning: Trains, car journeys – their progress is understood with these graphs.
- Science experiments: Track speeds, acceleration, and even chemical reactions with them.
- Data analysis: Understanding graphs is a cornerstone skill transferable to many subjects.
Why is this resource helpful?
It makes interpreting distance-time graphs much easier through these features:
- Clear diagrams: Offers detailed explanations of what lines on the graph mean.
- Stepped examples: Breaks down how to calculate information from a graph.
- Real-world links: Connects graphs to everyday scenarios students can relate to.
- Practice problems: Offers exercises to build skill and confidence.
- Printable PDF: Great for classroom activities or revision at home.
This resource helps learners see graphs as practical tools. This allows them to solve problems involving journeys, speed, and changing rates.
Also, have a look at our wide range of worksheets that are specifically curated to help your students practice their skills related to real-life graphs. These teaching resources and worksheets are in PDF format and can be downloaded easily.