What is y=mx+c ? RESOURCE (FREE DOWNLOAD)
What is y=mx+c ? RESOURCE DESCRIPTION
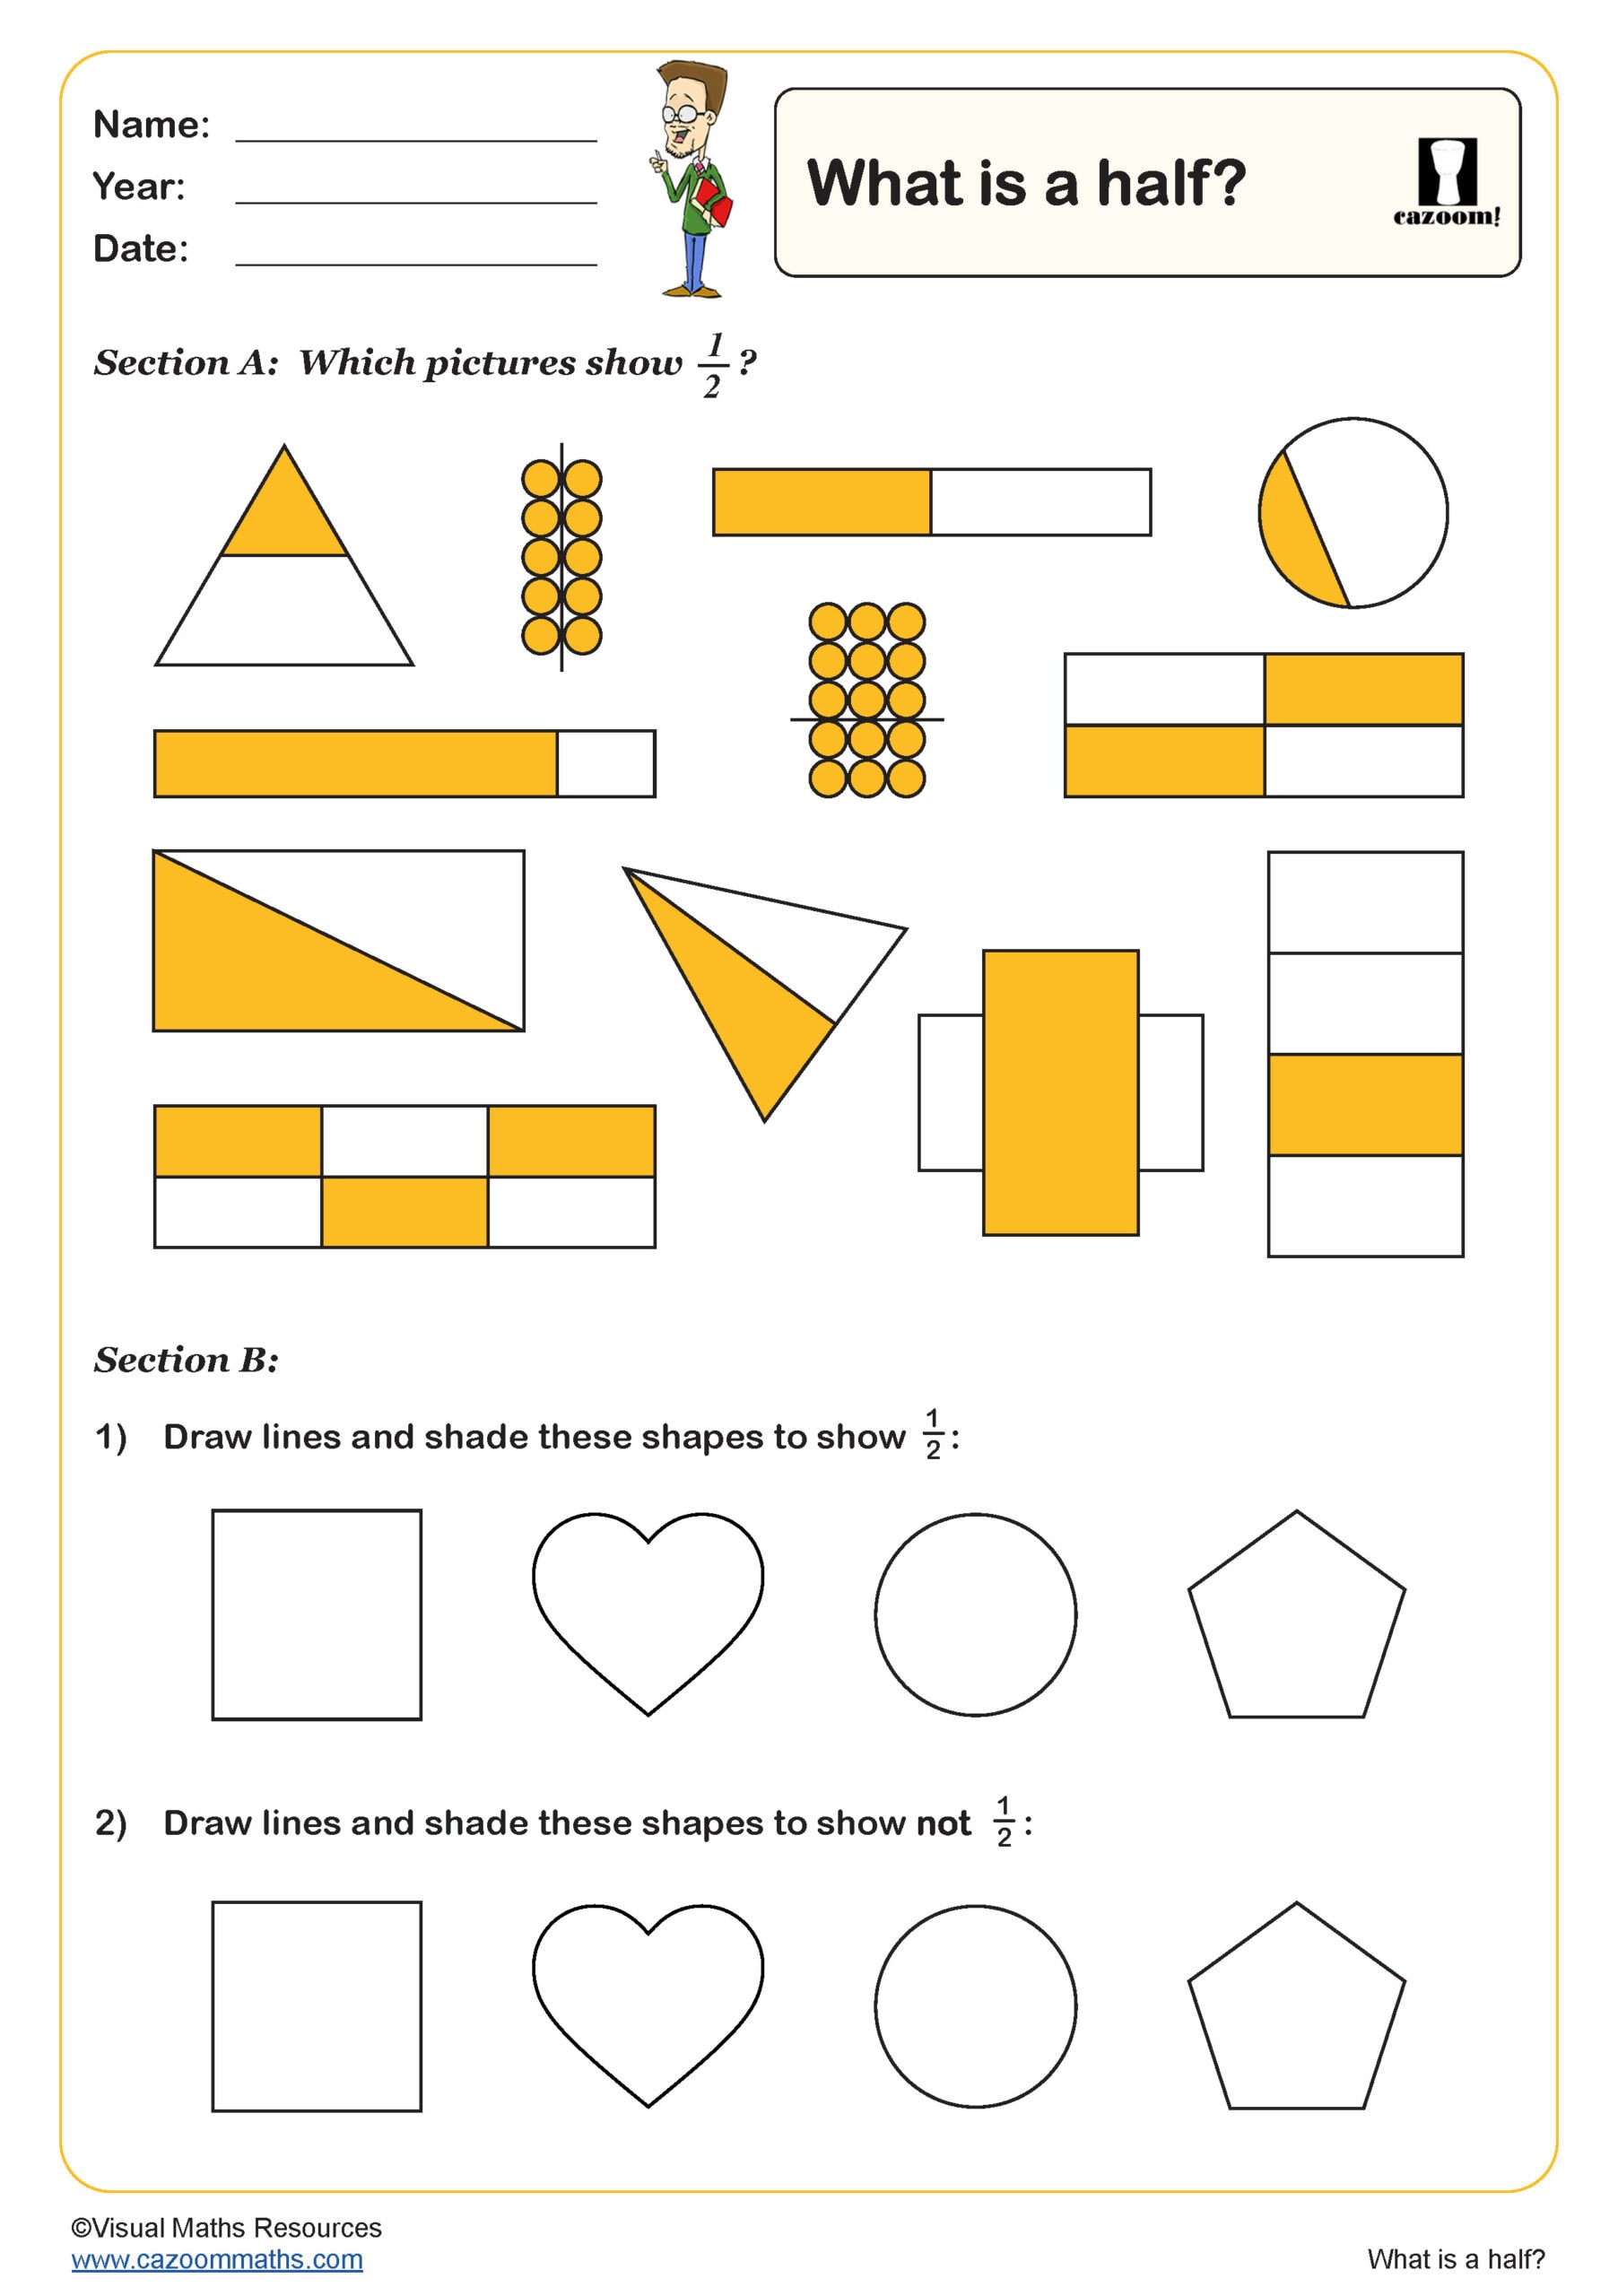
This resource provides two examples of straight line graphs in the from y=mx+c. It gives a diagram explaining the gradient a what lines with positive and negative gradients would look like.
All worksheets are created by the team of experienced teachers at Cazoom Maths.

RELATED TO What is y=mx+c ?
What is y=mx+c?
What is the resource?
This PDF tackles the fundamental equation behind drawing straight-line graphs: y = mx + c. It targets secondary school students.
Why is y = mx + c important?
More than just graphs, this equation underpins countless relationships:
- Science: Rates of change (speed, growth), often follow linear patterns.
- Finance: Costs rise and fall proportionally (think phone or energy tariffs).
- Data analysis: This equation helps find trends and predict future values.
Why is this resource helpful?
It demystifies this key equation through these strategies:
- Visual focus: Uses graphs to connect the equation parts to their features.
- 'm' means slope: Explains how to calculate steepness from a line.
- 'c' means intercept: Shows where the line cuts the y-axis.
- Practice examples: Builds confidence in applying the equation to graph analysis.
- Printable PDF: Handy for revision, class examples, or test reference.
This resource targets visual learners especially. It unlocks this equation's meaning, aiding future graph work and data handling across subjects.
Also, have a look at our wide range of worksheets that are specifically curated to help your students practice their skills related to linear function. These teaching resources and worksheets are in PDF format and can be downloaded easily.