Introduction to Graphing Linear Functions WORKSHEET
Distinguish between situations that can be modeled with linear functions and with exponential functions. a. Prove that linear functions grow by equal differences over equal intervals, and that exponential functions grow by equal factors over equal intervals. b. Recognize situations in which one quantity changes at a constant rate per unit interval relative to another. c. Recognize situations in which a quantity grows or decays by a constant percent rate per unit interval relative to another.
Introduction to Graphing Linear Functions WORKSHEET DESCRIPTION
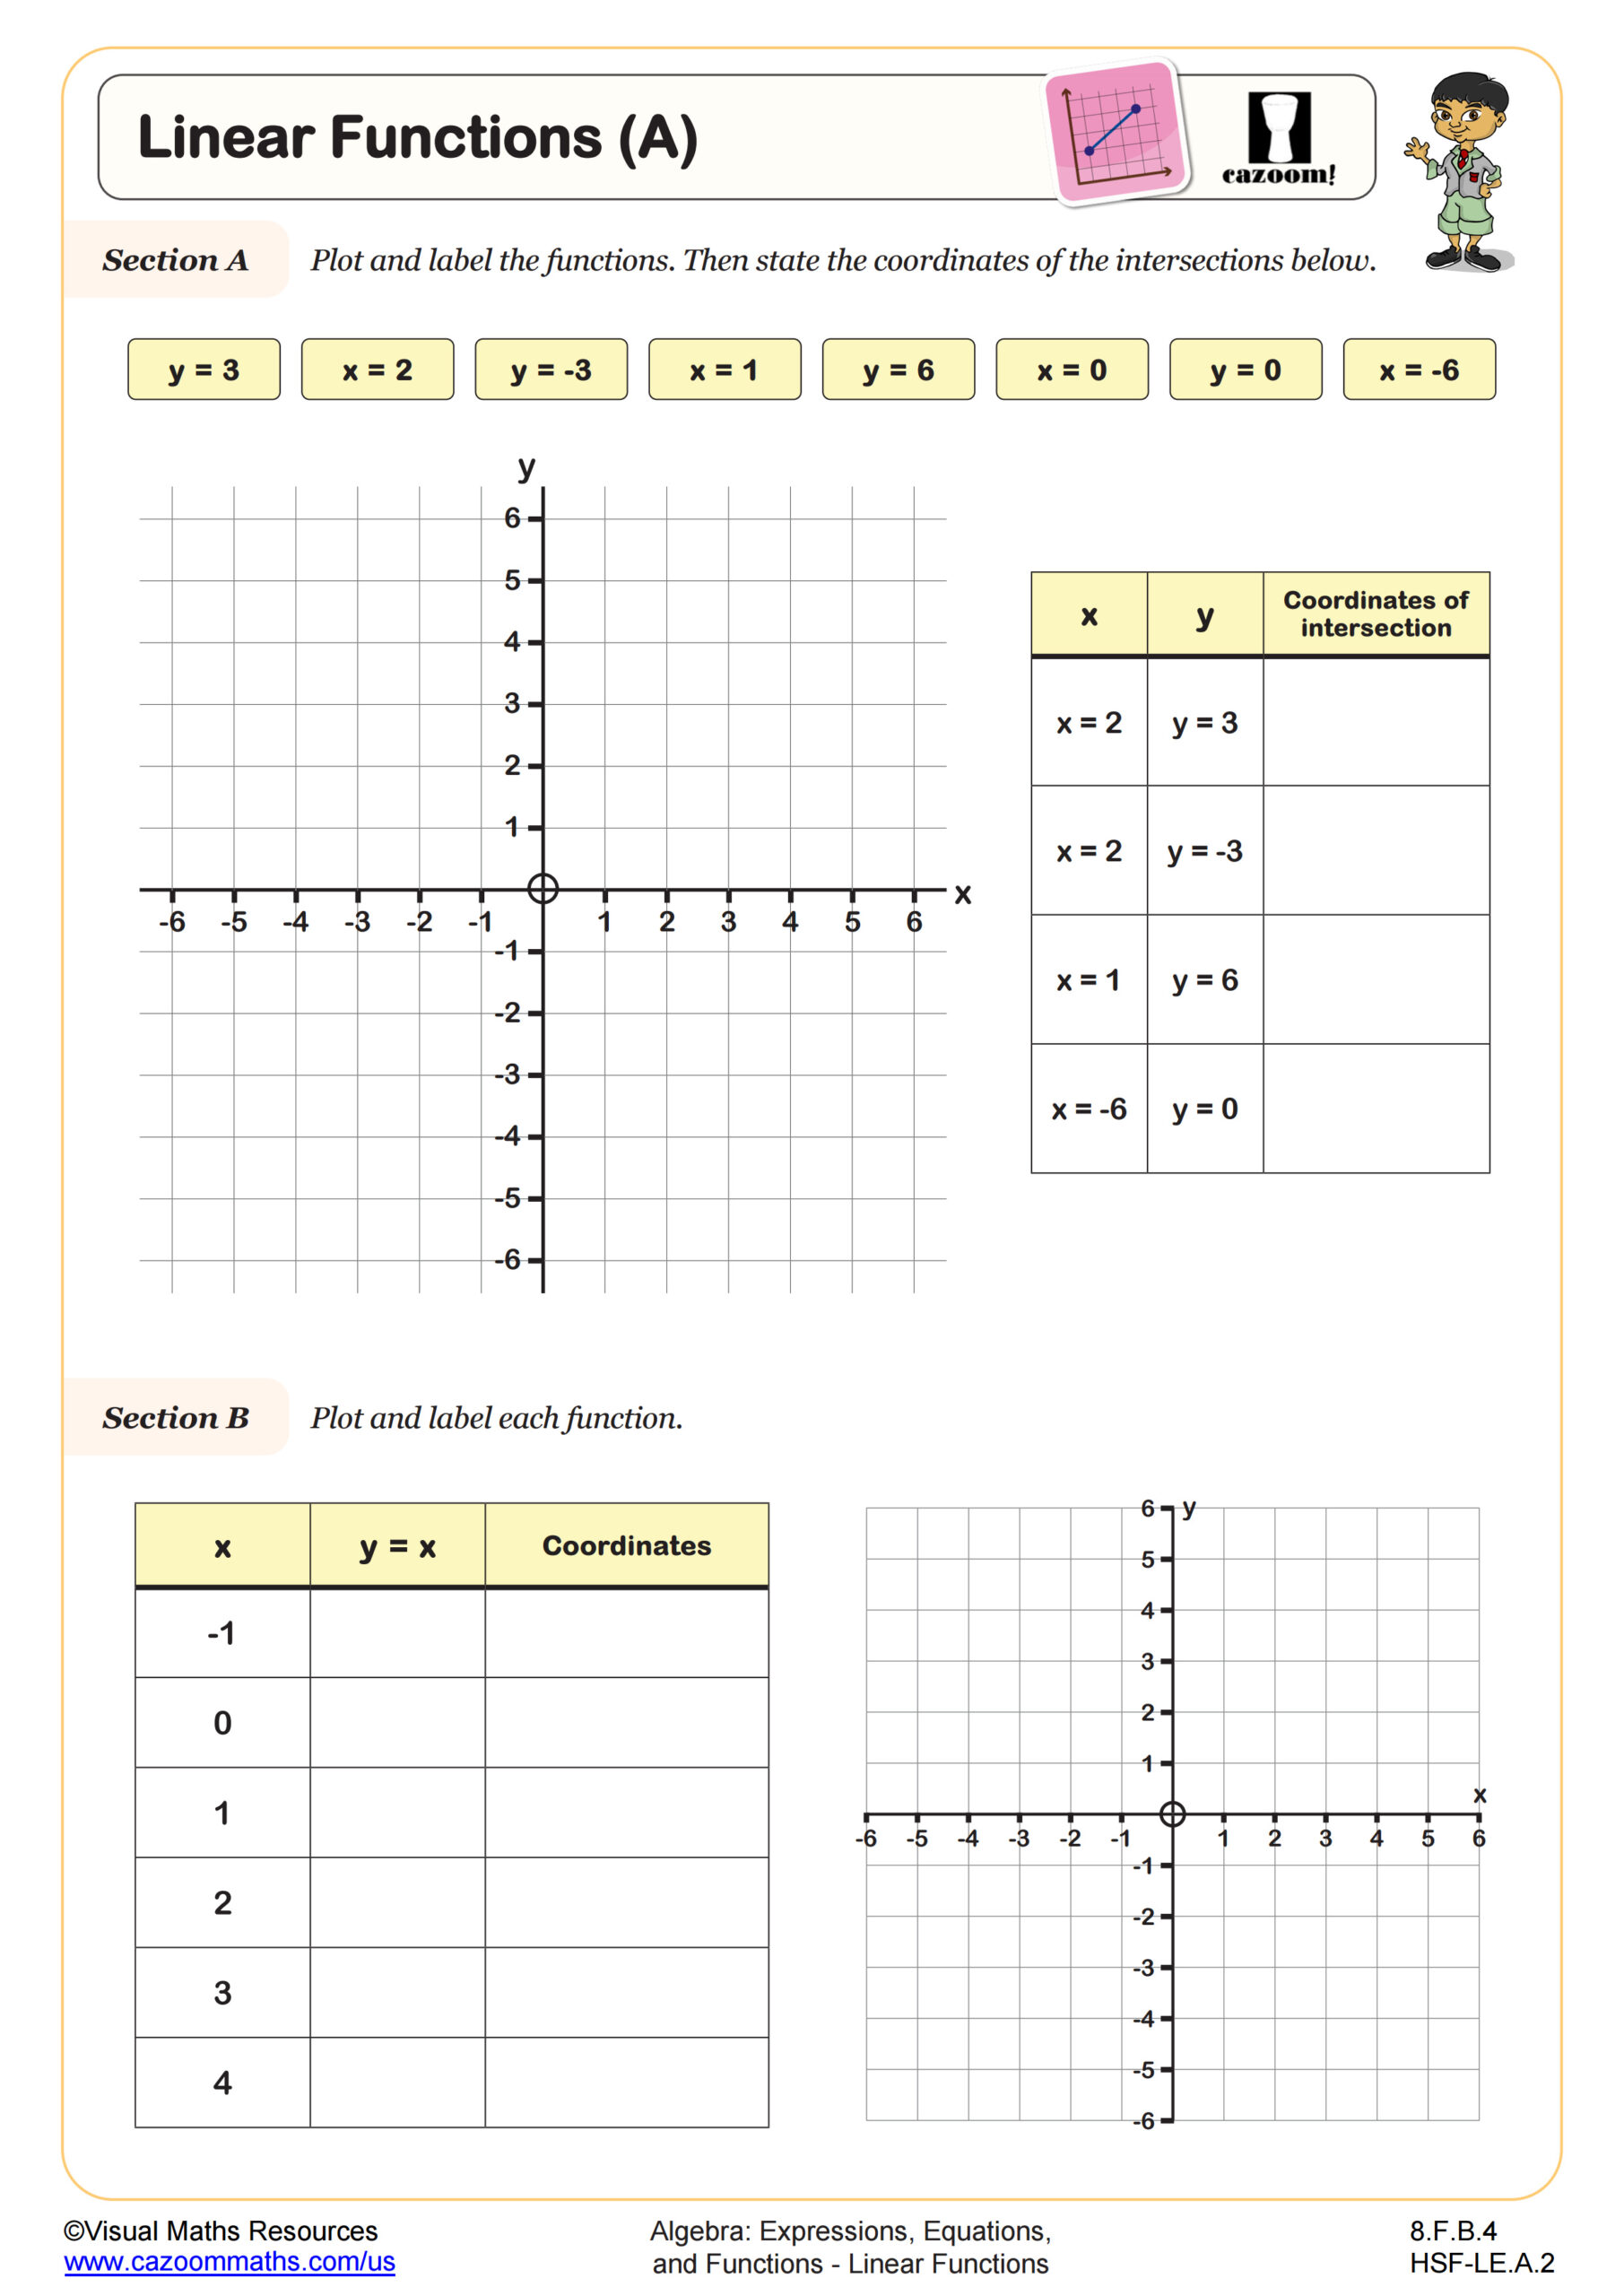
Students will learn how to draw straight line graphs in the first quadrant using function machines and tables of values to generate coordinate pairs. Ensure students are equipped with a ruler and pencil before they begin drawing their lines.
In section A, students will plot the graphs of y = x + 1, y = x + 3 and y = 2x. Learners will be provided with a function machine, a table of values for x between 0 and 3, and and three separate coordinate grids.
Next, in section B , students will plot the graphs of equations such as y = 2x + 1. The scaffolding provided decreases as the section progresses.
However, a function machine, table of values, and separate coordinate grids are provided for each equation.
All straight lines have positive integer slopes and integer y intercepts.
All worksheets are created by the team of experienced teachers at Cazoom Math.