Averages from Frequency Tables WORKSHEET
Suitable for Grades: 6th Grade, Algebra I
CCSS: 6.SP.B.5, HSS.ID.A.2
CCSS Description: Summarize numerical data sets in relation to their context, such as by: a. Reporting the number of observations. b. Describing the nature of the attribute under investigation, including how it was measured and its units of measurement. c. Giving quantitative measures of center (median and/or mean) and variability (interquartile range and/or mean absolute deviation), as well as describing any overall pattern and any striking deviations from the overall pattern with reference to the context in which the data were gathered. d. Relating the choice of measures of center and variability to the shape of the data distribution and the context in which the data were gathered.
Use statistics appropriate to the shape of the data distribution to compare center (median, mean) and spread (interquartile range, standard deviation) of two or more different data sets.
Use statistics appropriate to the shape of the data distribution to compare center (median, mean) and spread (interquartile range, standard deviation) of two or more different data sets.
Averages from Frequency Tables WORKSHEET DESCRIPTION
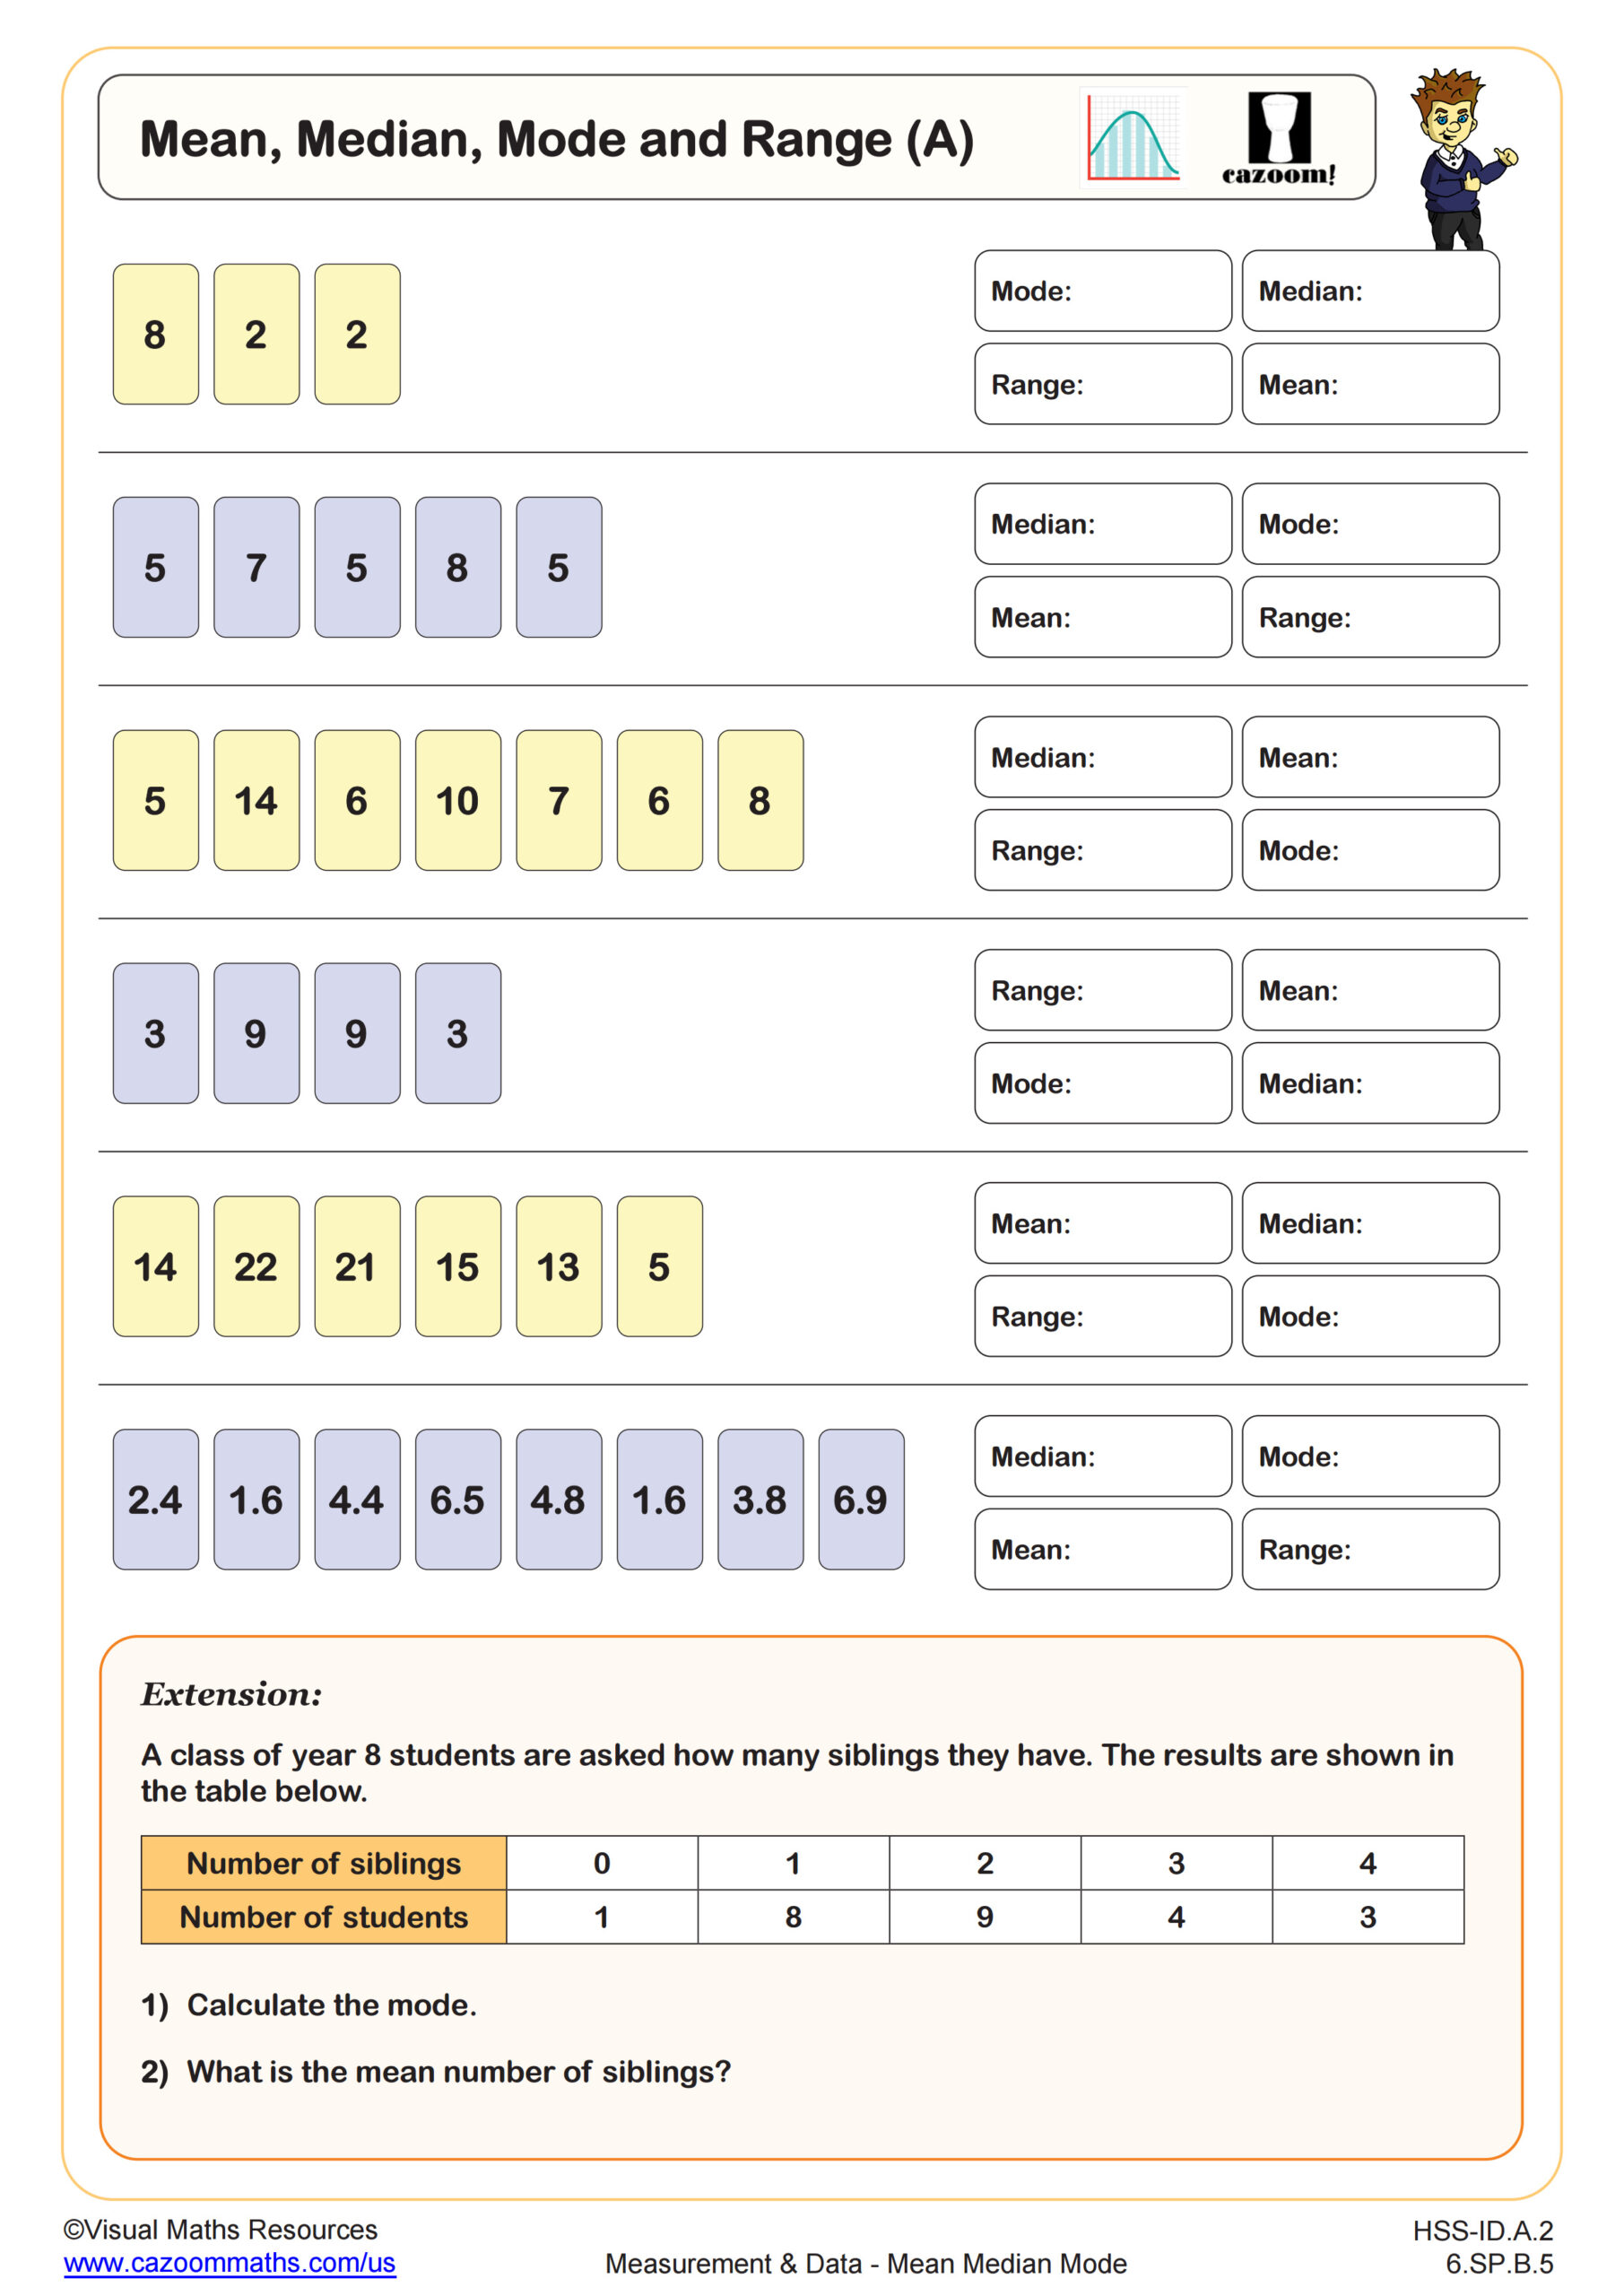
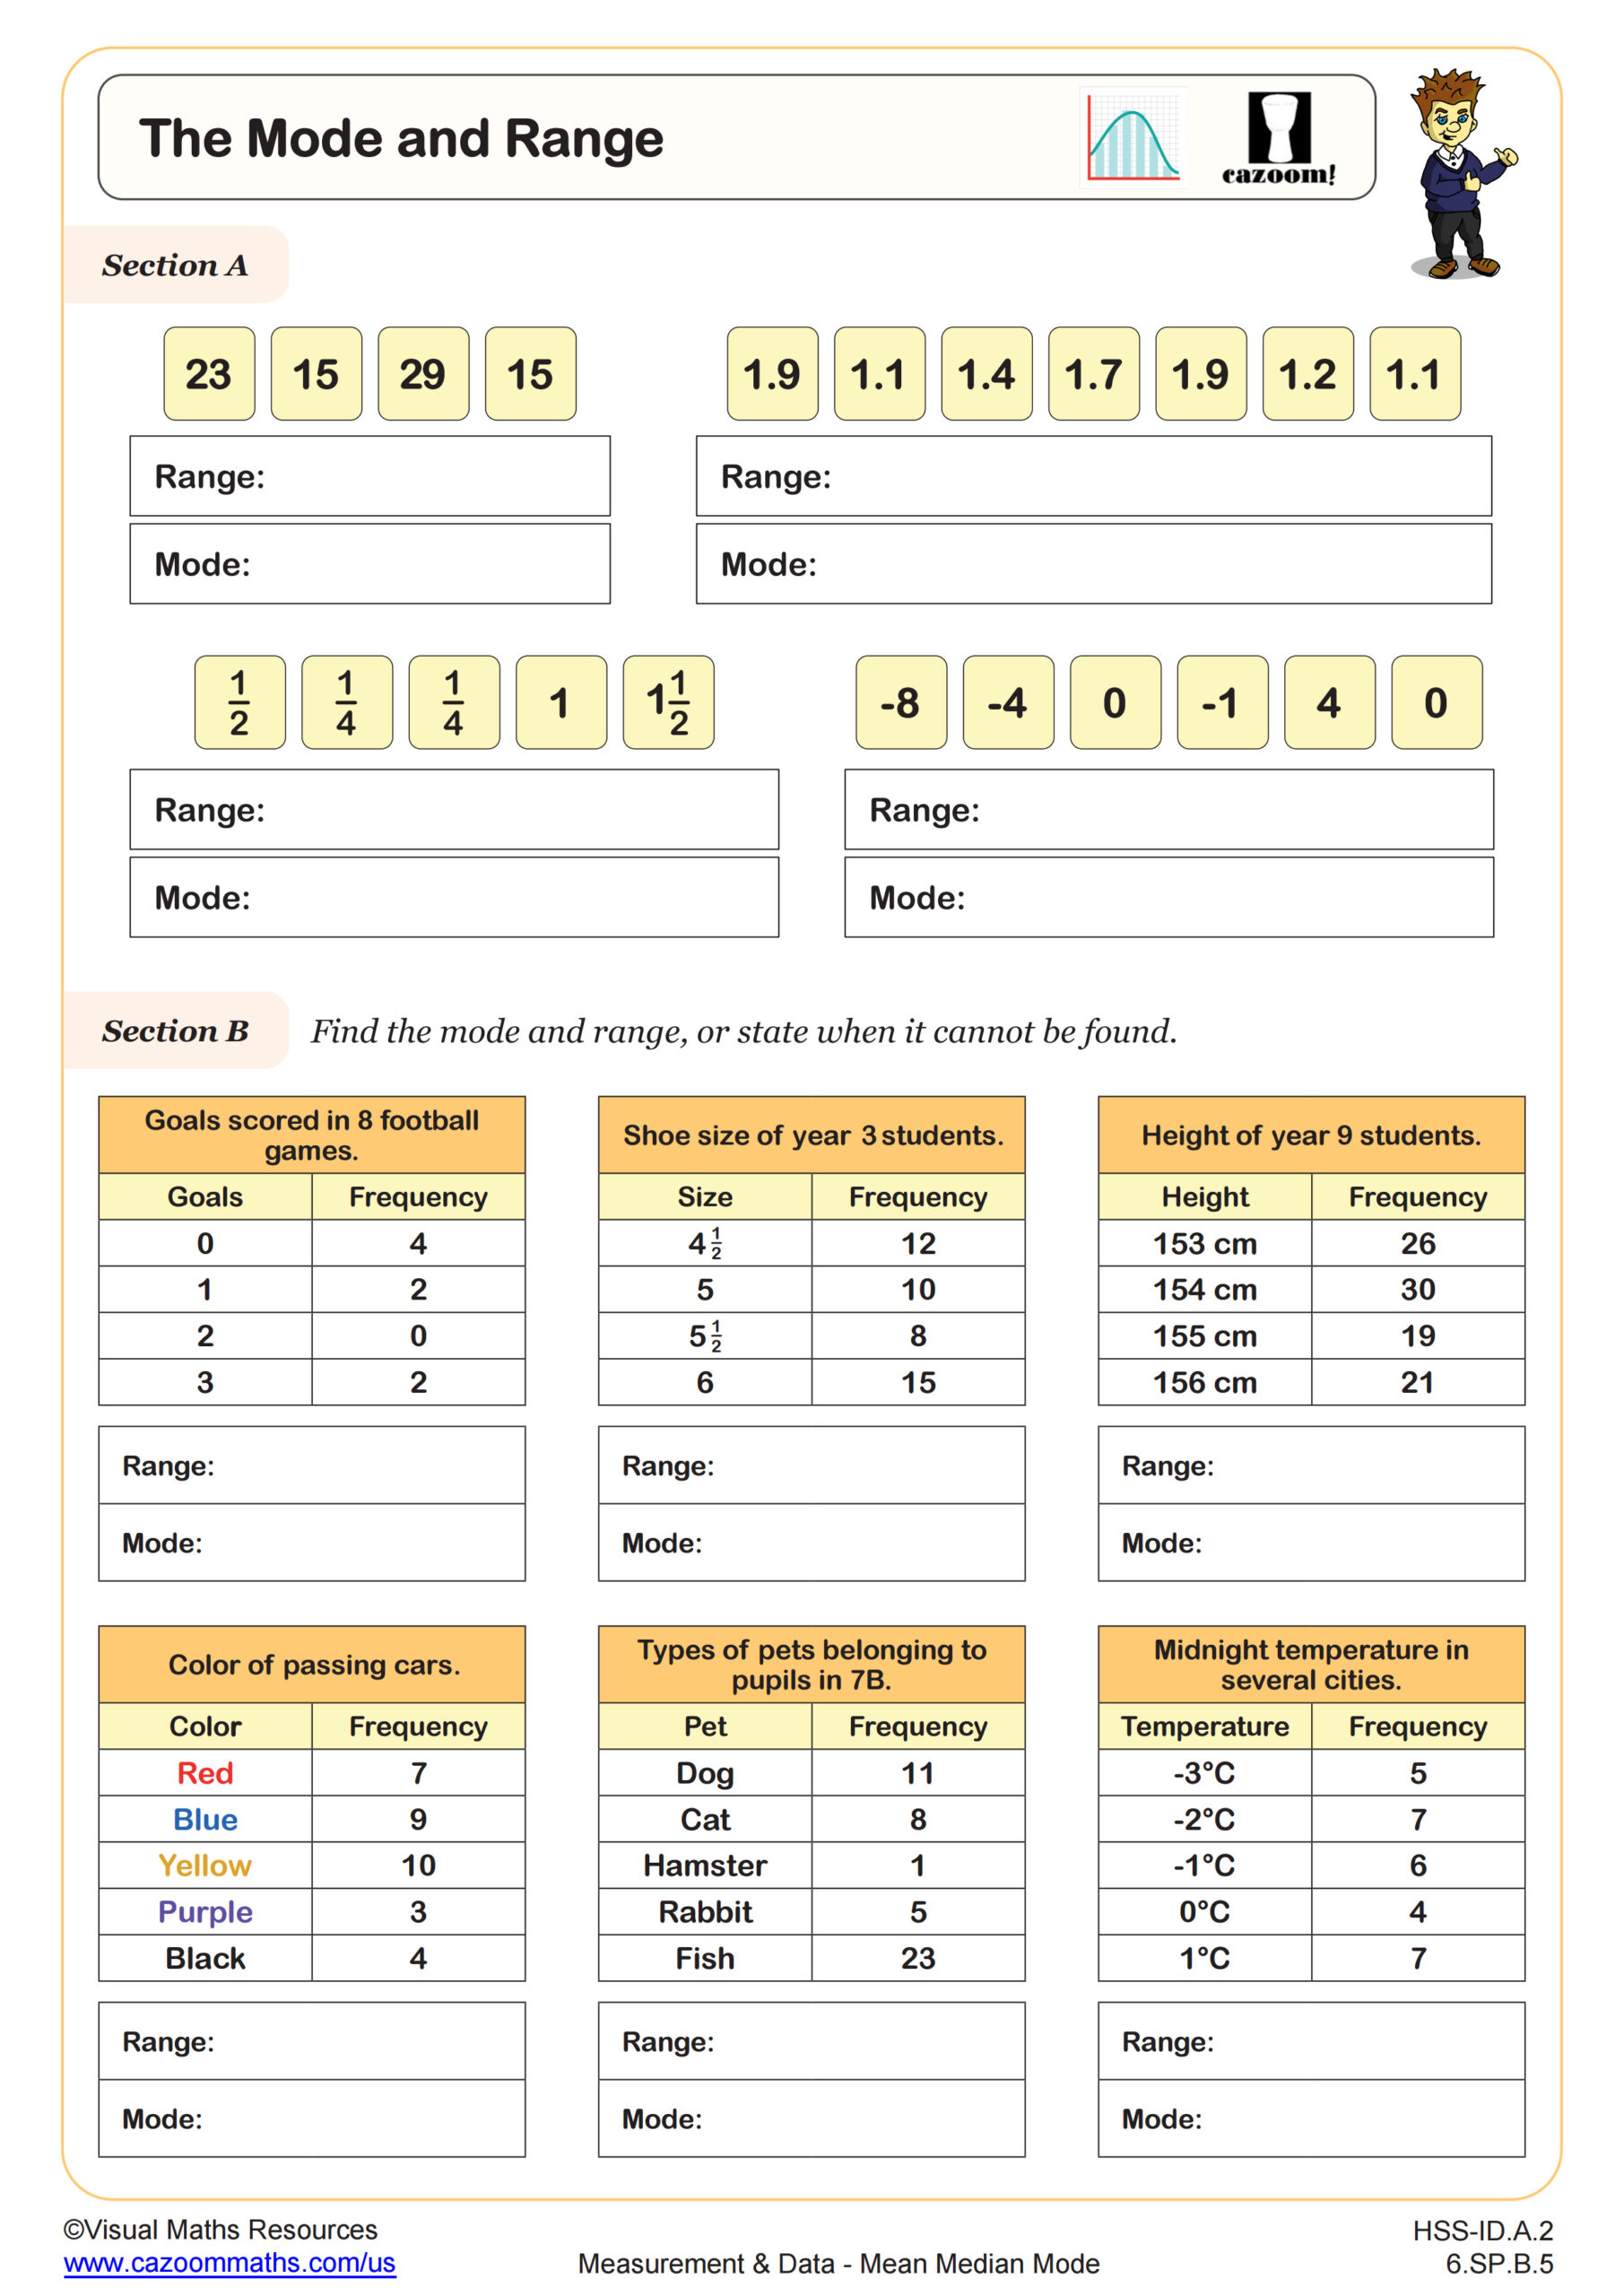
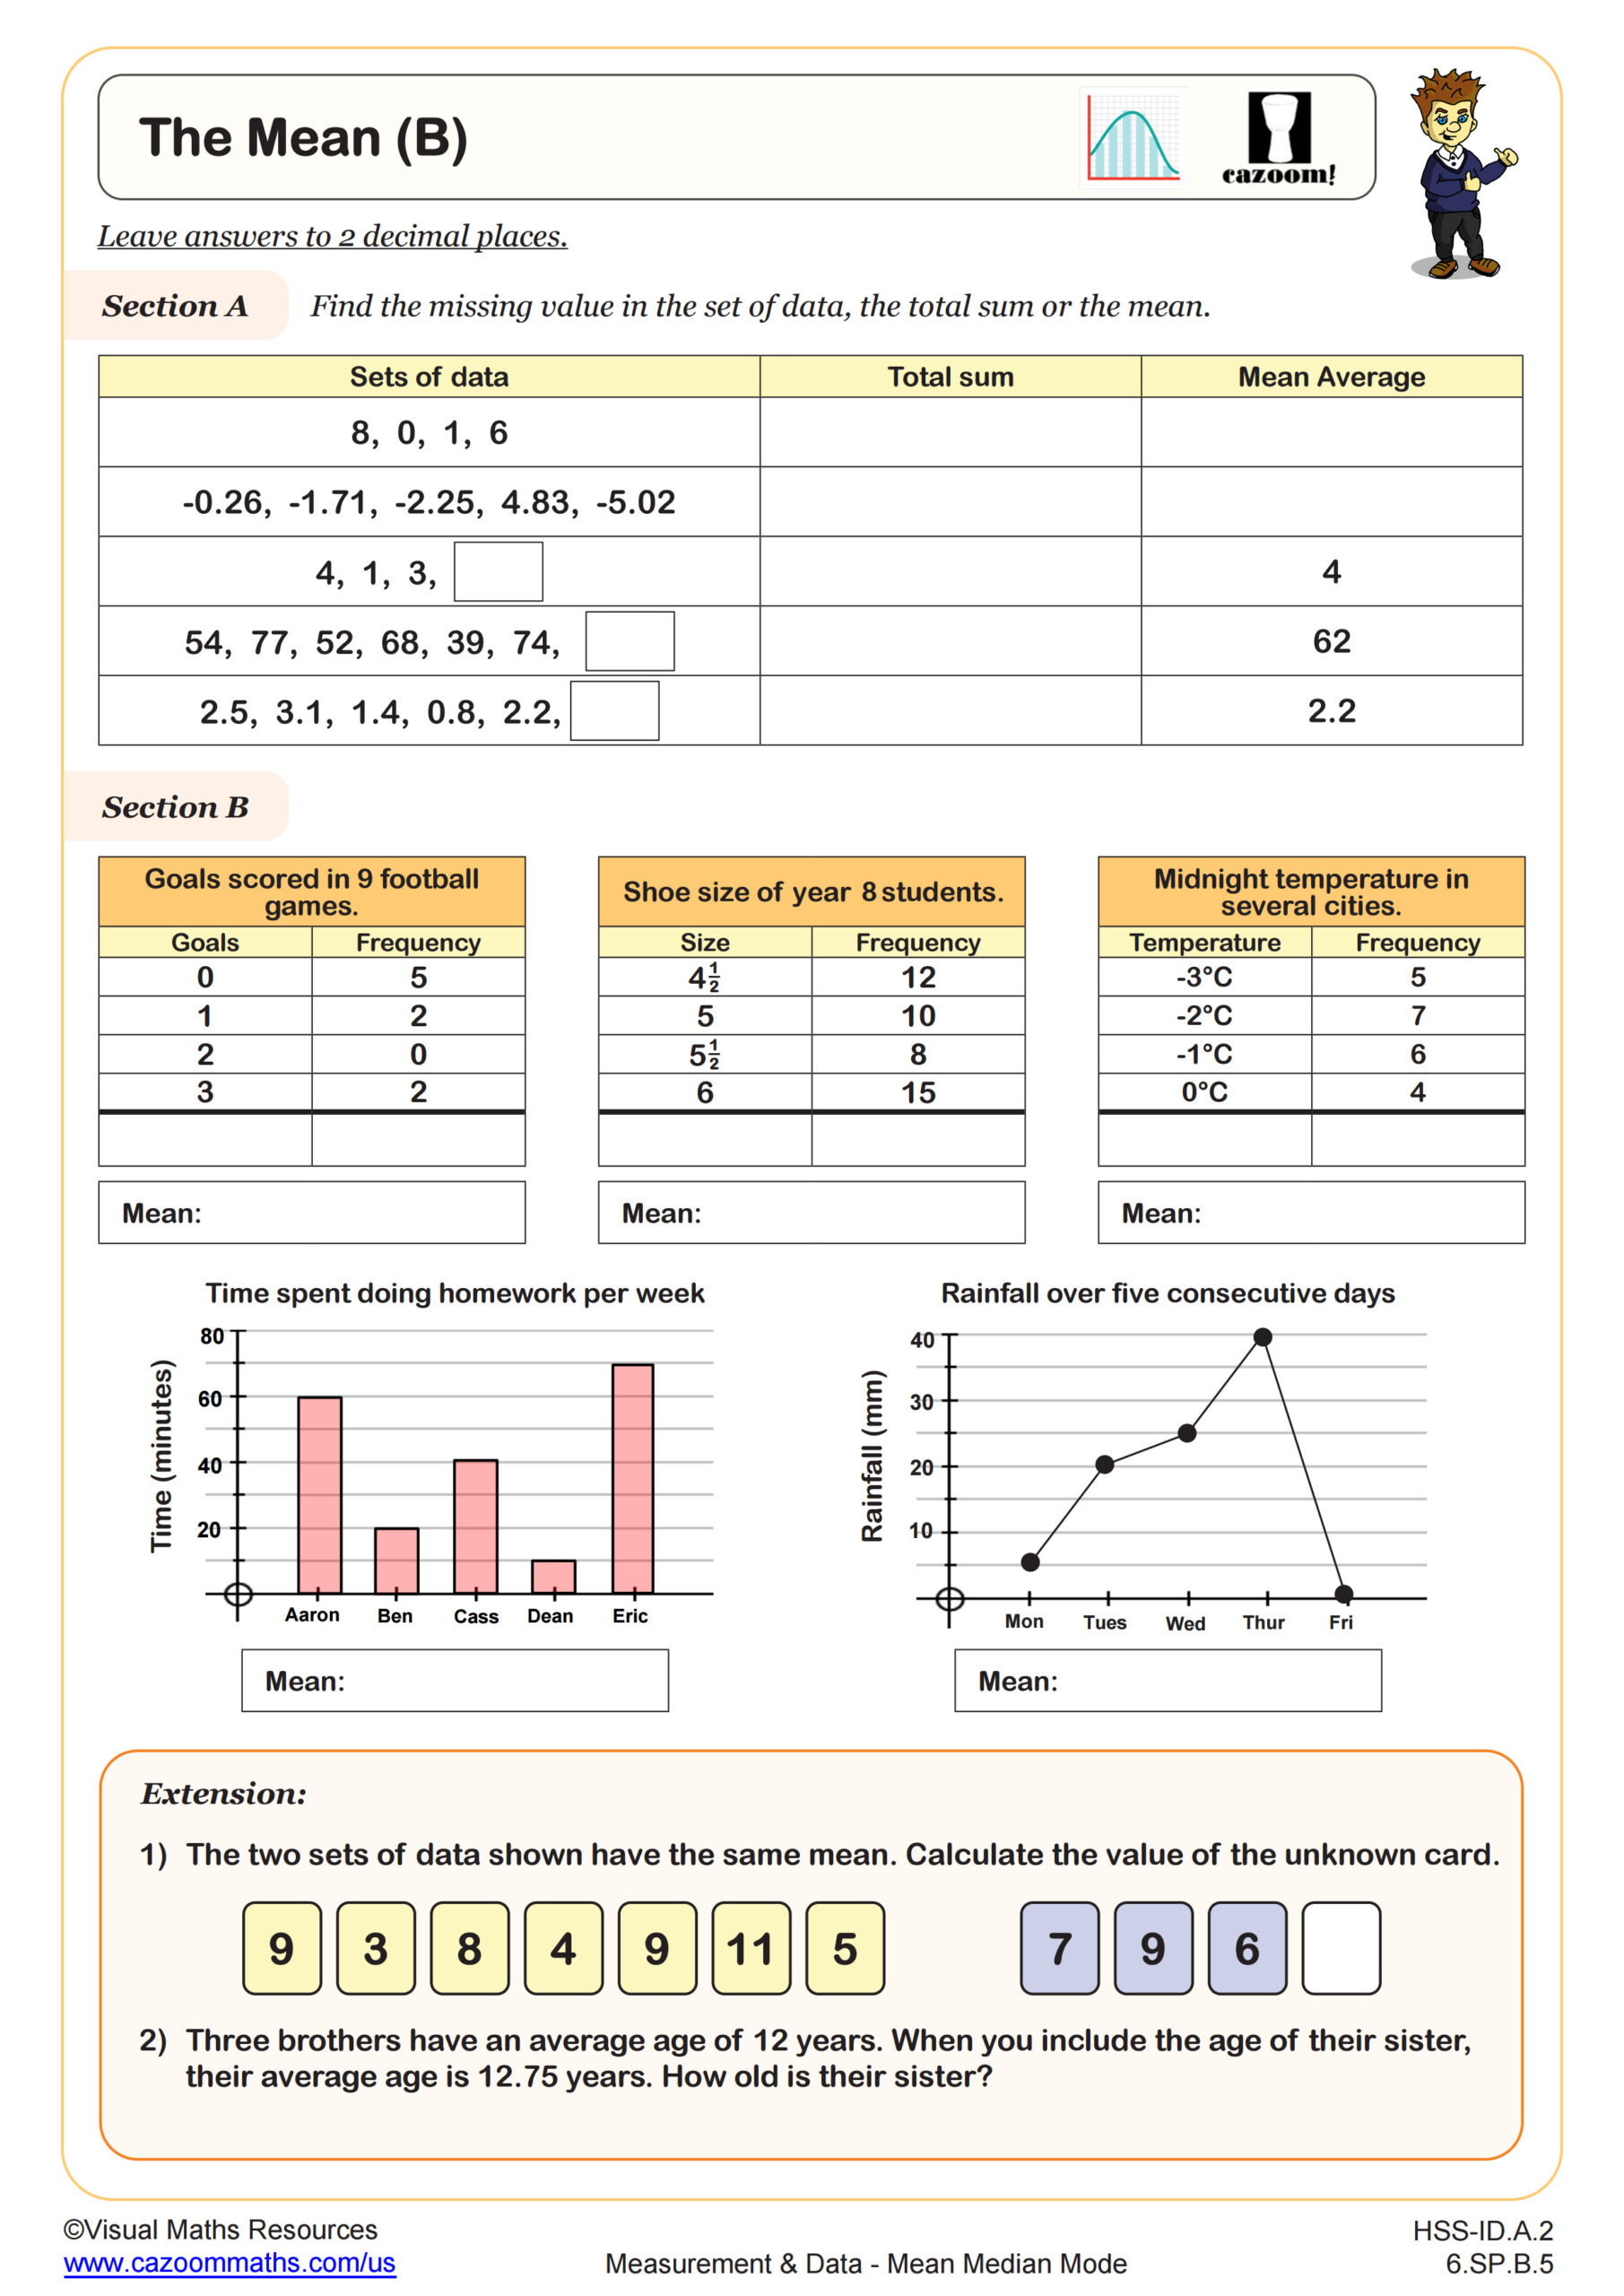
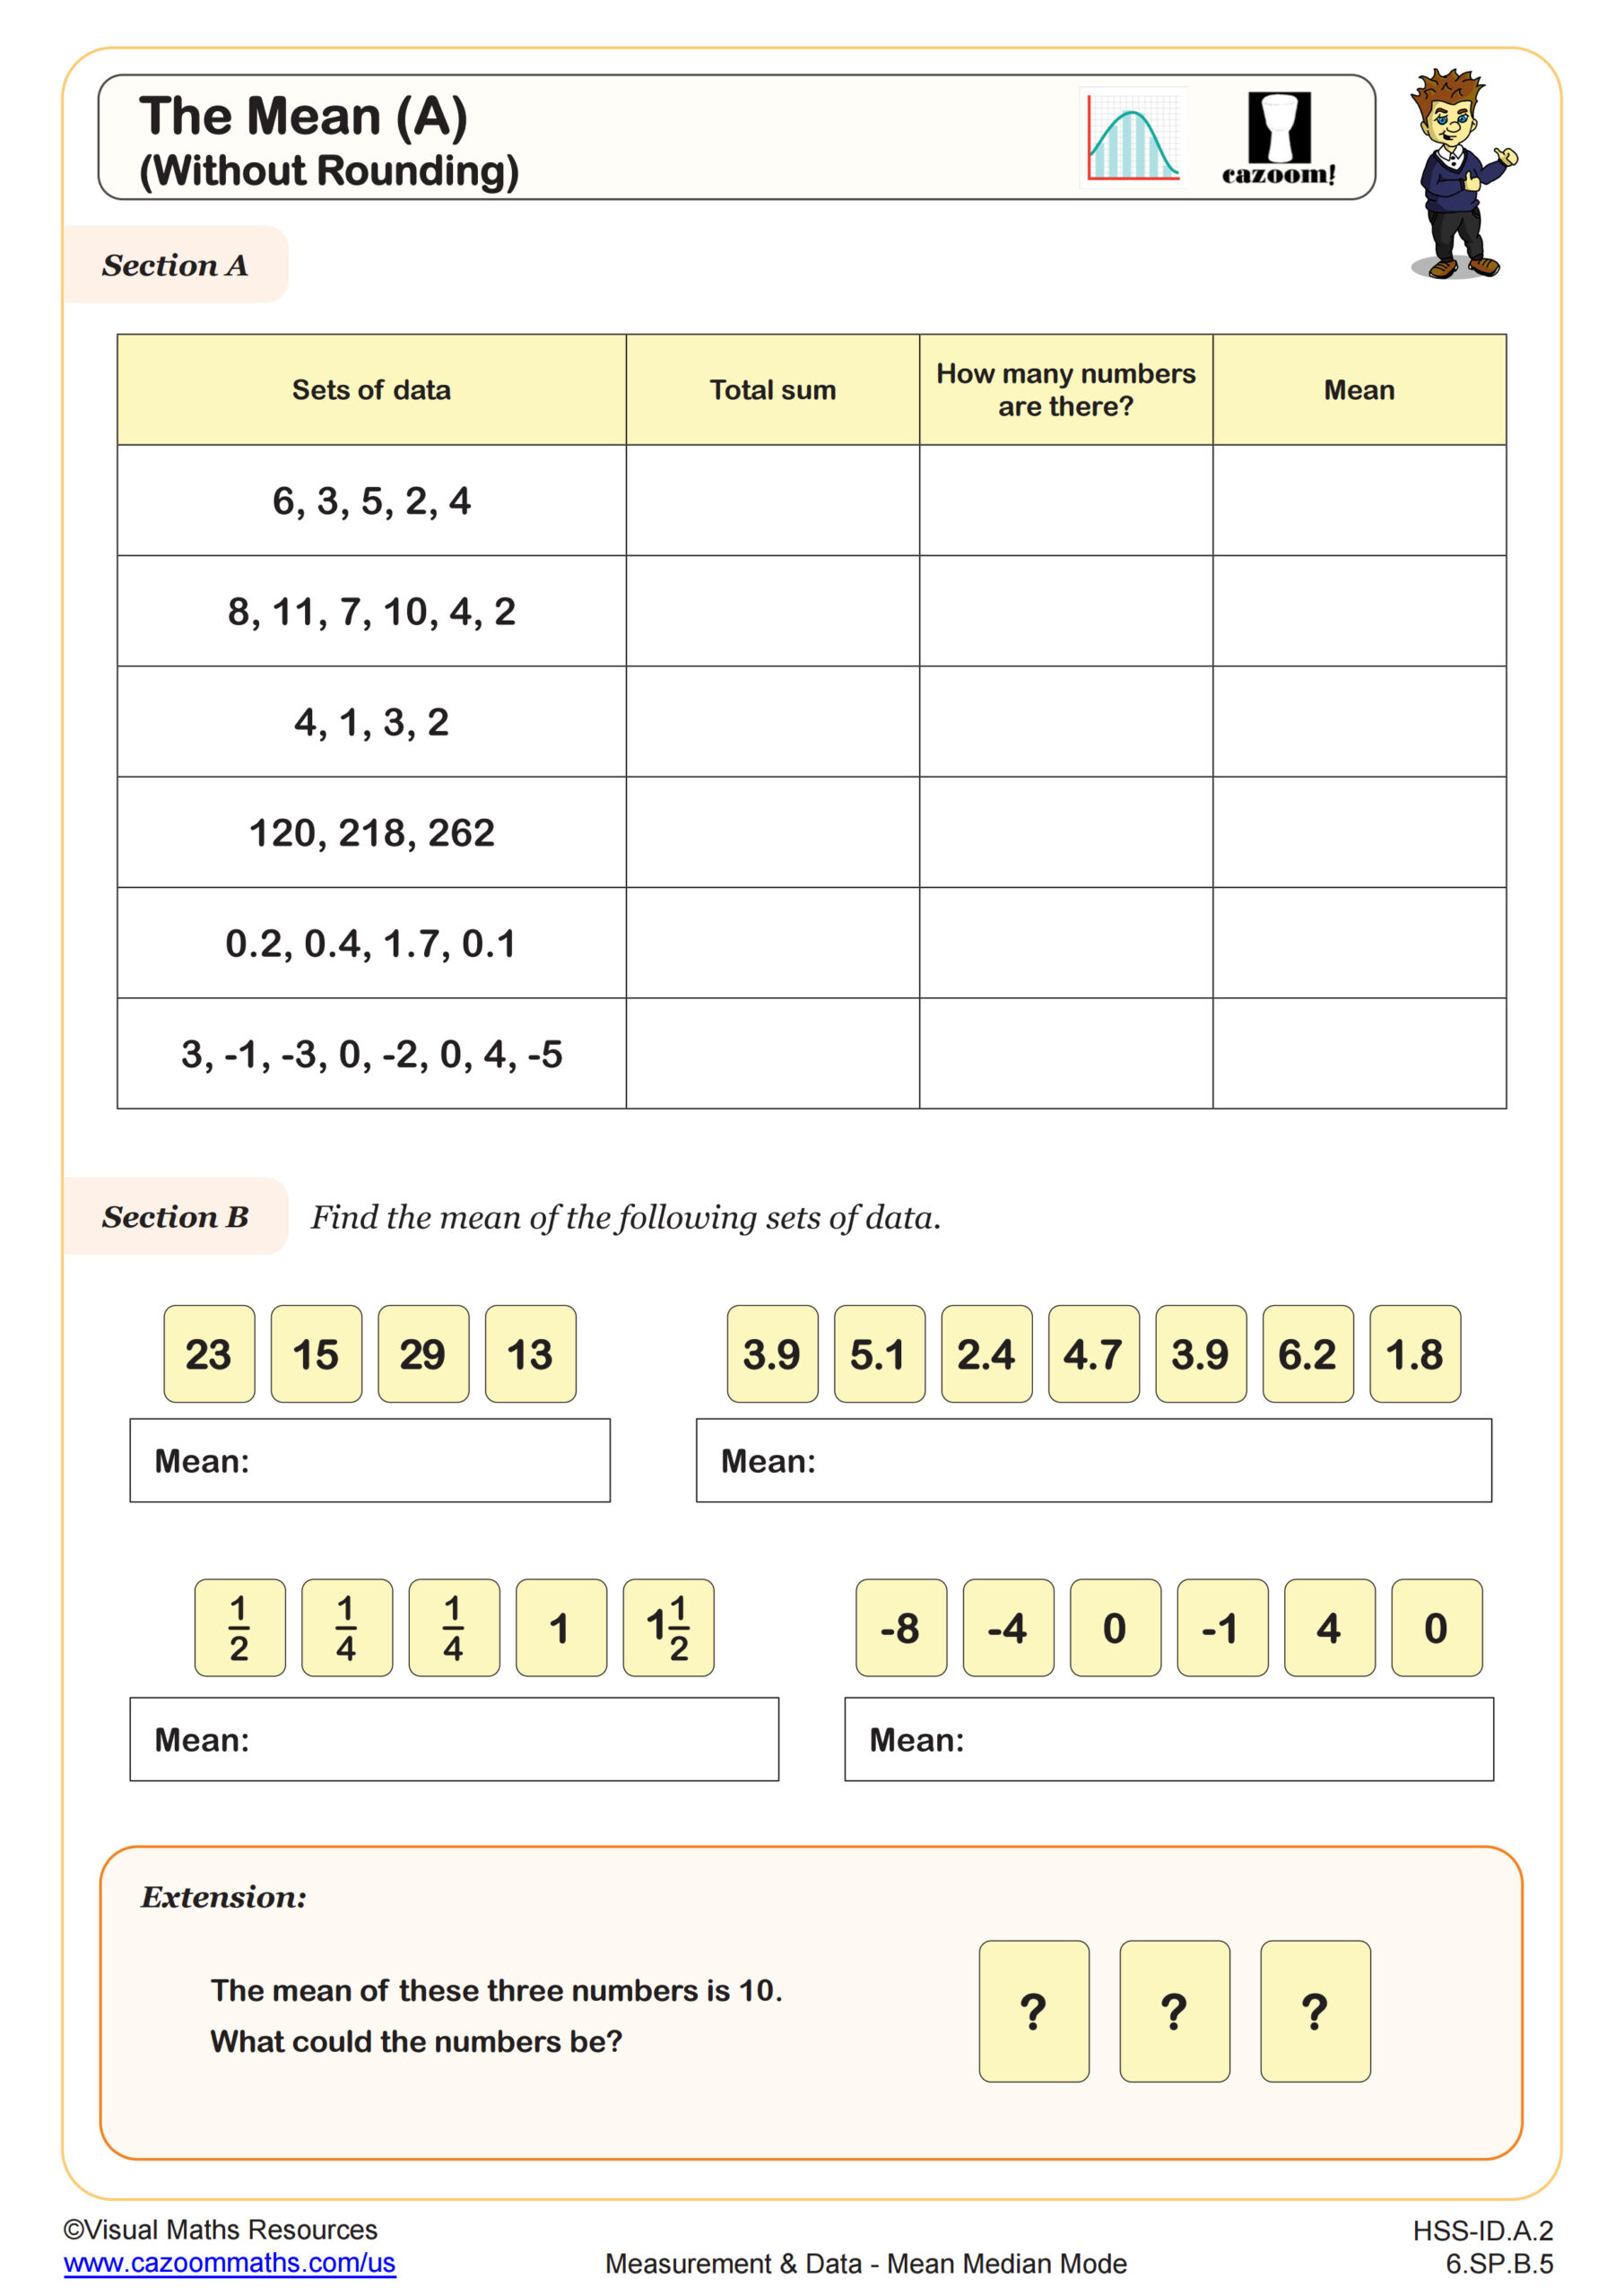
This worksheet is designed to provide practice of finding the different types of central tendency from a discrete data frequency table. Section A requires learners to find the mode and median; section B requires the mean and range. Section C them asks for a missing value in a frequency table when the mean is given and questions the reliability of the different types of average.
All worksheets are created by the team of experienced teachers at Cazoom Math.

RELATED TO Averages from Frequency Tables WORKSHEET
Frequently Asked Questions
This averages from frequency tables worksheet is designed for students in 6th Grade and Algebra I and aligns with Common Core State Standards.