Back to:
Bar Graphs WORKSHEET
Suitable for Grades: 2nd Grade, 3rd Grade
CCSS: 2.MD.D.10, 3.MD.B.3
CCSS Description: Draw a picture graph and a bar graph (with single-unit scale) to represent a data set with up to four categories; solve simple put-together, take-apart, and compare problems using information presented in a bar graph.
Draw a scaled picture graph and a scaled bar graph to represent a data set with several categories. Solve one- nd two-step “how many more” and “how many less” problems using information presented in scaled bar graphs. For example, draw a bar graph in which each square in the bar graph might represent 5 pets.
Draw a scaled picture graph and a scaled bar graph to represent a data set with several categories. Solve one- nd two-step “how many more” and “how many less” problems using information presented in scaled bar graphs. For example, draw a bar graph in which each square in the bar graph might represent 5 pets.
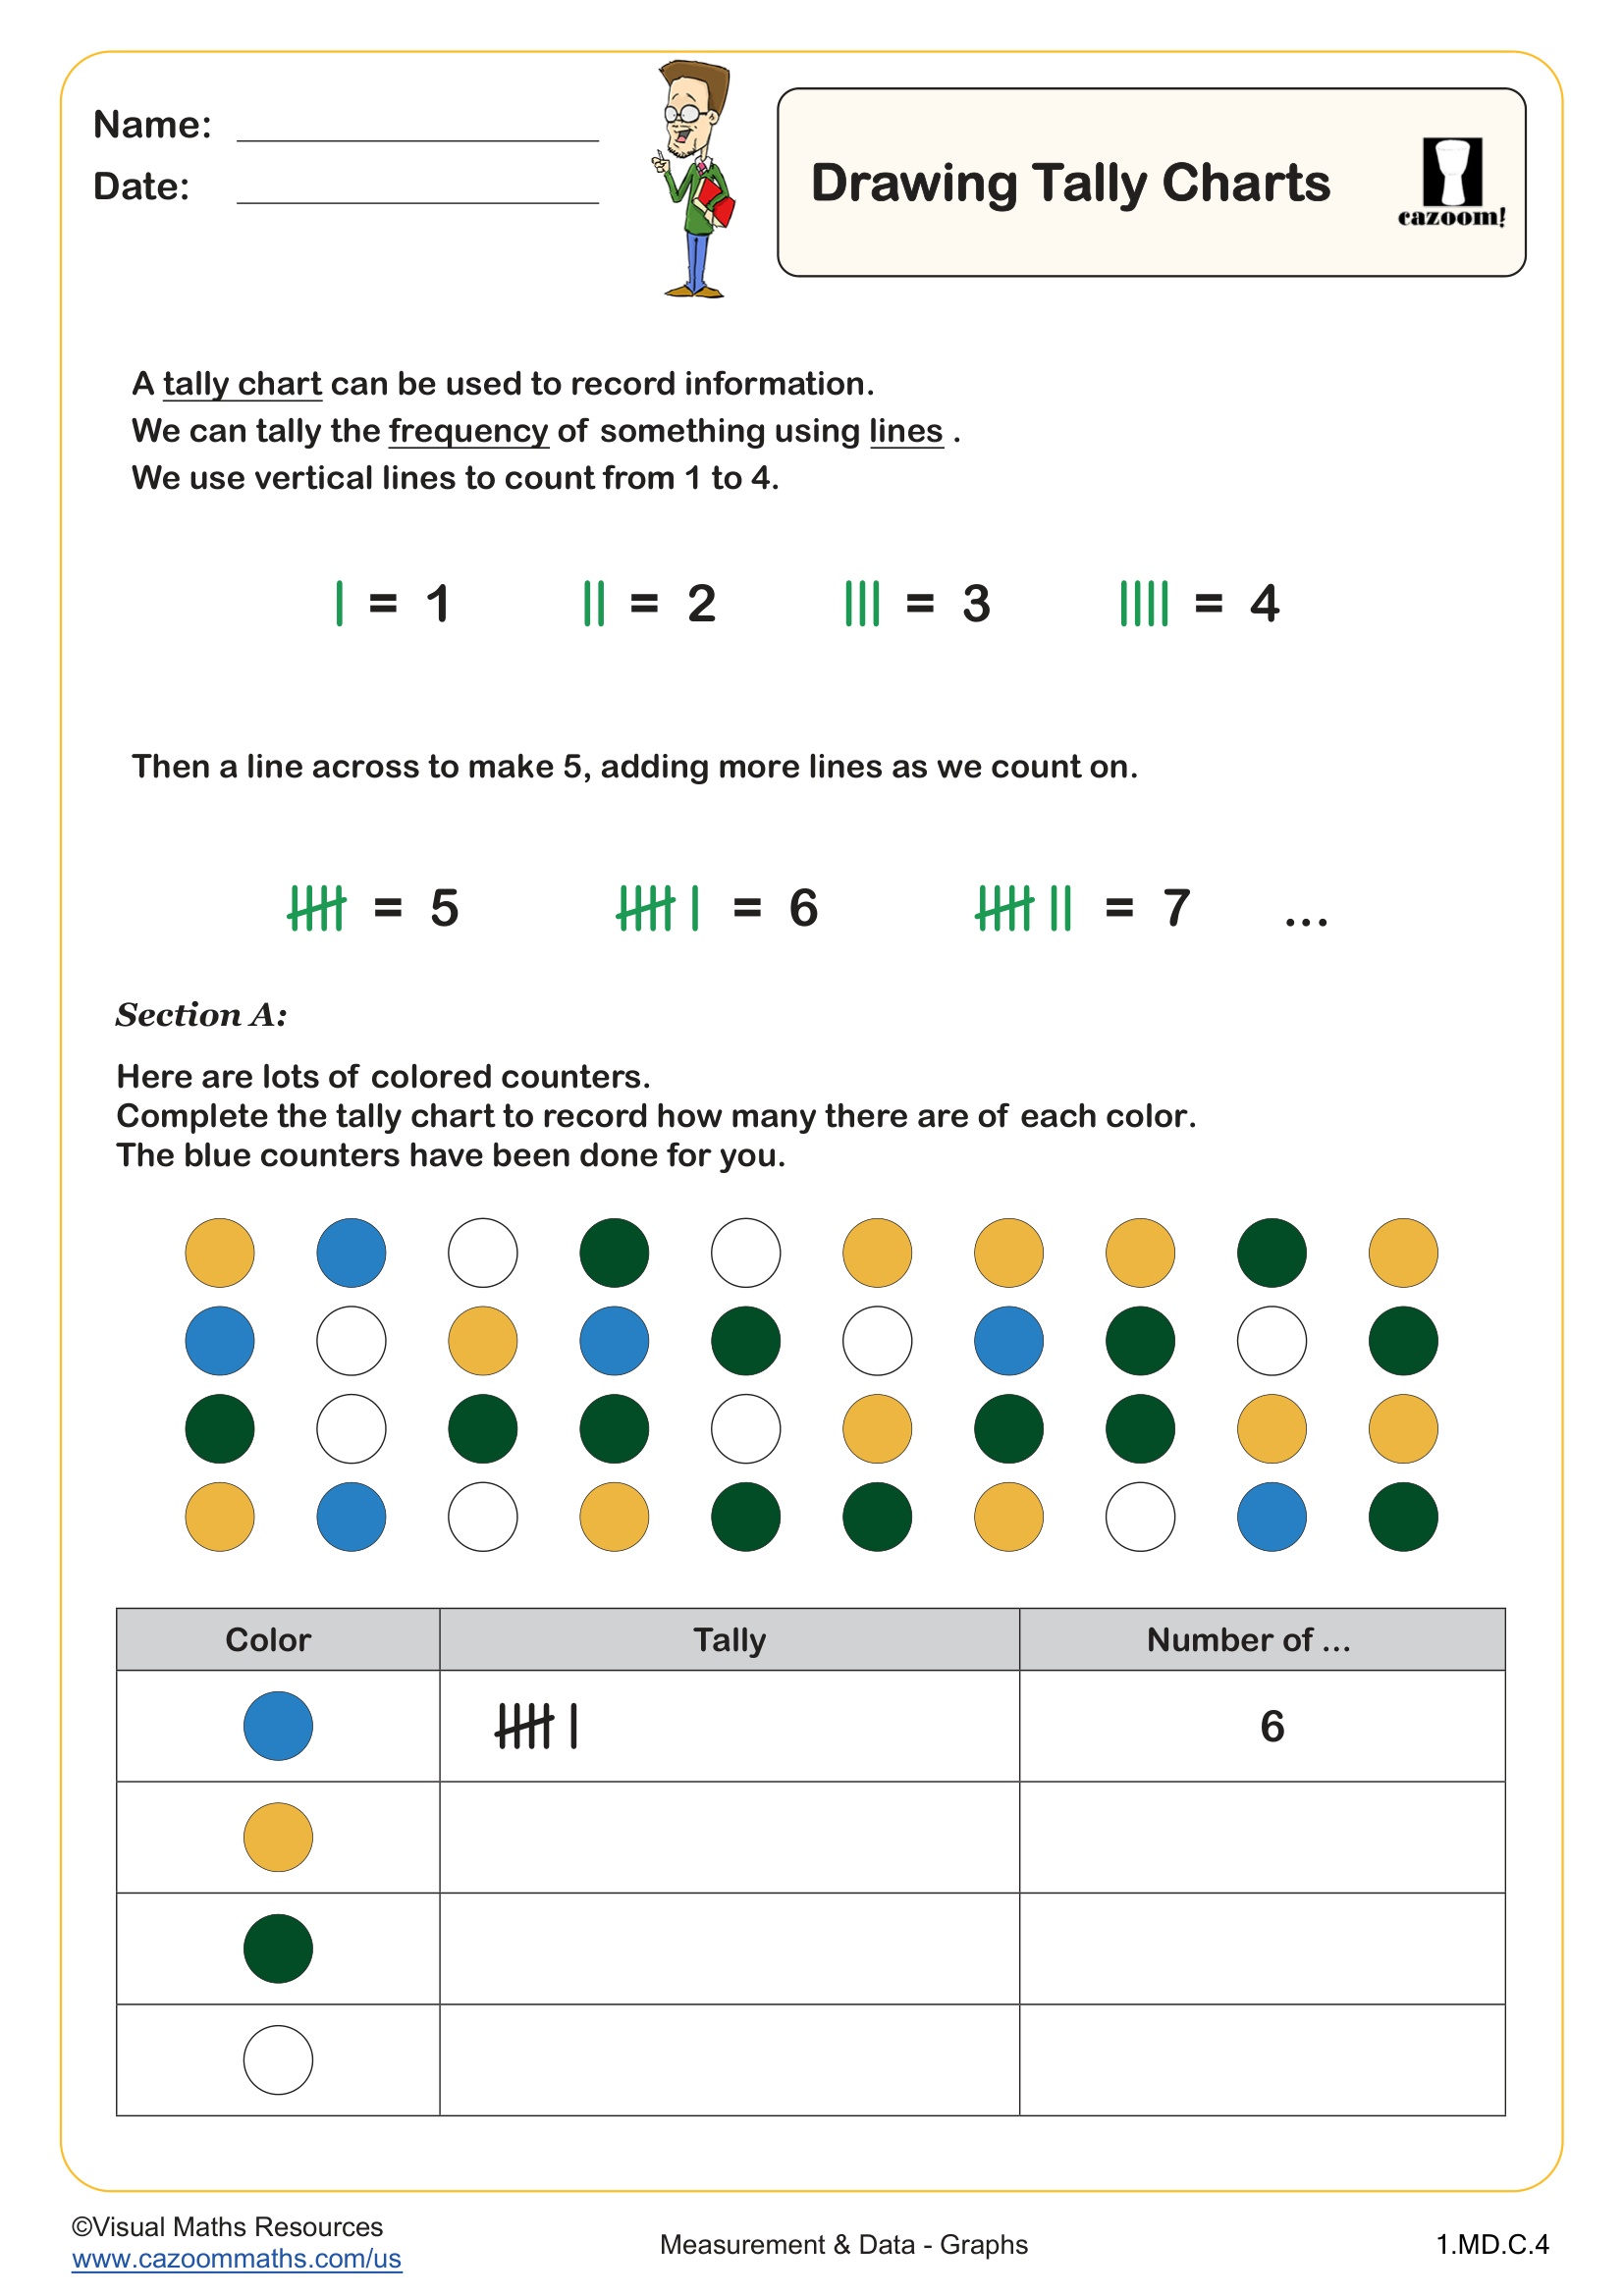
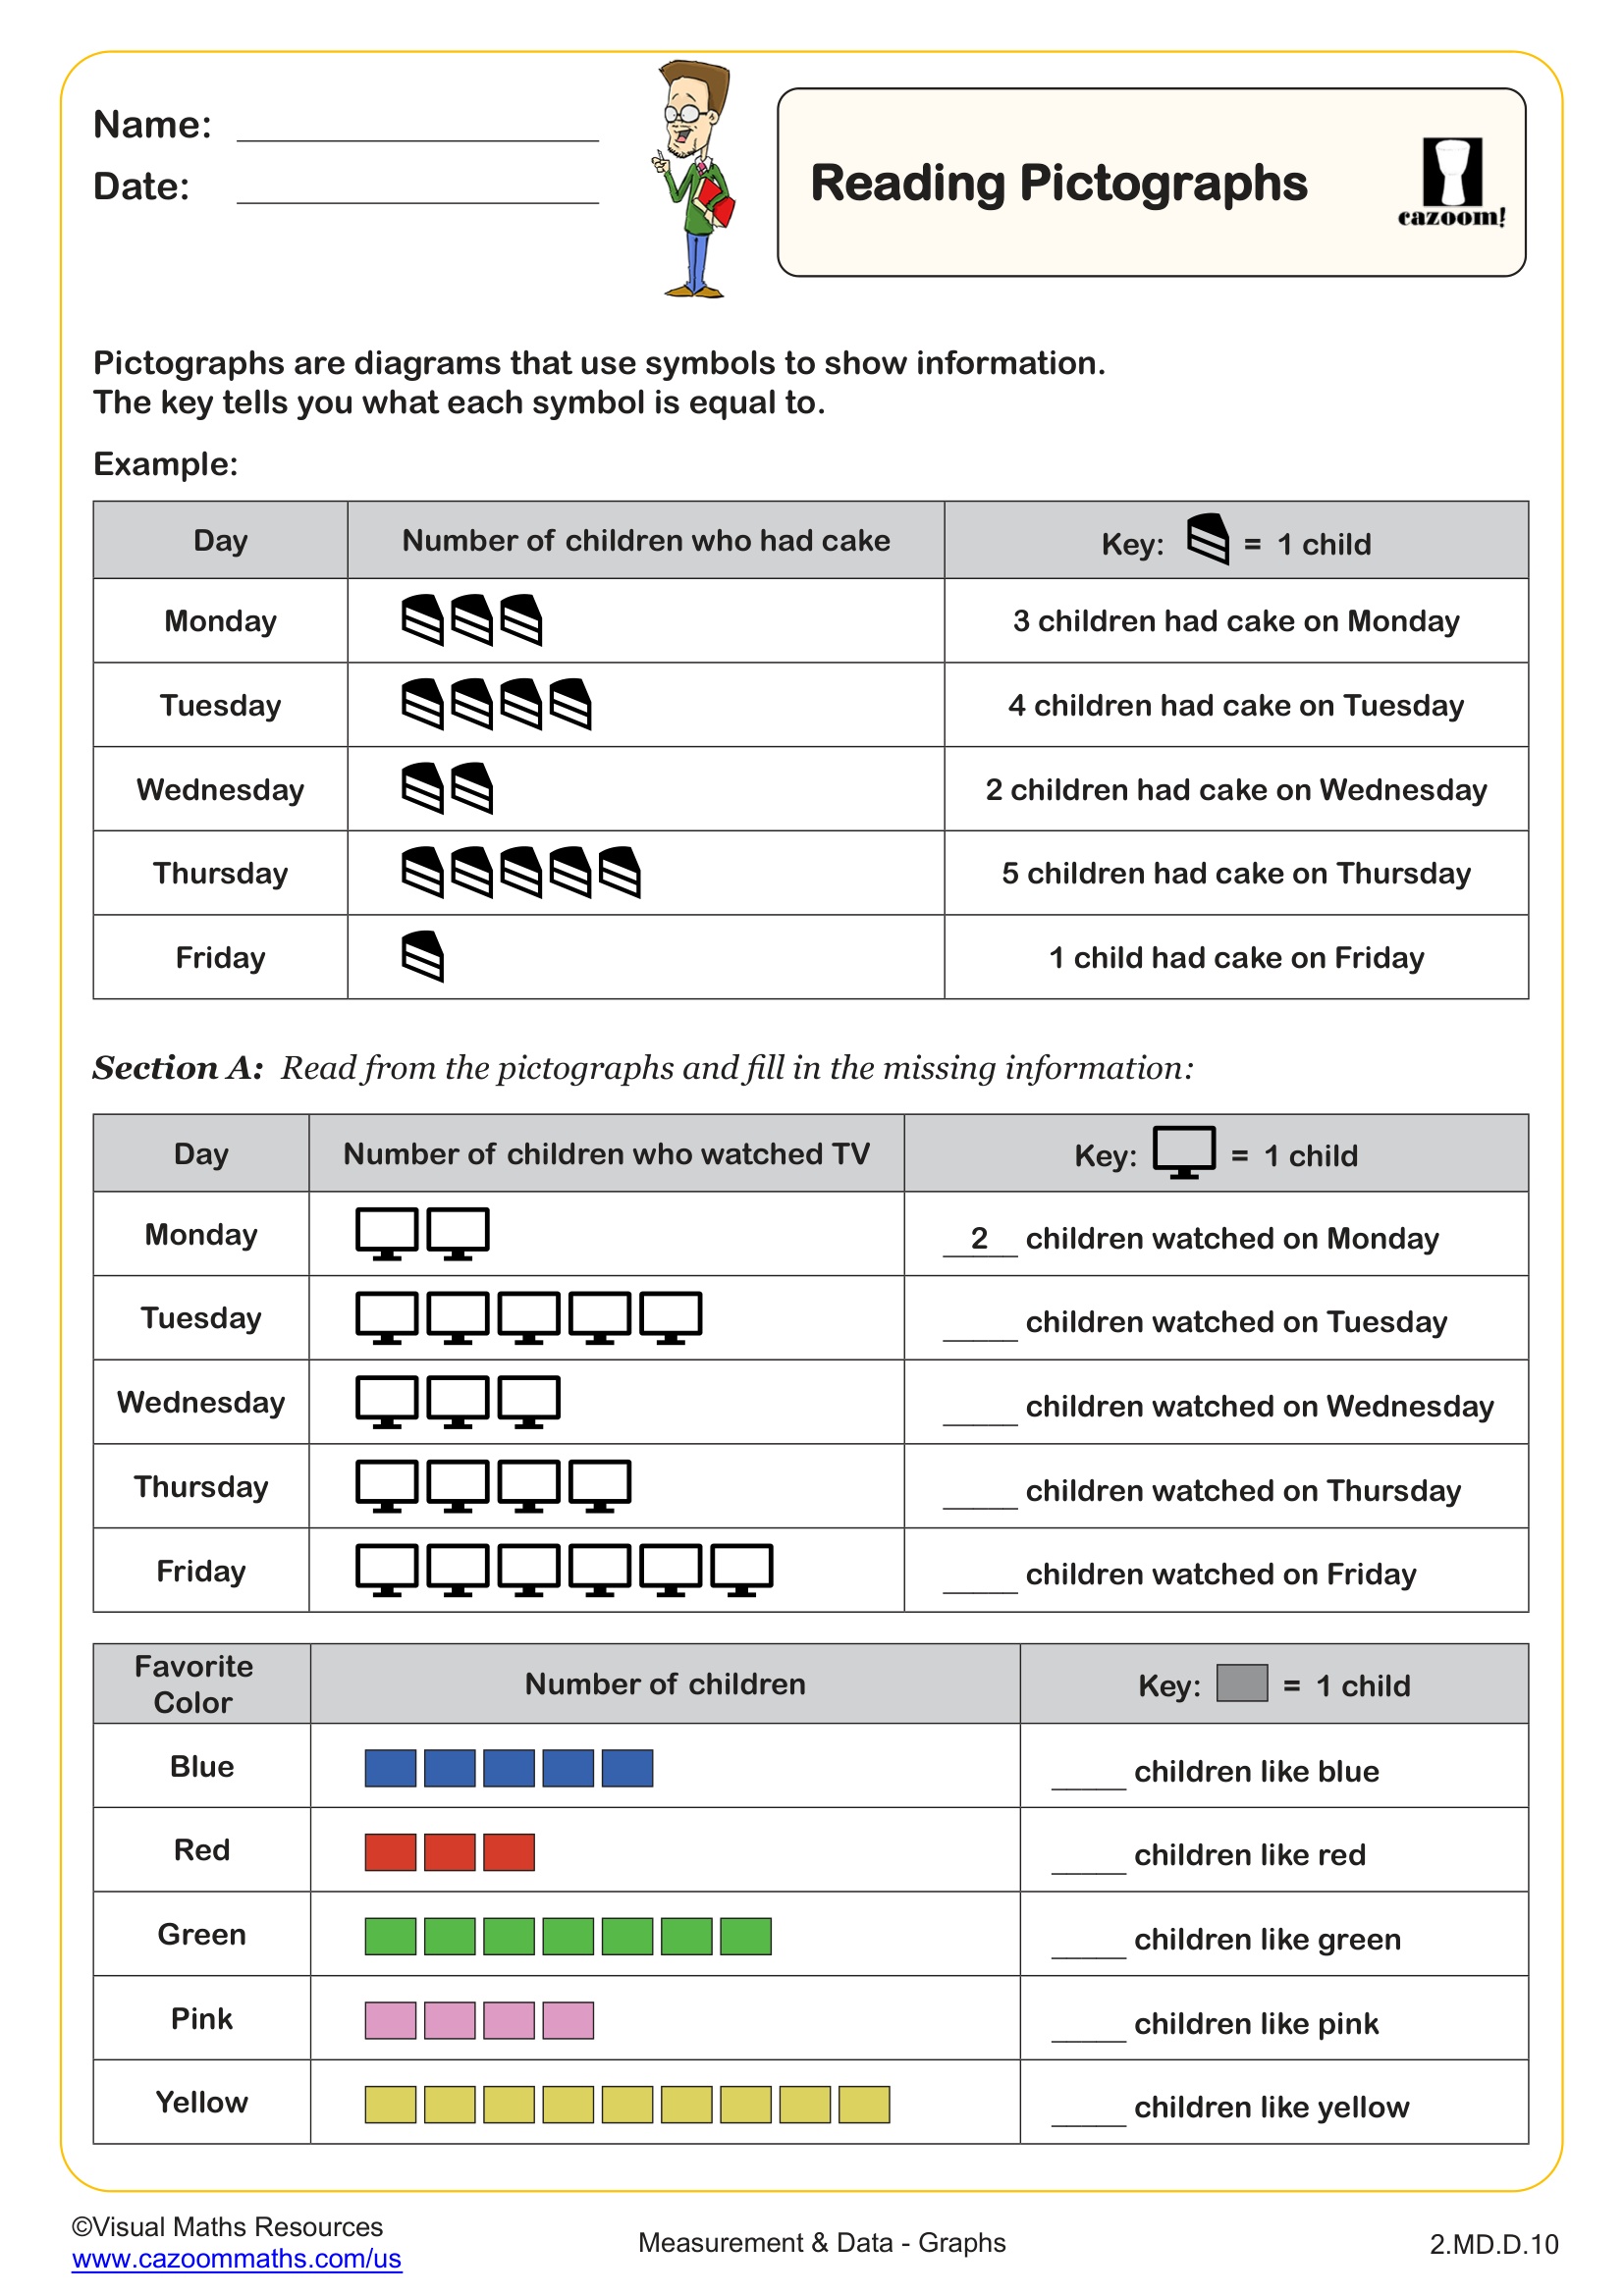
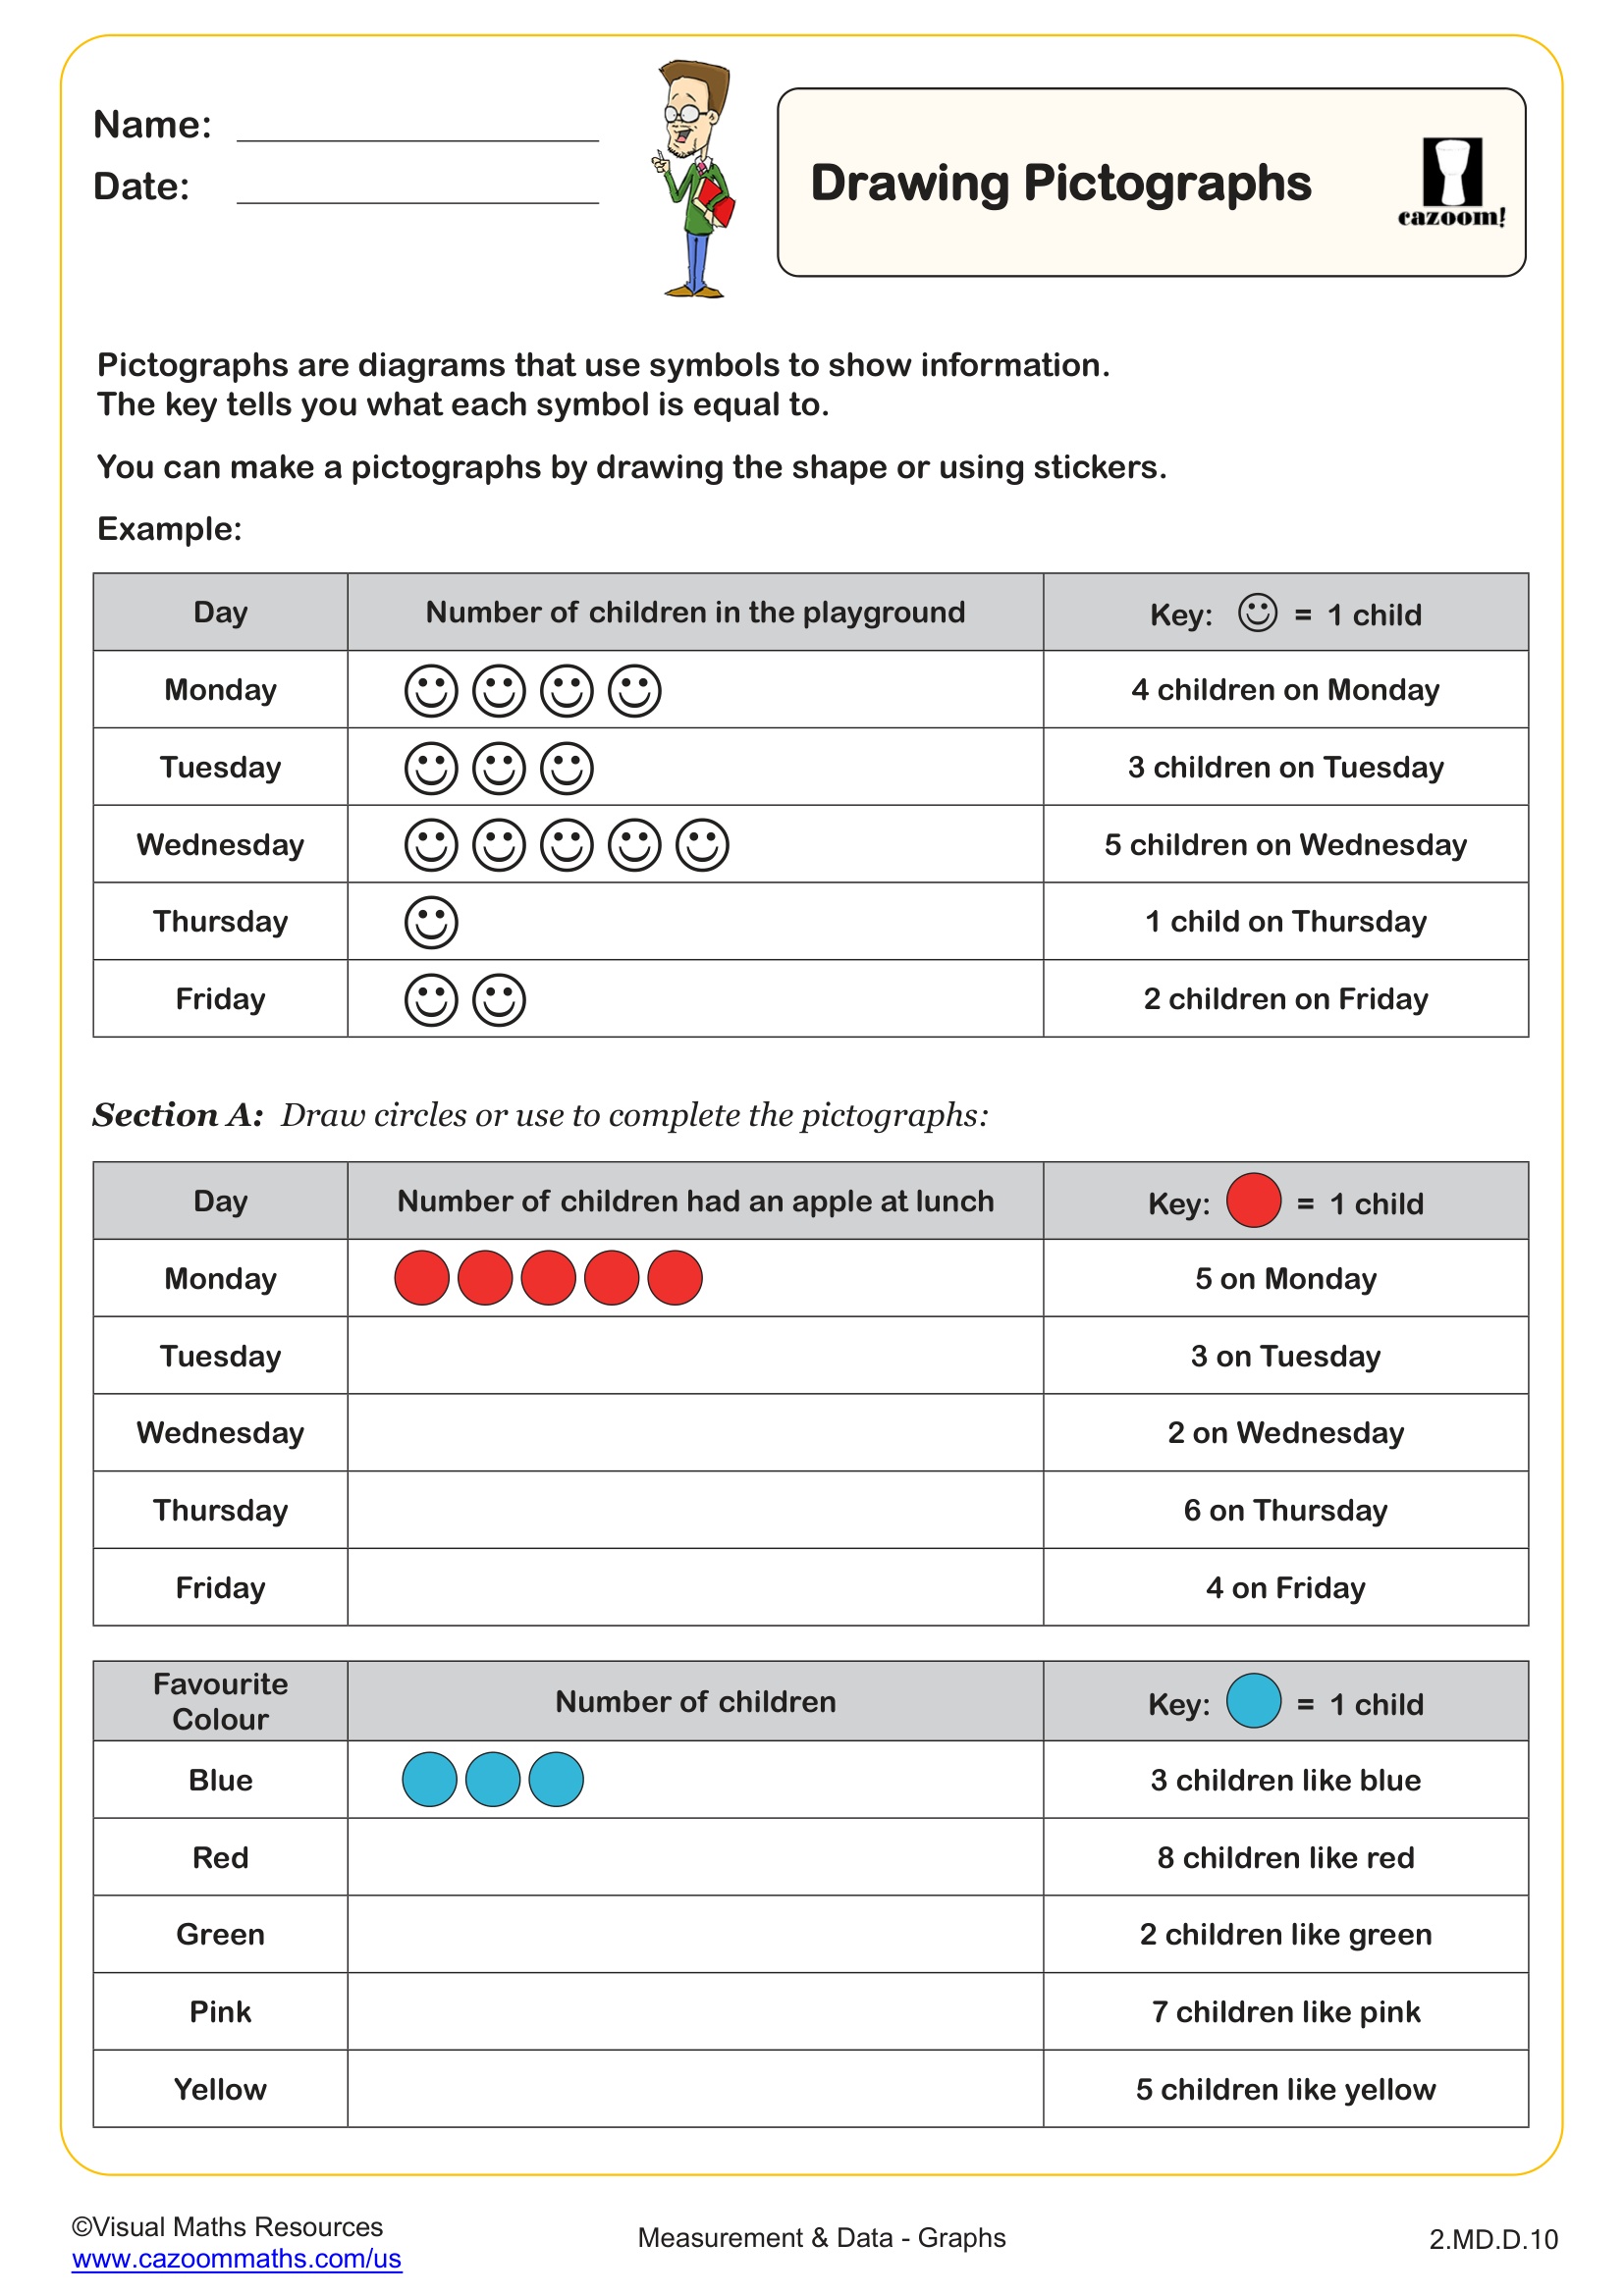
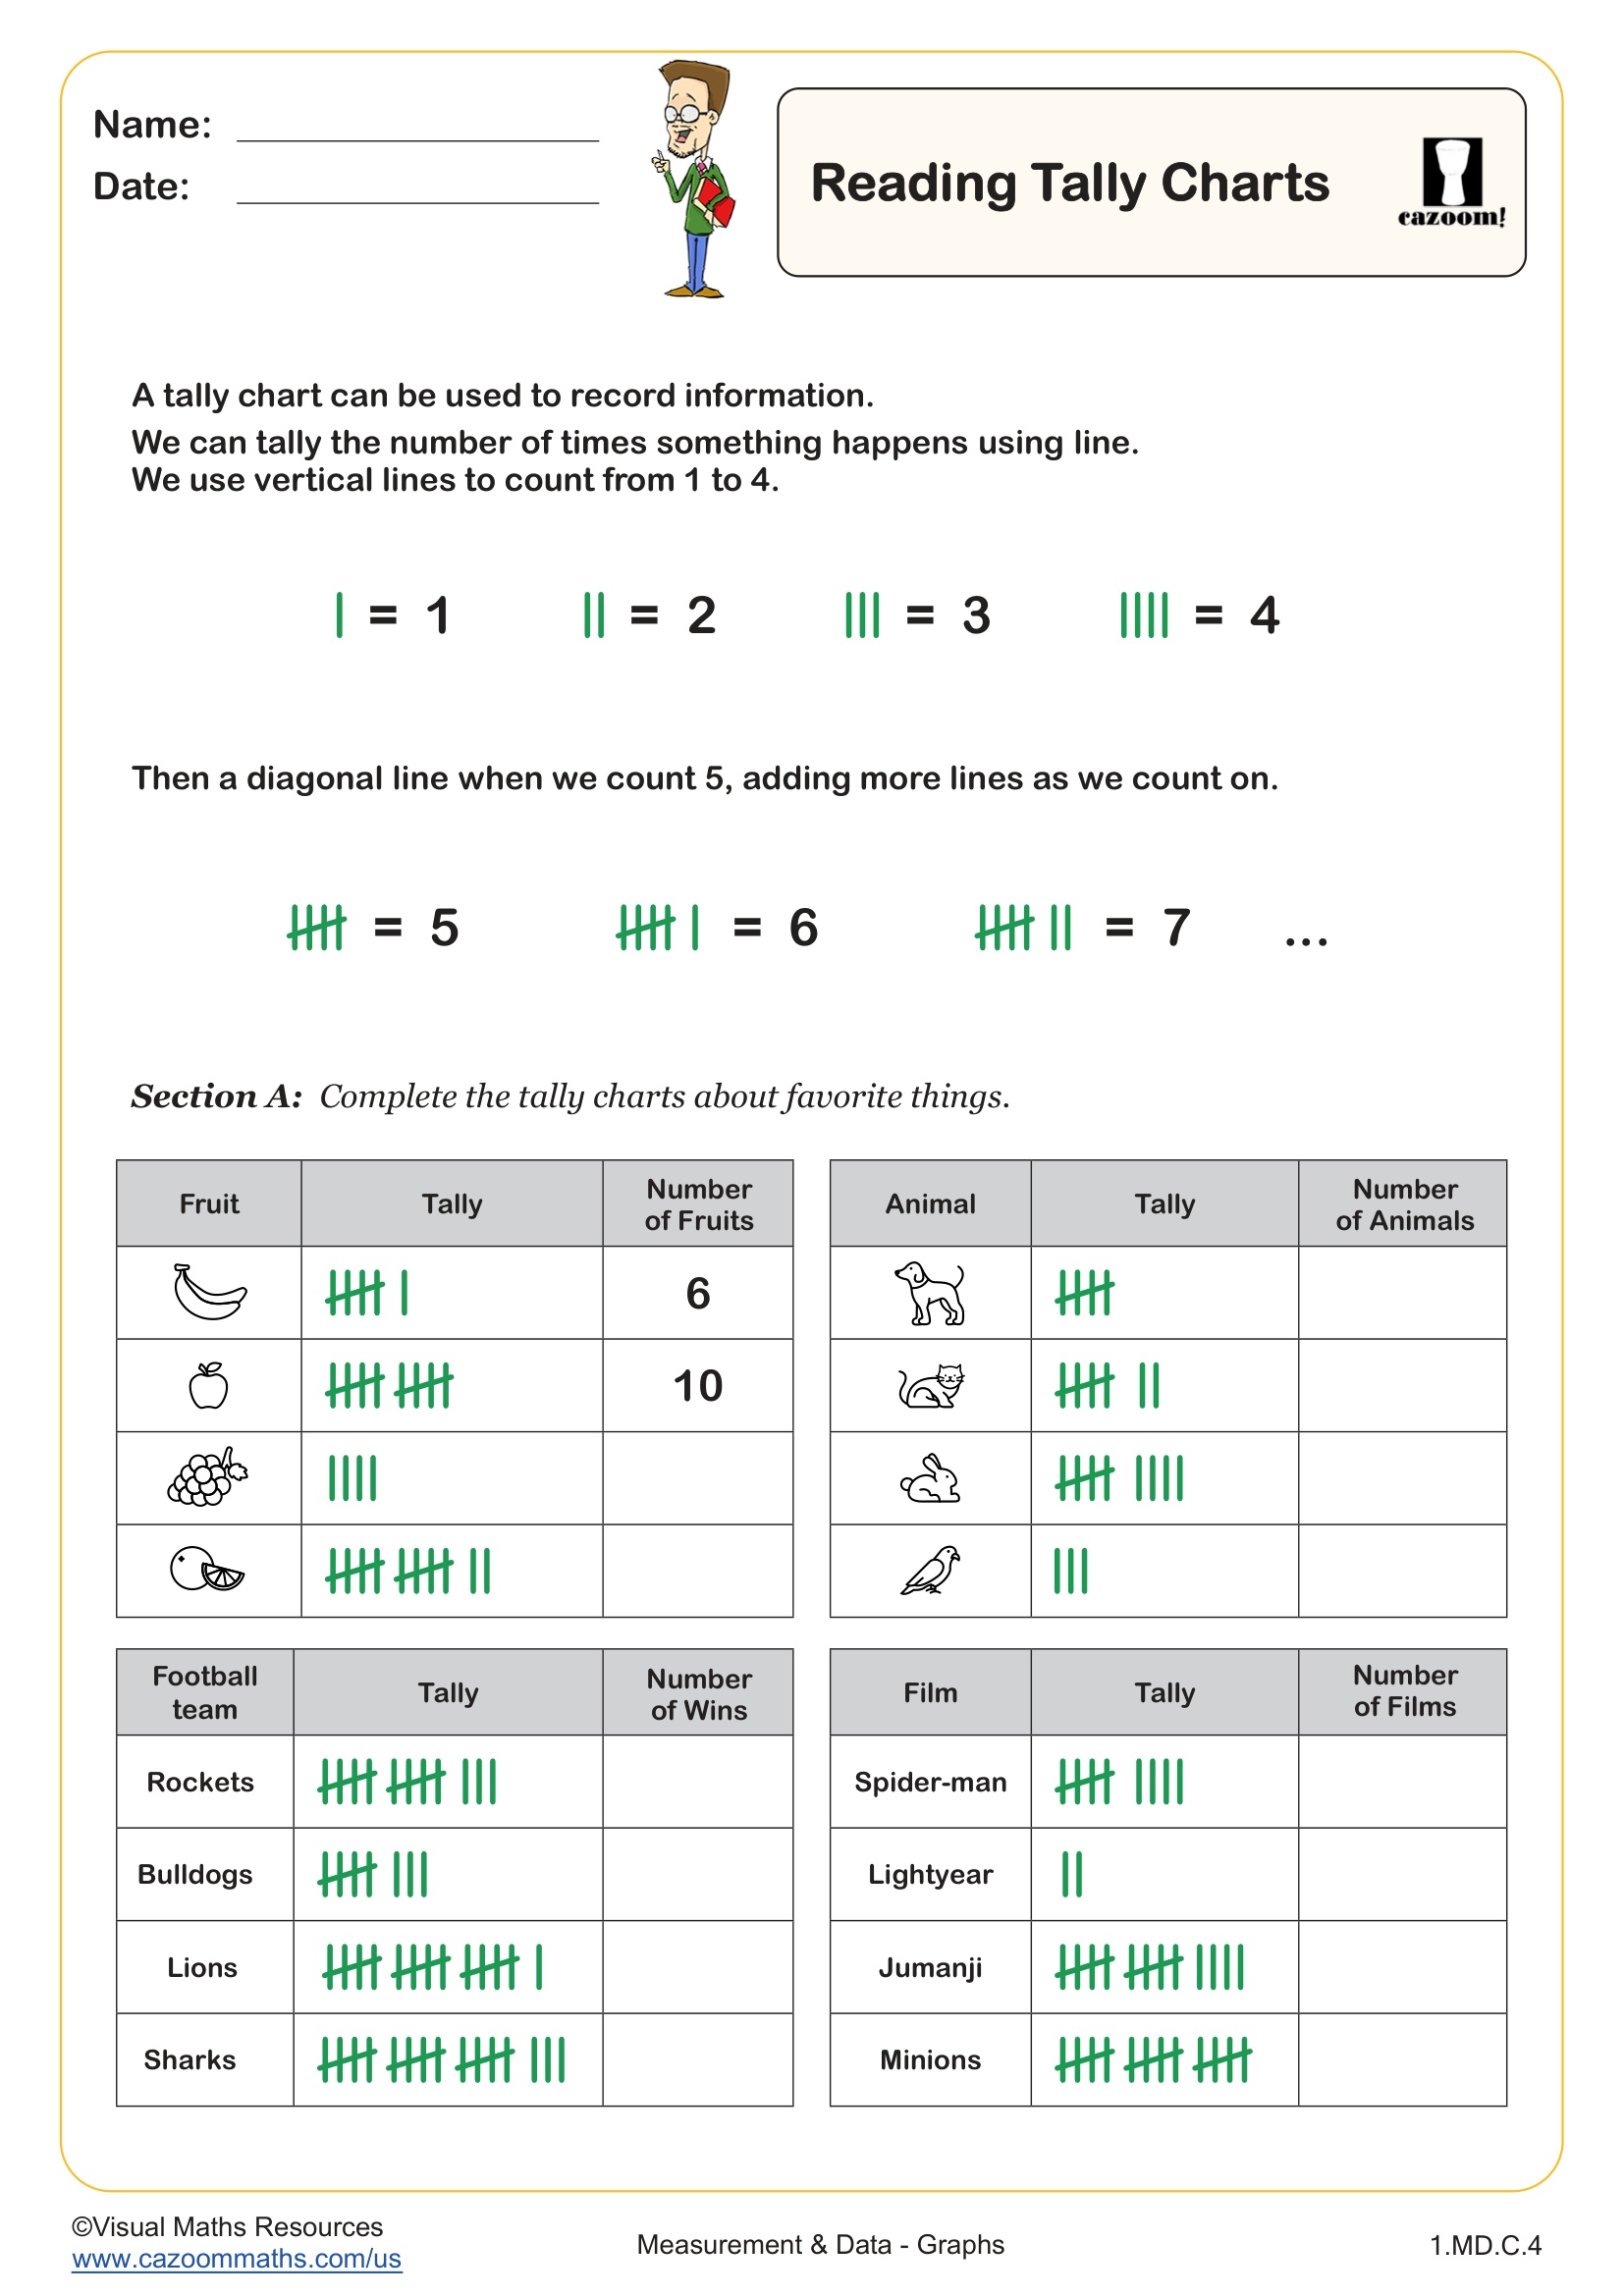
Bar Graphs WORKSHEET DESCRIPTION
This worksheet will have your students reading information from bar graphs, completing frequency tables from bar graphs and drawing bar graphs from information given. The frequency scales for all bar graphs go up in 1s.
All worksheets are created by the team of experienced teachers at Cazoom Math.

RELATED TO Bar Graphs WORKSHEET
Frequently Asked Questions
This bar graphs worksheet is designed for students in 2nd Grade and 3rd Grade and aligns with Common Core State Standards.