Constructing and Interpreting Scatter Plots WORKSHEET
Suitable for Grades: 8th Grade, Algebra I
CCSS: 8.SP.A.1, HSS.ID.B.6
CCSS Description: Construct and interpret scatter plots for bivariate measurement data to investigate patterns of association between two quantities. Describe patterns such as clustering, outliers, positive or negative association, linear association, and nonlinear association.
Represent data on two quantitative variables on a scatter plot, and describe how the variables are related. a. Fit a function to the data; use functions fitted to data to solve problems in the context of the data. Use given functions or choose a function suggested by the context. Emphasize linear, quadratic, and exponential models. b. Informally assess the fit of a function by plotting and analyzing residuals. c. Fit a linear function for a scatter plot that suggests a linear association.
Represent data on two quantitative variables on a scatter plot, and describe how the variables are related. a. Fit a function to the data; use functions fitted to data to solve problems in the context of the data. Use given functions or choose a function suggested by the context. Emphasize linear, quadratic, and exponential models. b. Informally assess the fit of a function by plotting and analyzing residuals. c. Fit a linear function for a scatter plot that suggests a linear association.
Constructing and Interpreting Scatter Plots WORKSHEET DESCRIPTION
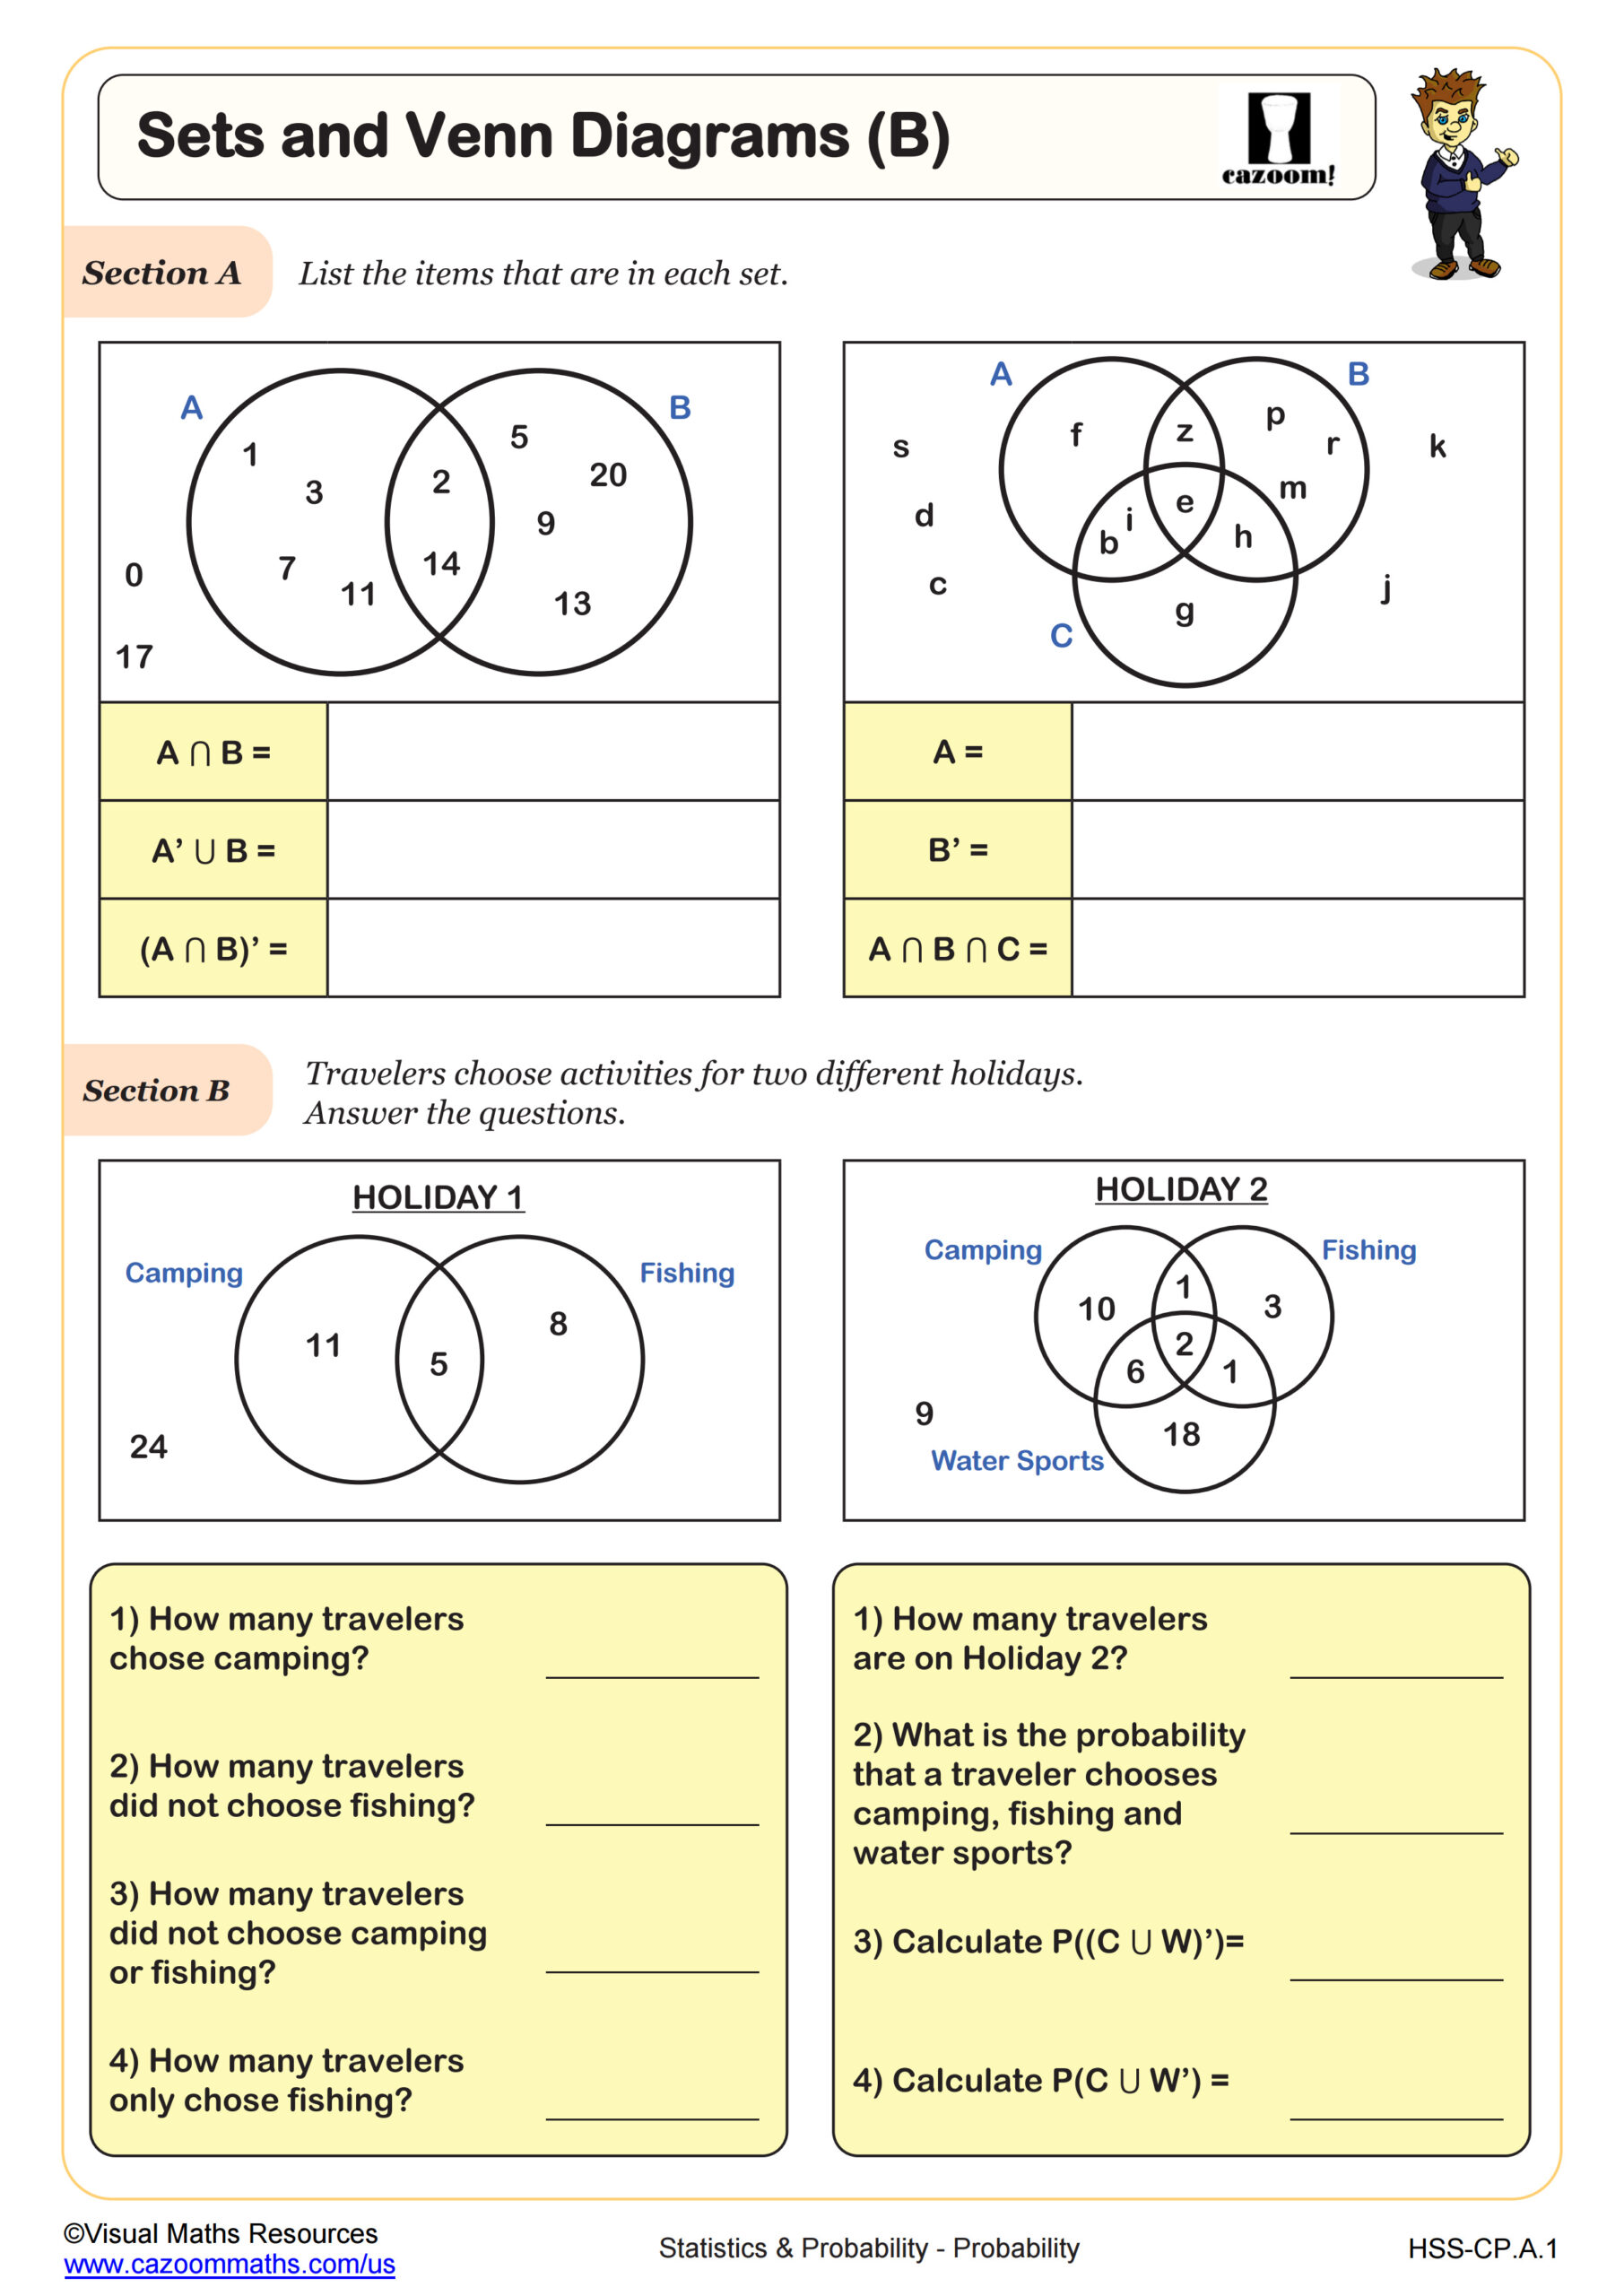
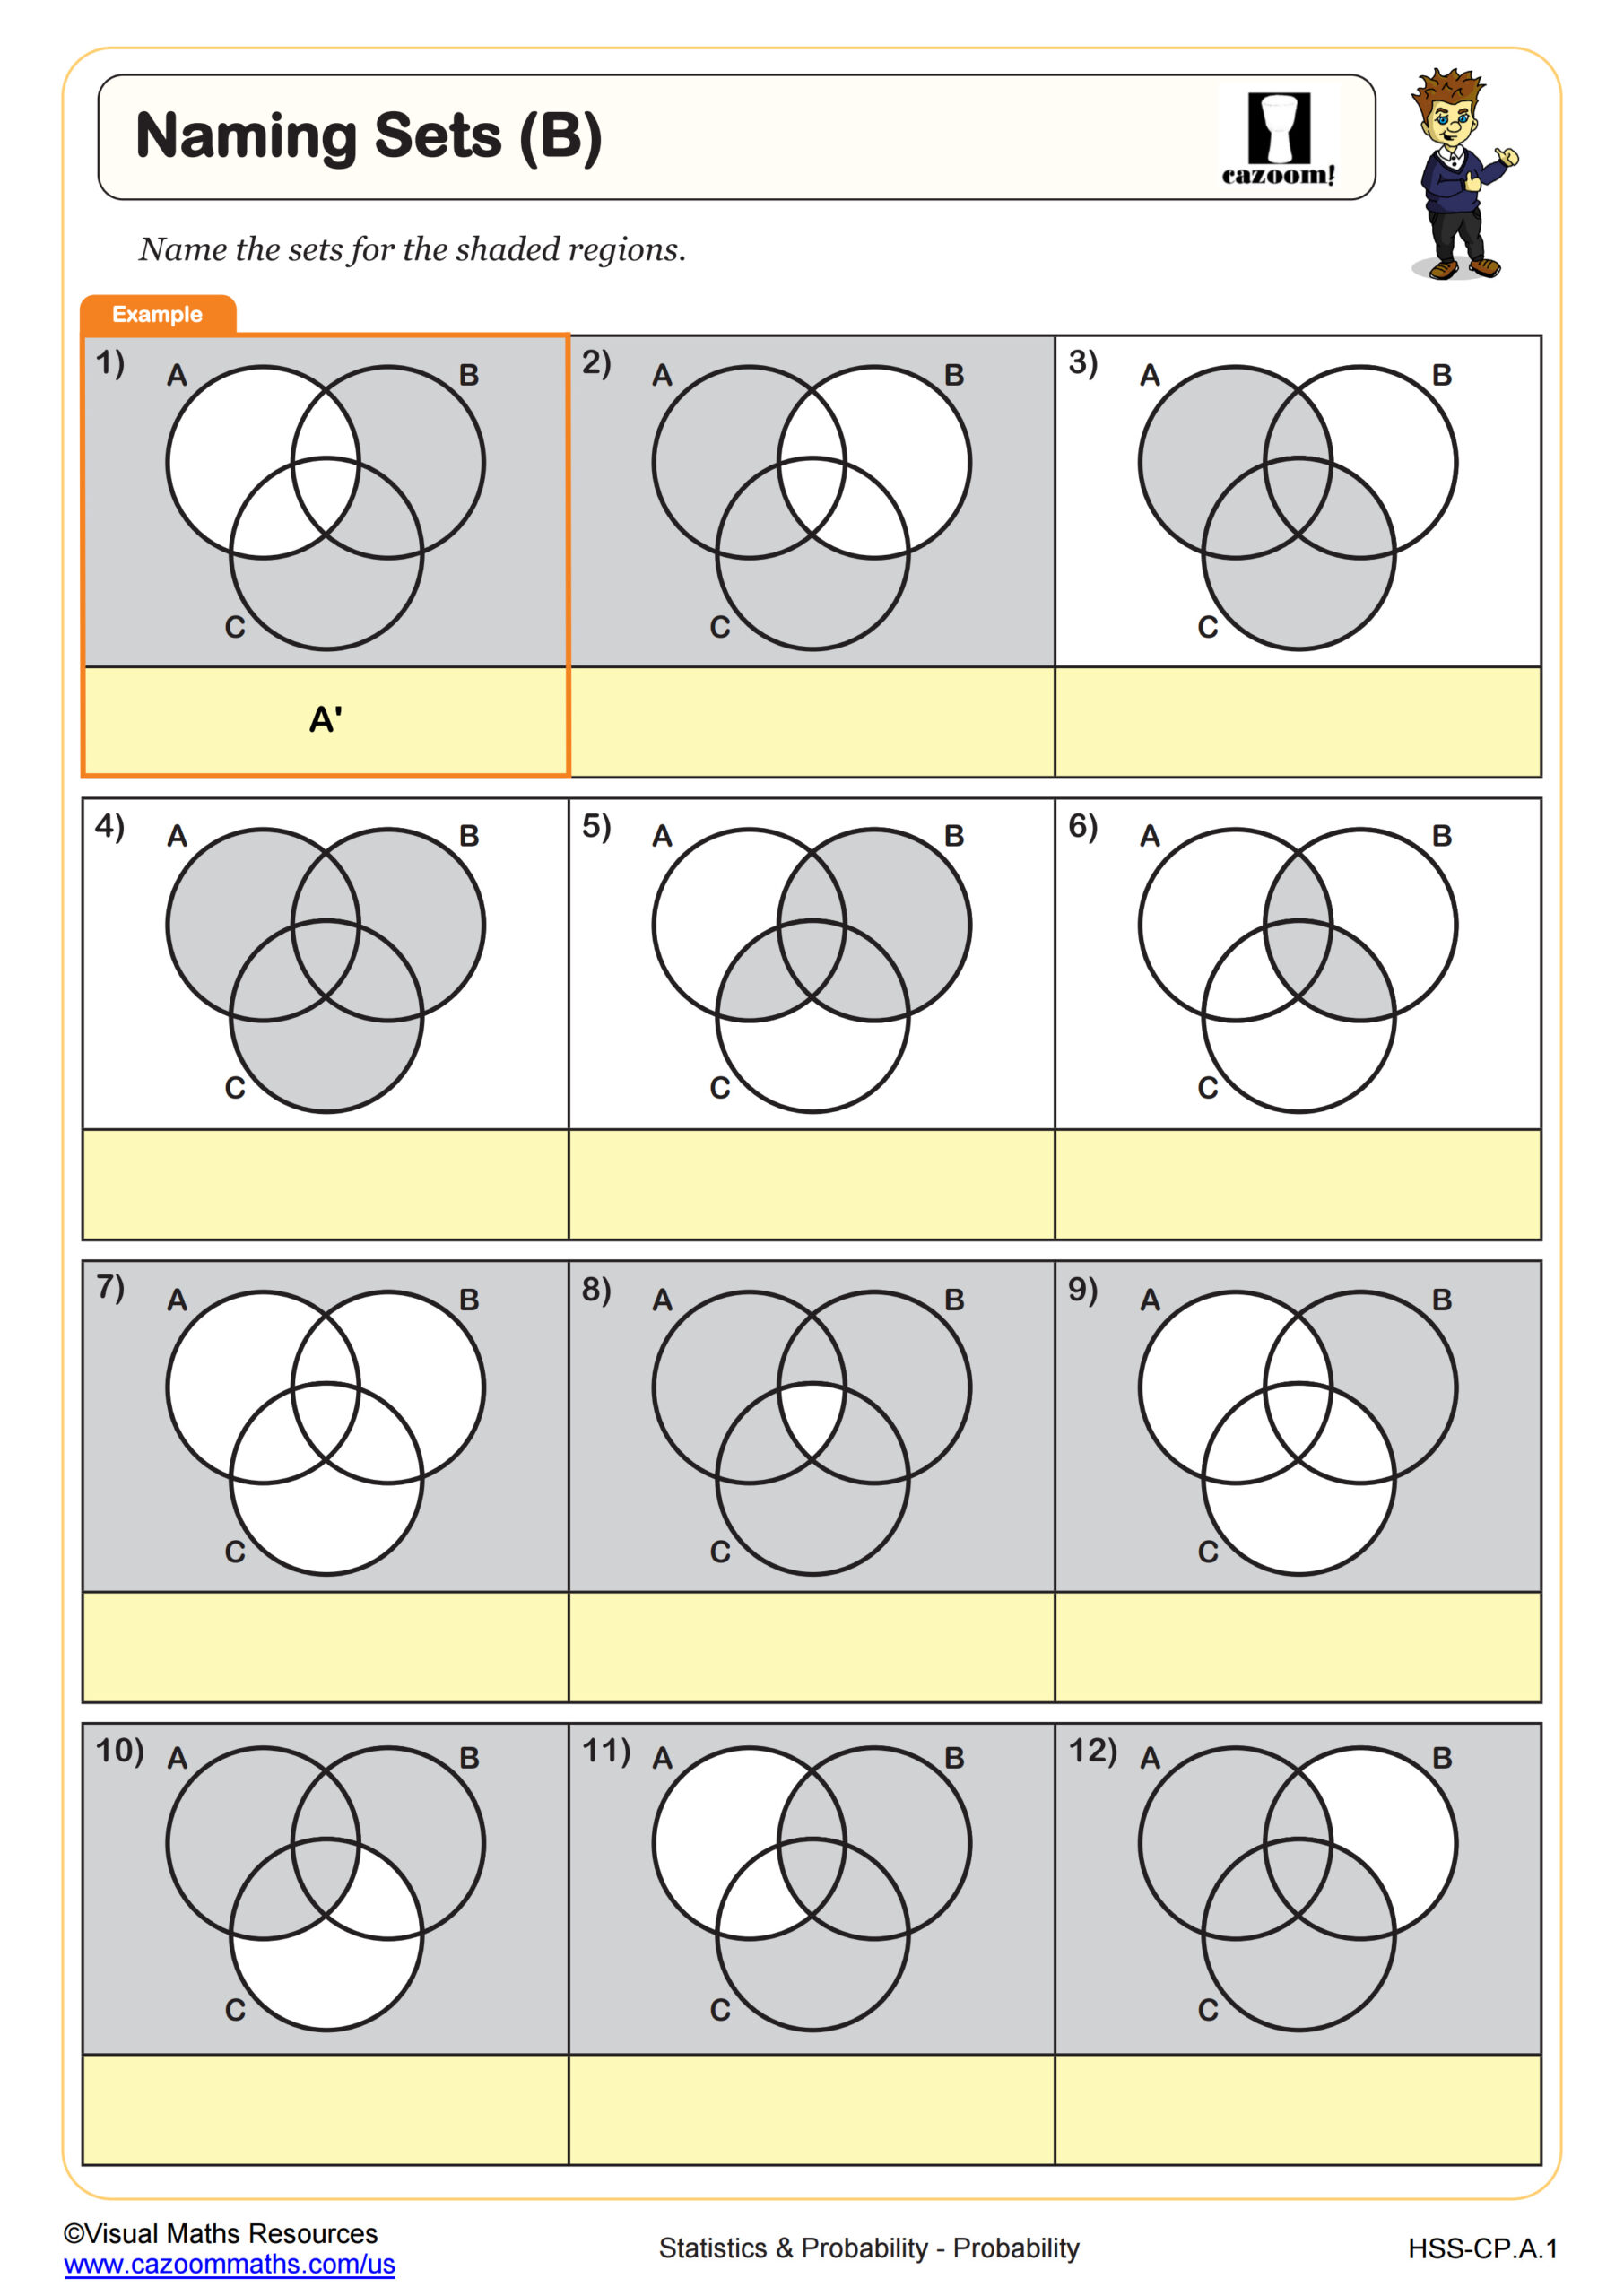
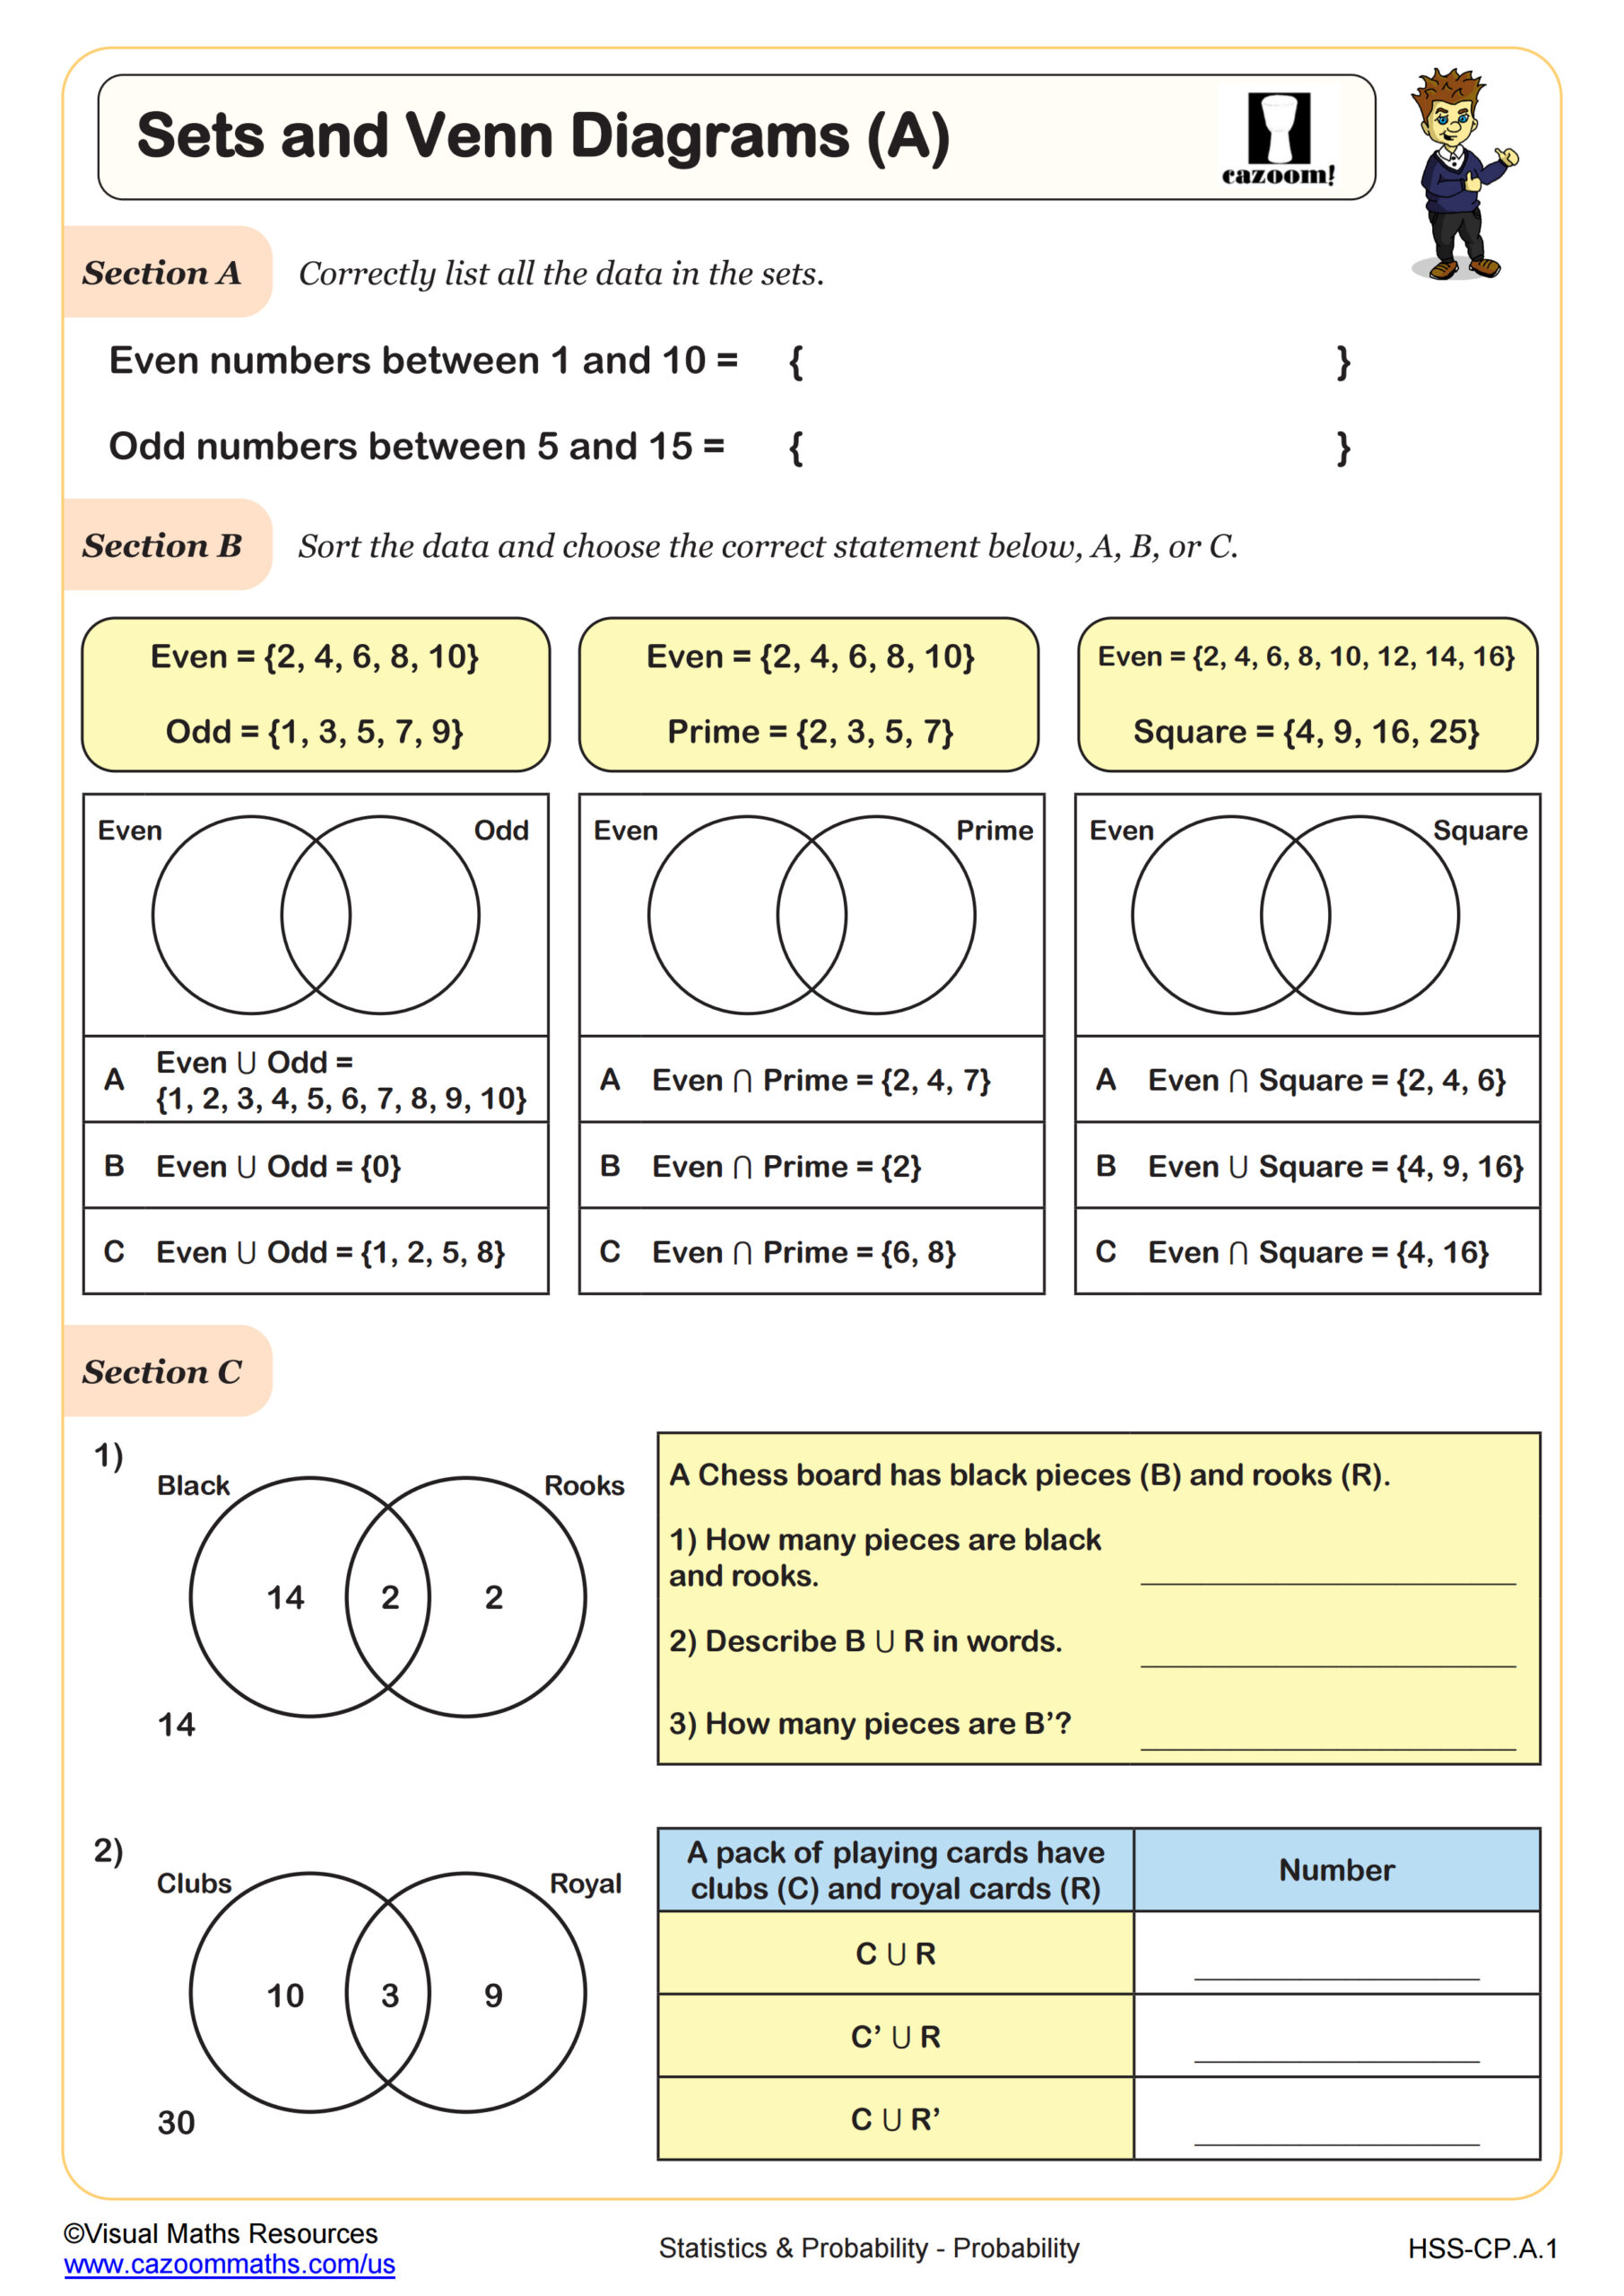
Use this worksheet alongside Scatter Plots: Correlation and Scatter Plots: Line of Best Fit. This worksheet provides consolidation of reading and plotting coordinates for scatter plots and describing the relationship presented in the bivariate data.
All worksheets are created by the team of experienced teachers at Cazoom Math.

RELATED TO Constructing and Interpreting Scatter Plots WORKSHEET
Frequently Asked Questions
This constructing and interpreting scatter plots worksheet is designed for students in 8th Grade and Algebra I and aligns with Common Core State Standards.