Constructing Box Plots WORKSHEET
Suitable for Grades: 6th Grade, Algebra I
CCSS: 6.SP.B.4, HSS.ID.A.1
CCSS Description: Display numerical data in plots on a number line, including dot plots, histograms, and box plots.
Represent data with plots on the real number line (dot plots, histograms, and box plots).
Represent data with plots on the real number line (dot plots, histograms, and box plots).
Constructing Box Plots WORKSHEET DESCRIPTION
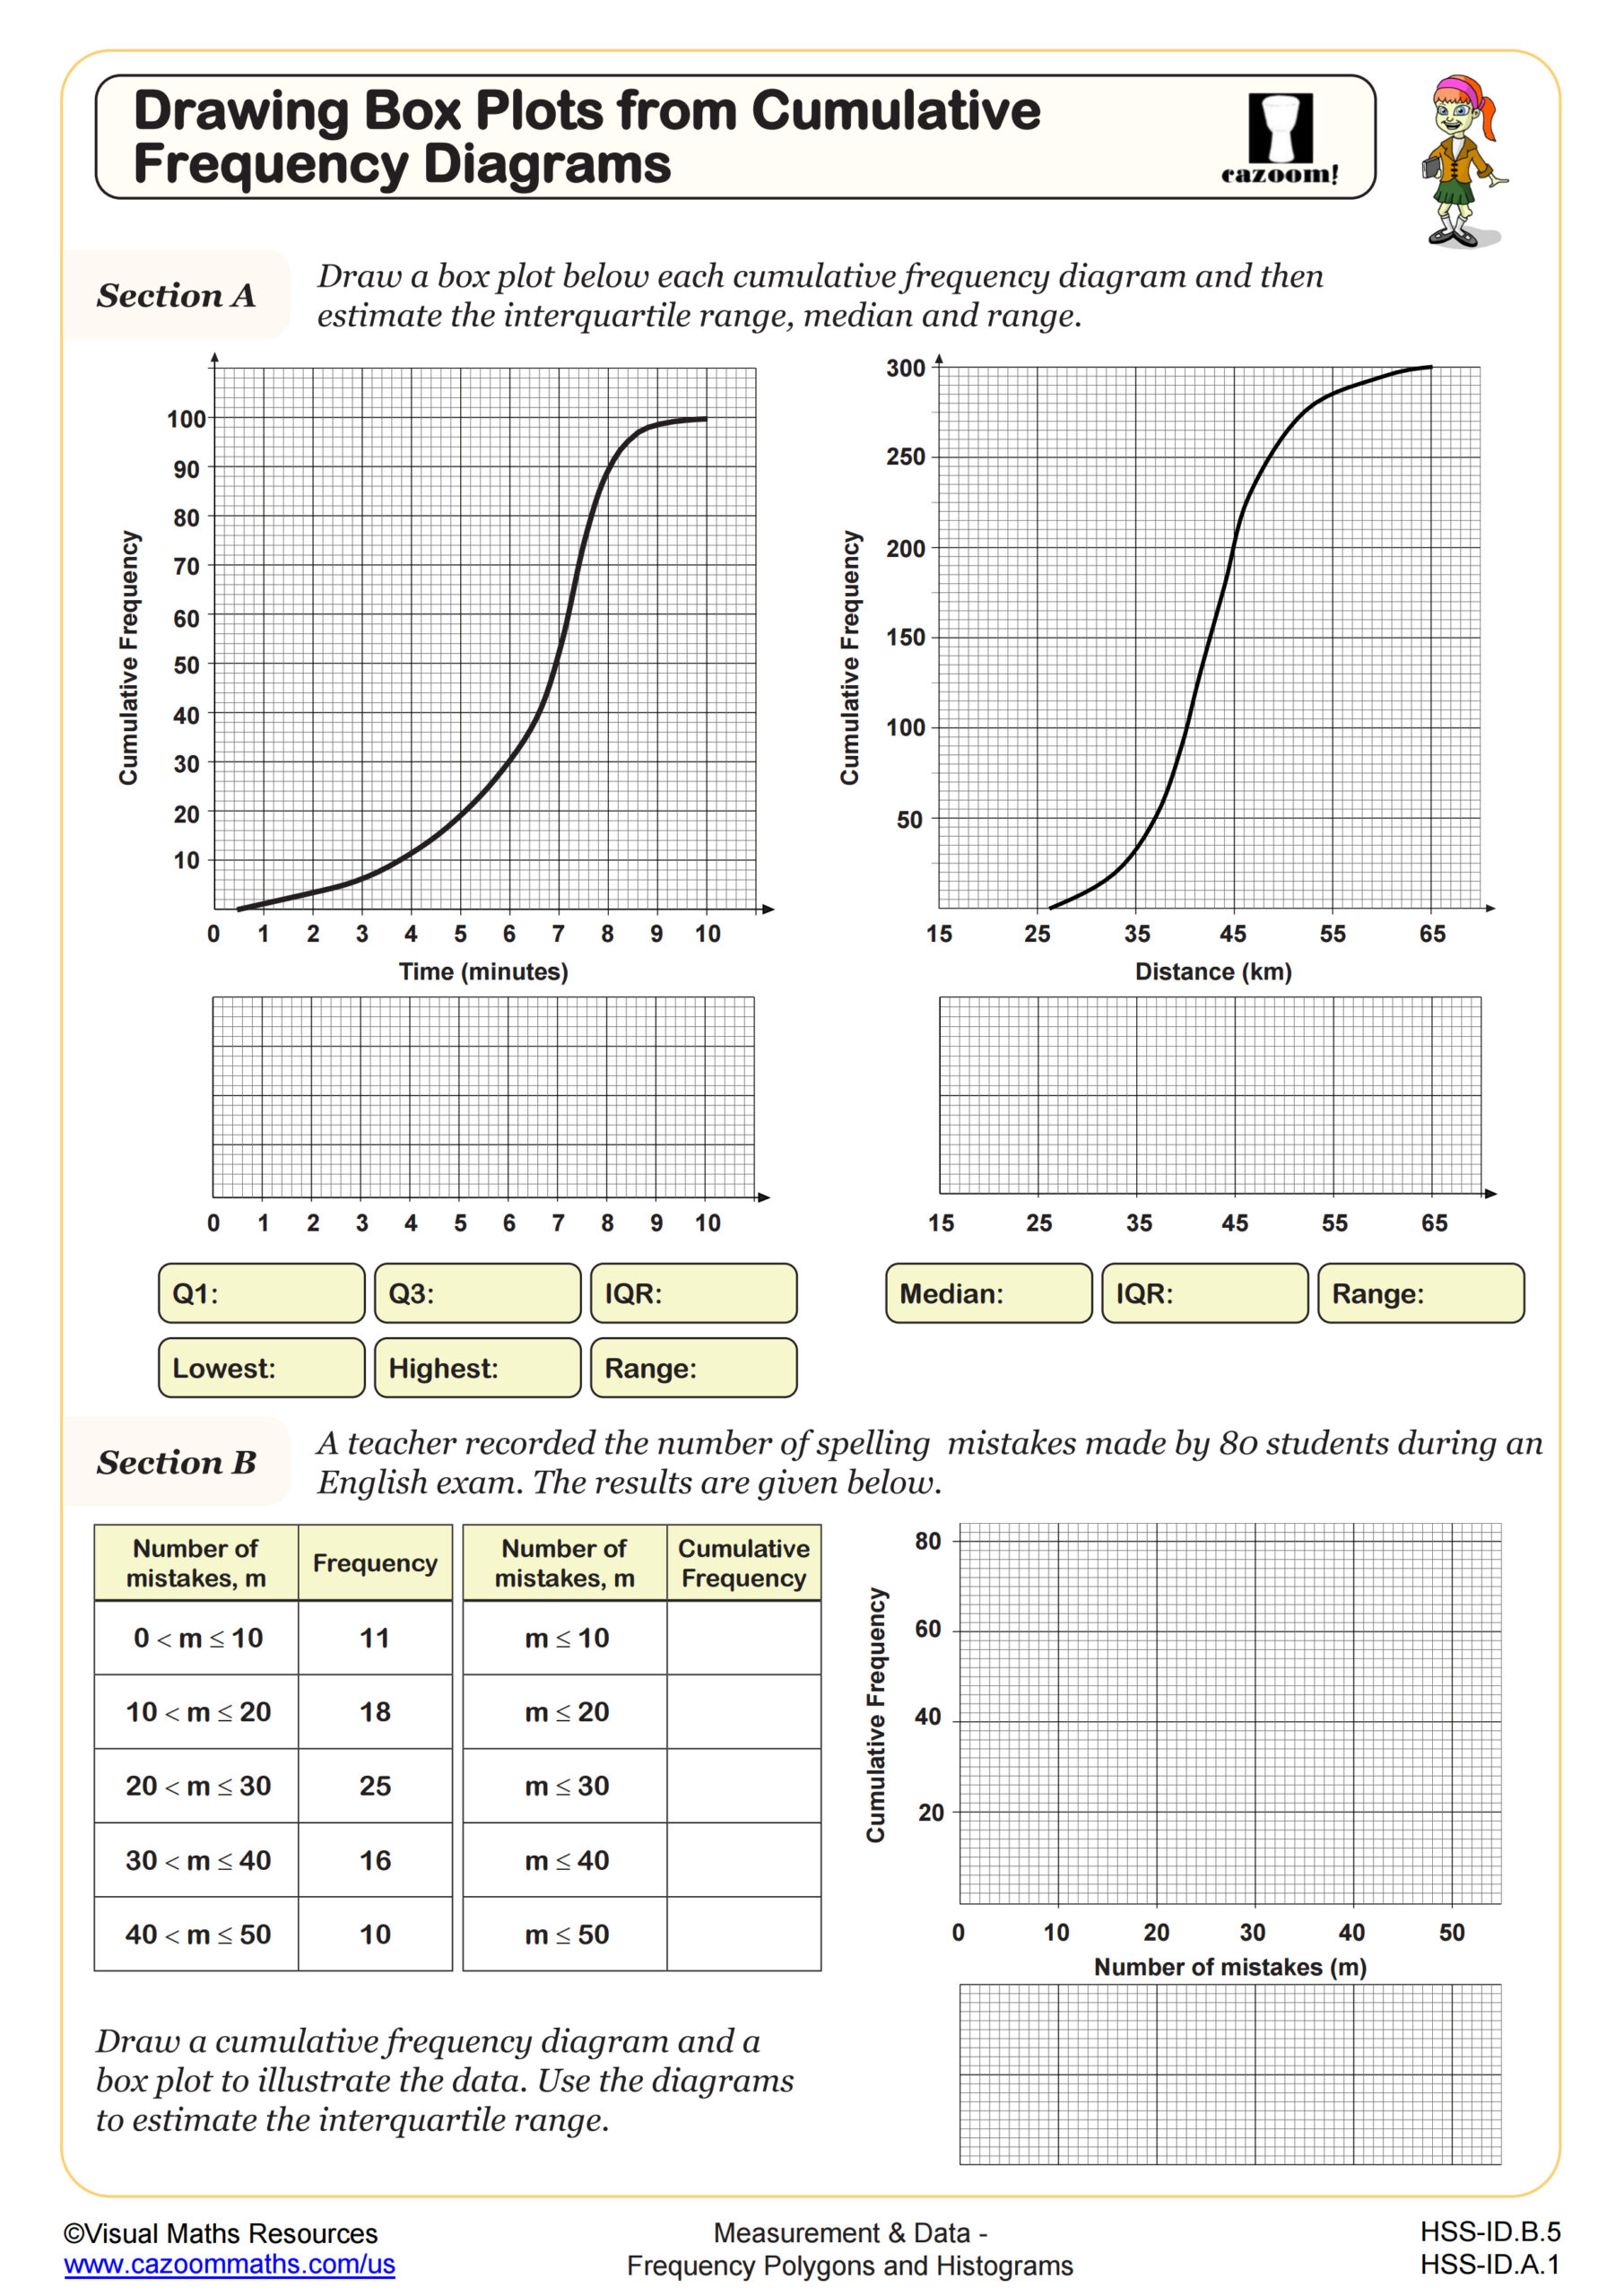
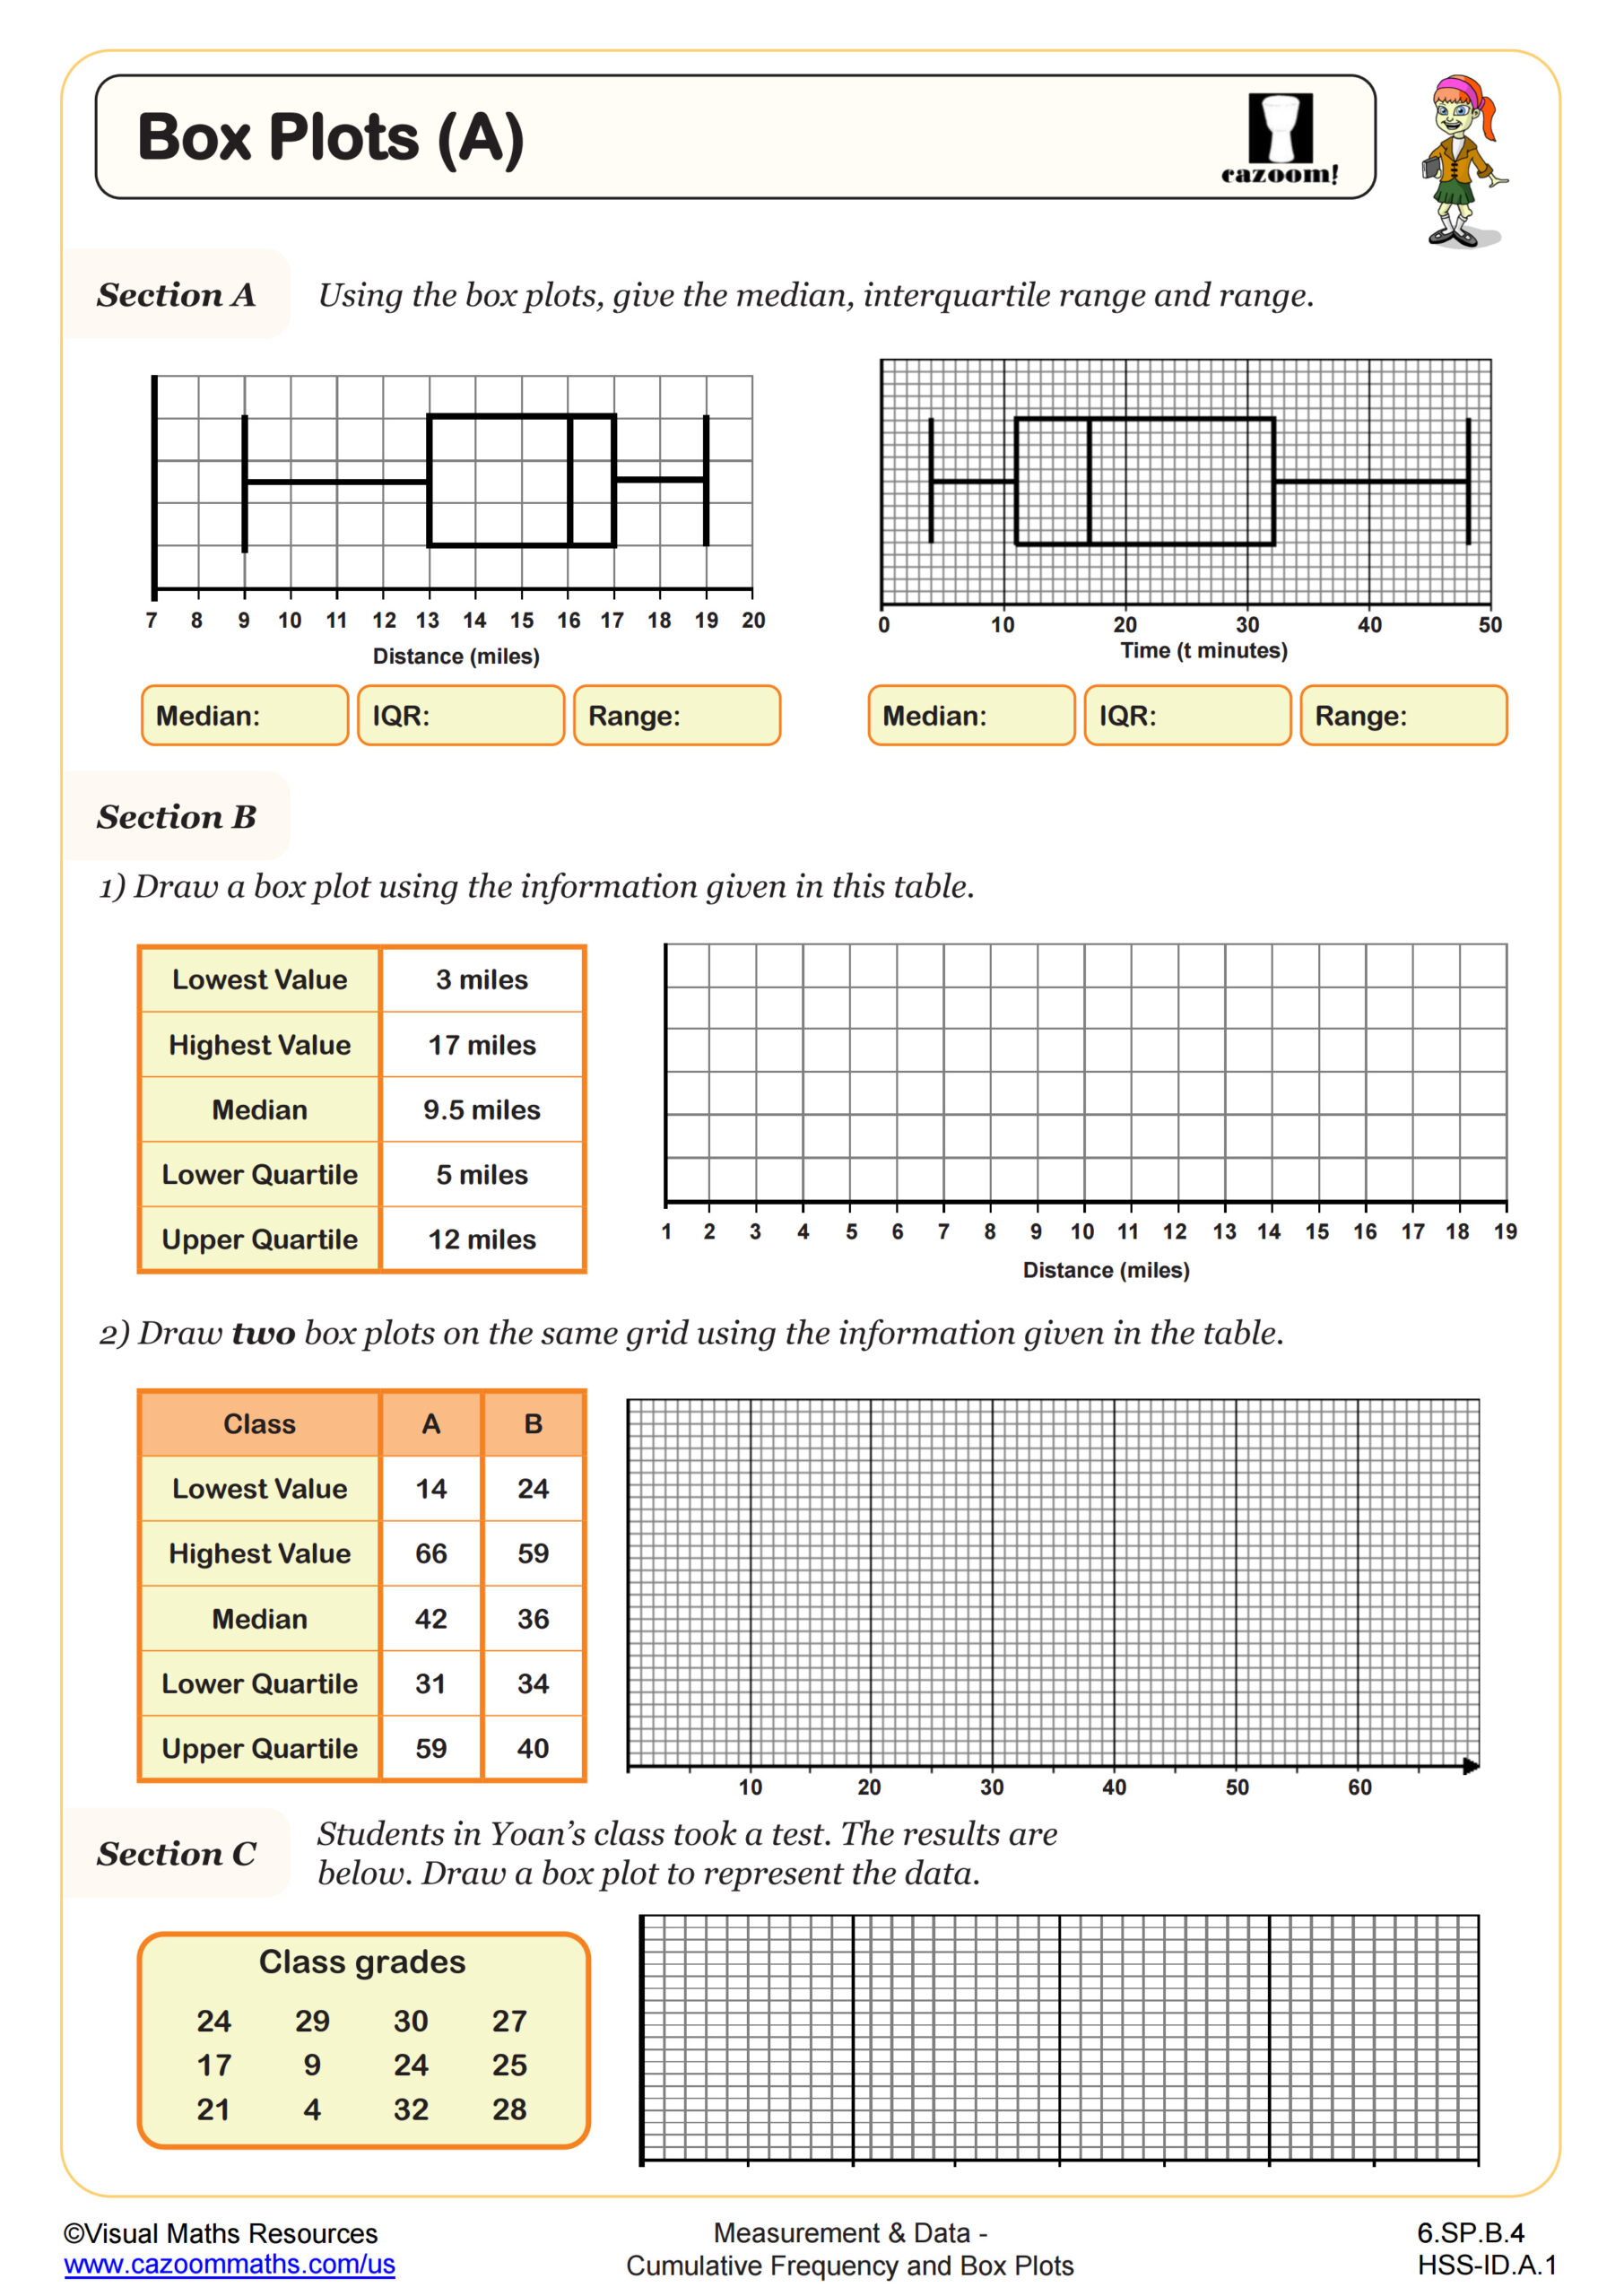
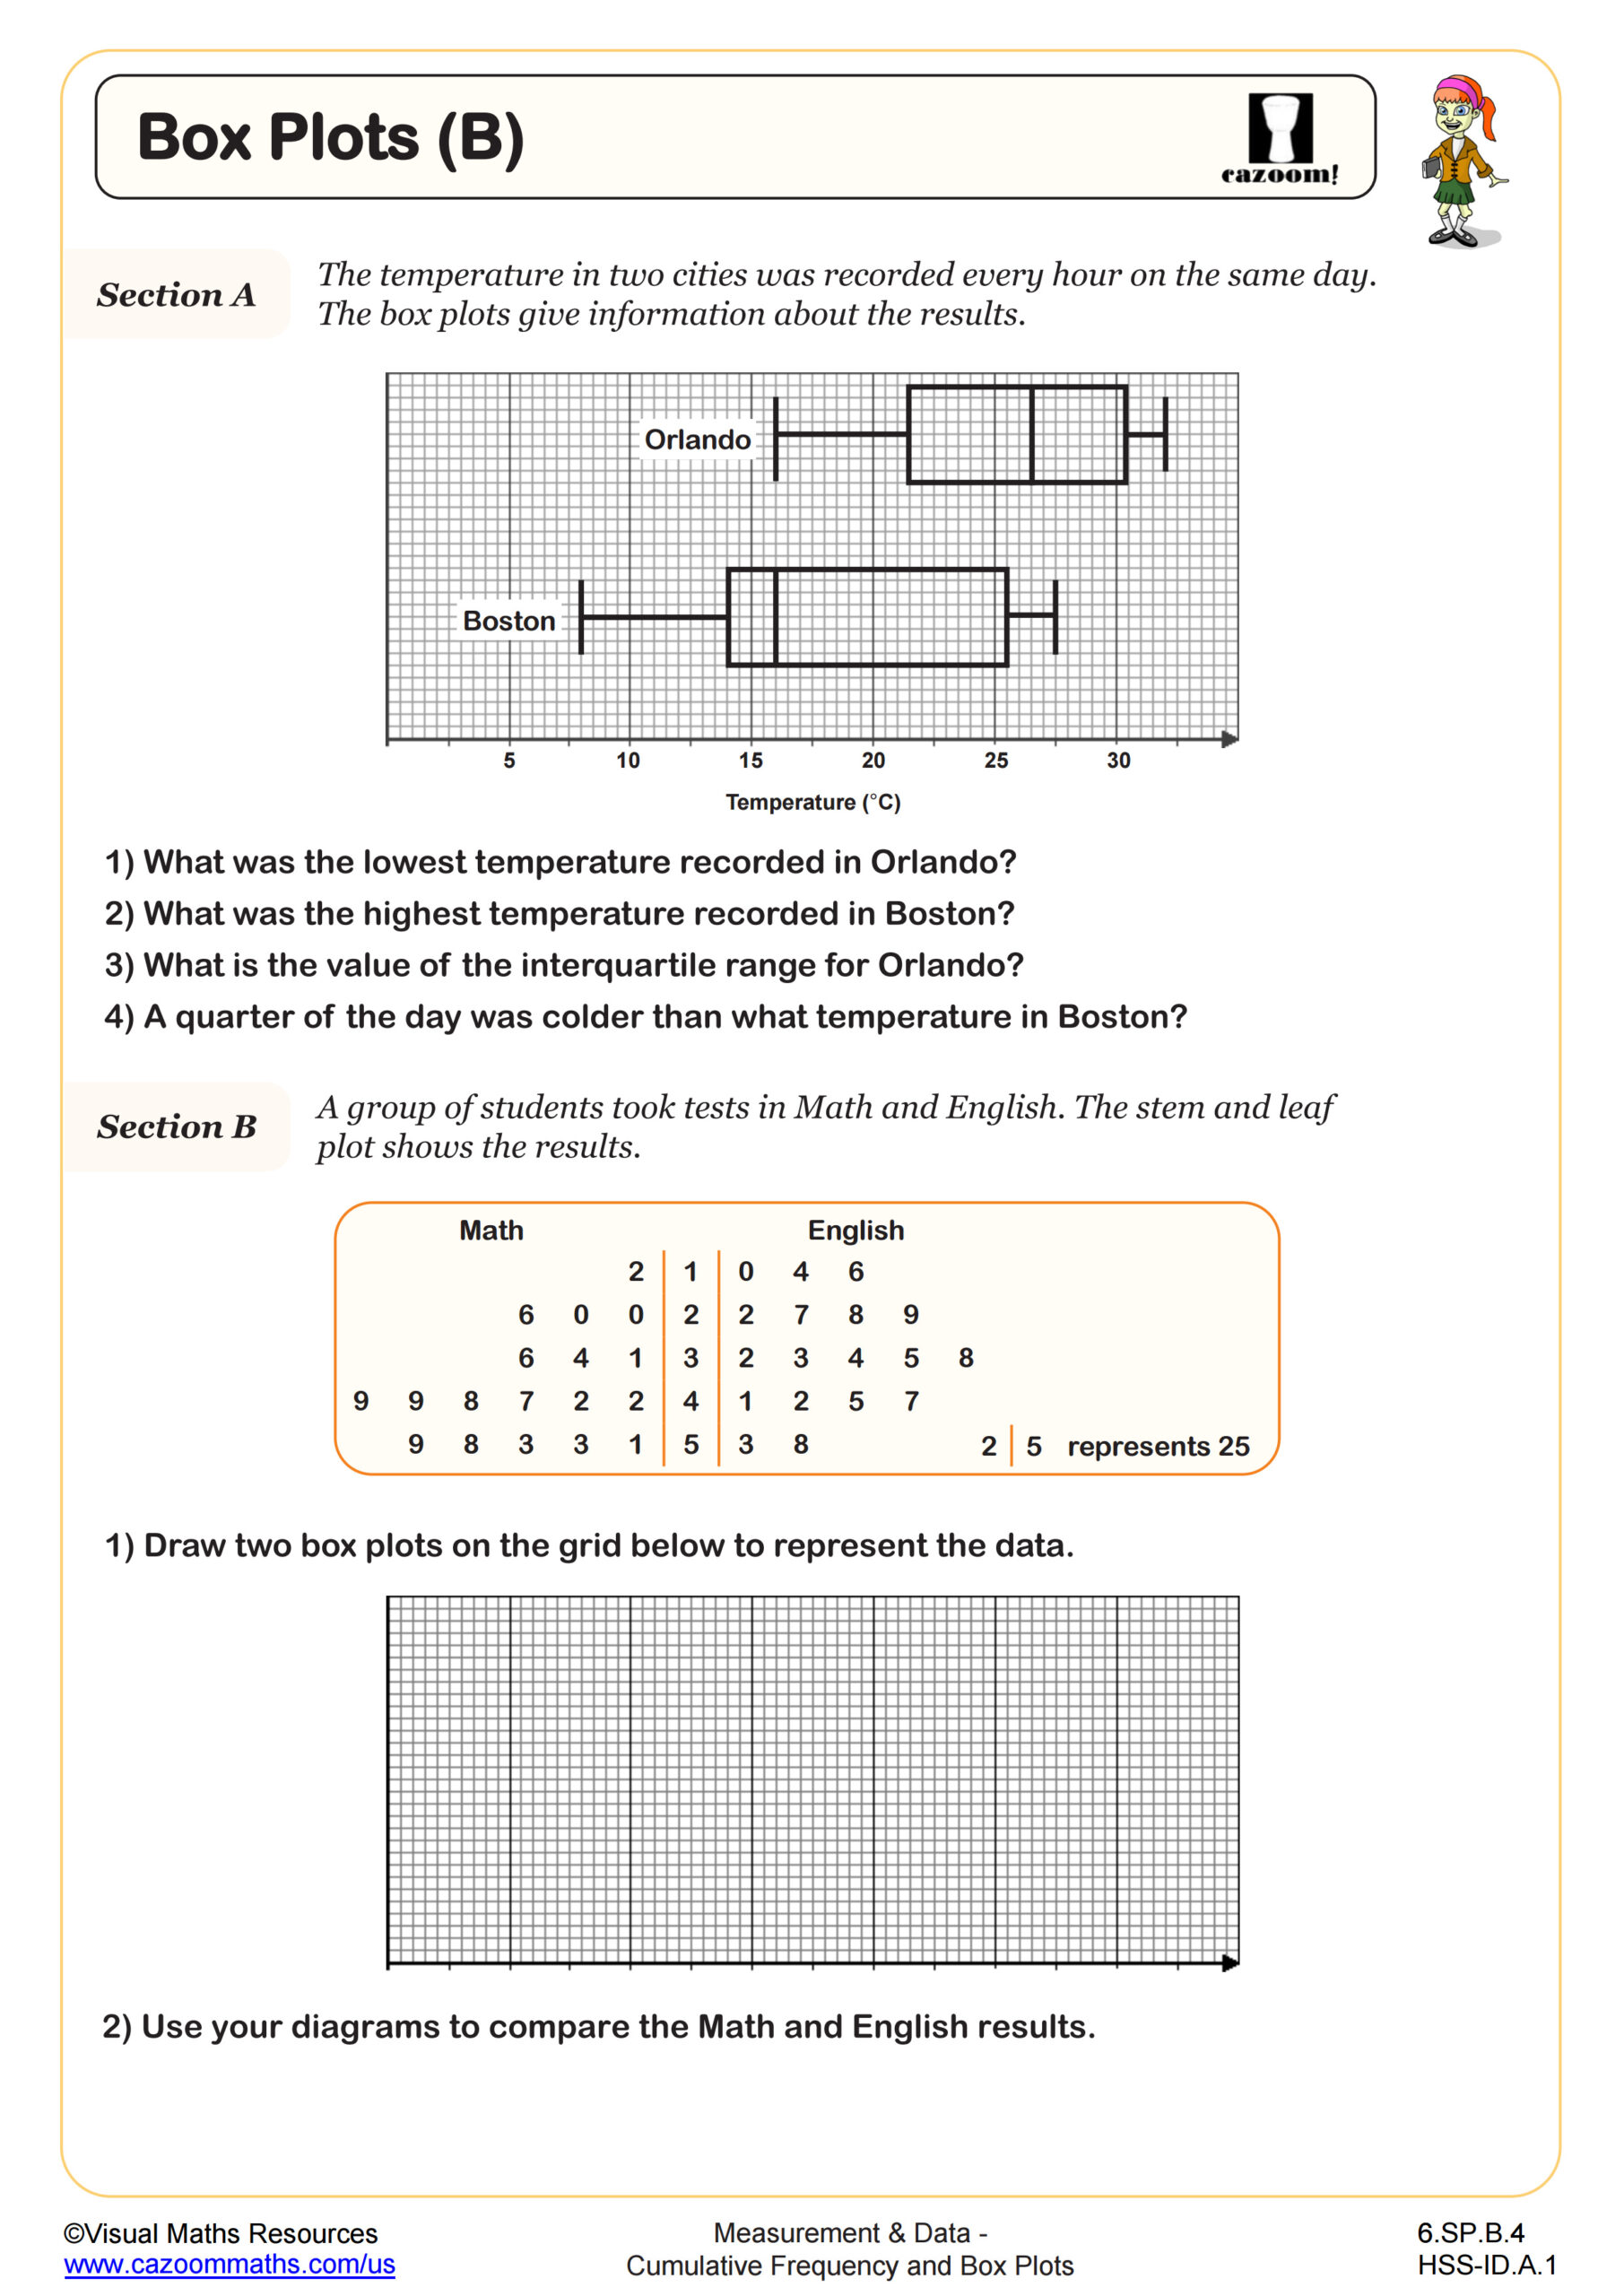
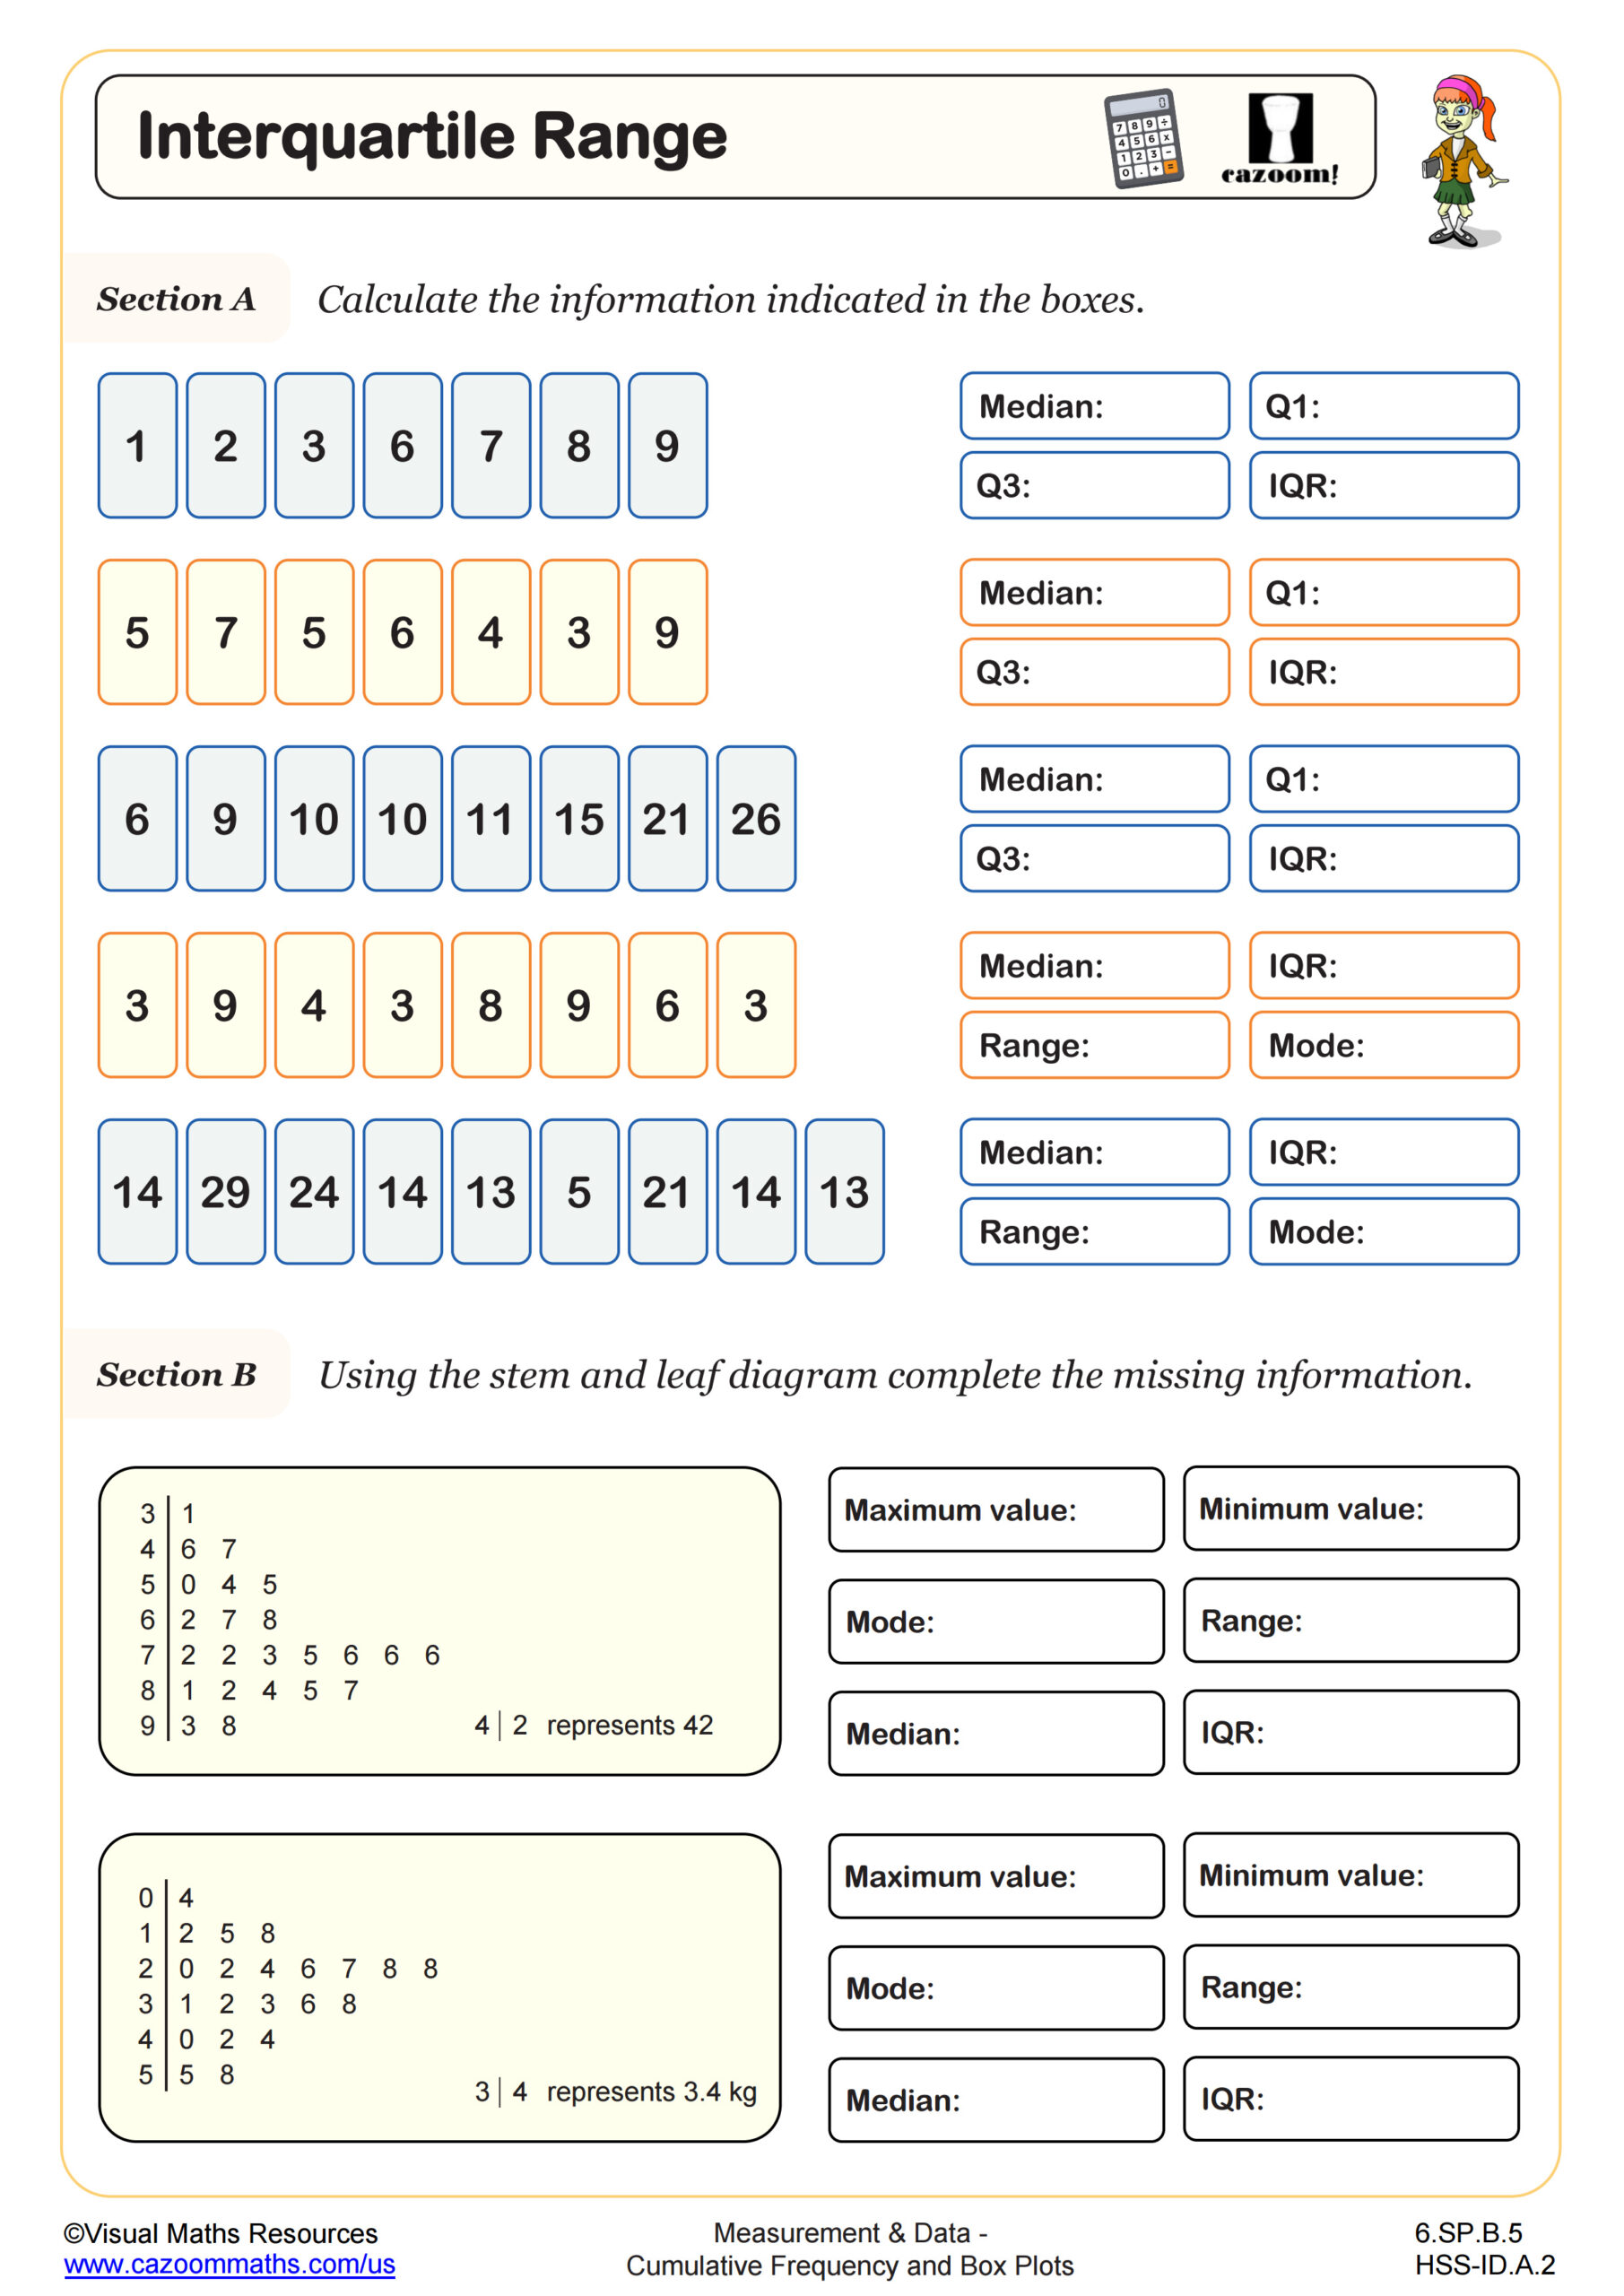
This worksheet provides some purposeful practice of drawing box plots. Section A provides the 5 data values needed and a grid for learners to draw four box plots. Section B provides two sets of data for learners to find the 5 data values and then draw box plots on a grid below. An extension question challenges learners to label the positions of the lowest value, highest value, and quartiles given a relationship.
All worksheets are created by the team of experienced teachers at Cazoom Math.

RELATED TO Constructing Box Plots WORKSHEET
Frequently Asked Questions
This constructing box plots worksheet is designed for students in 6th Grade and Algebra I and aligns with Common Core State Standards.