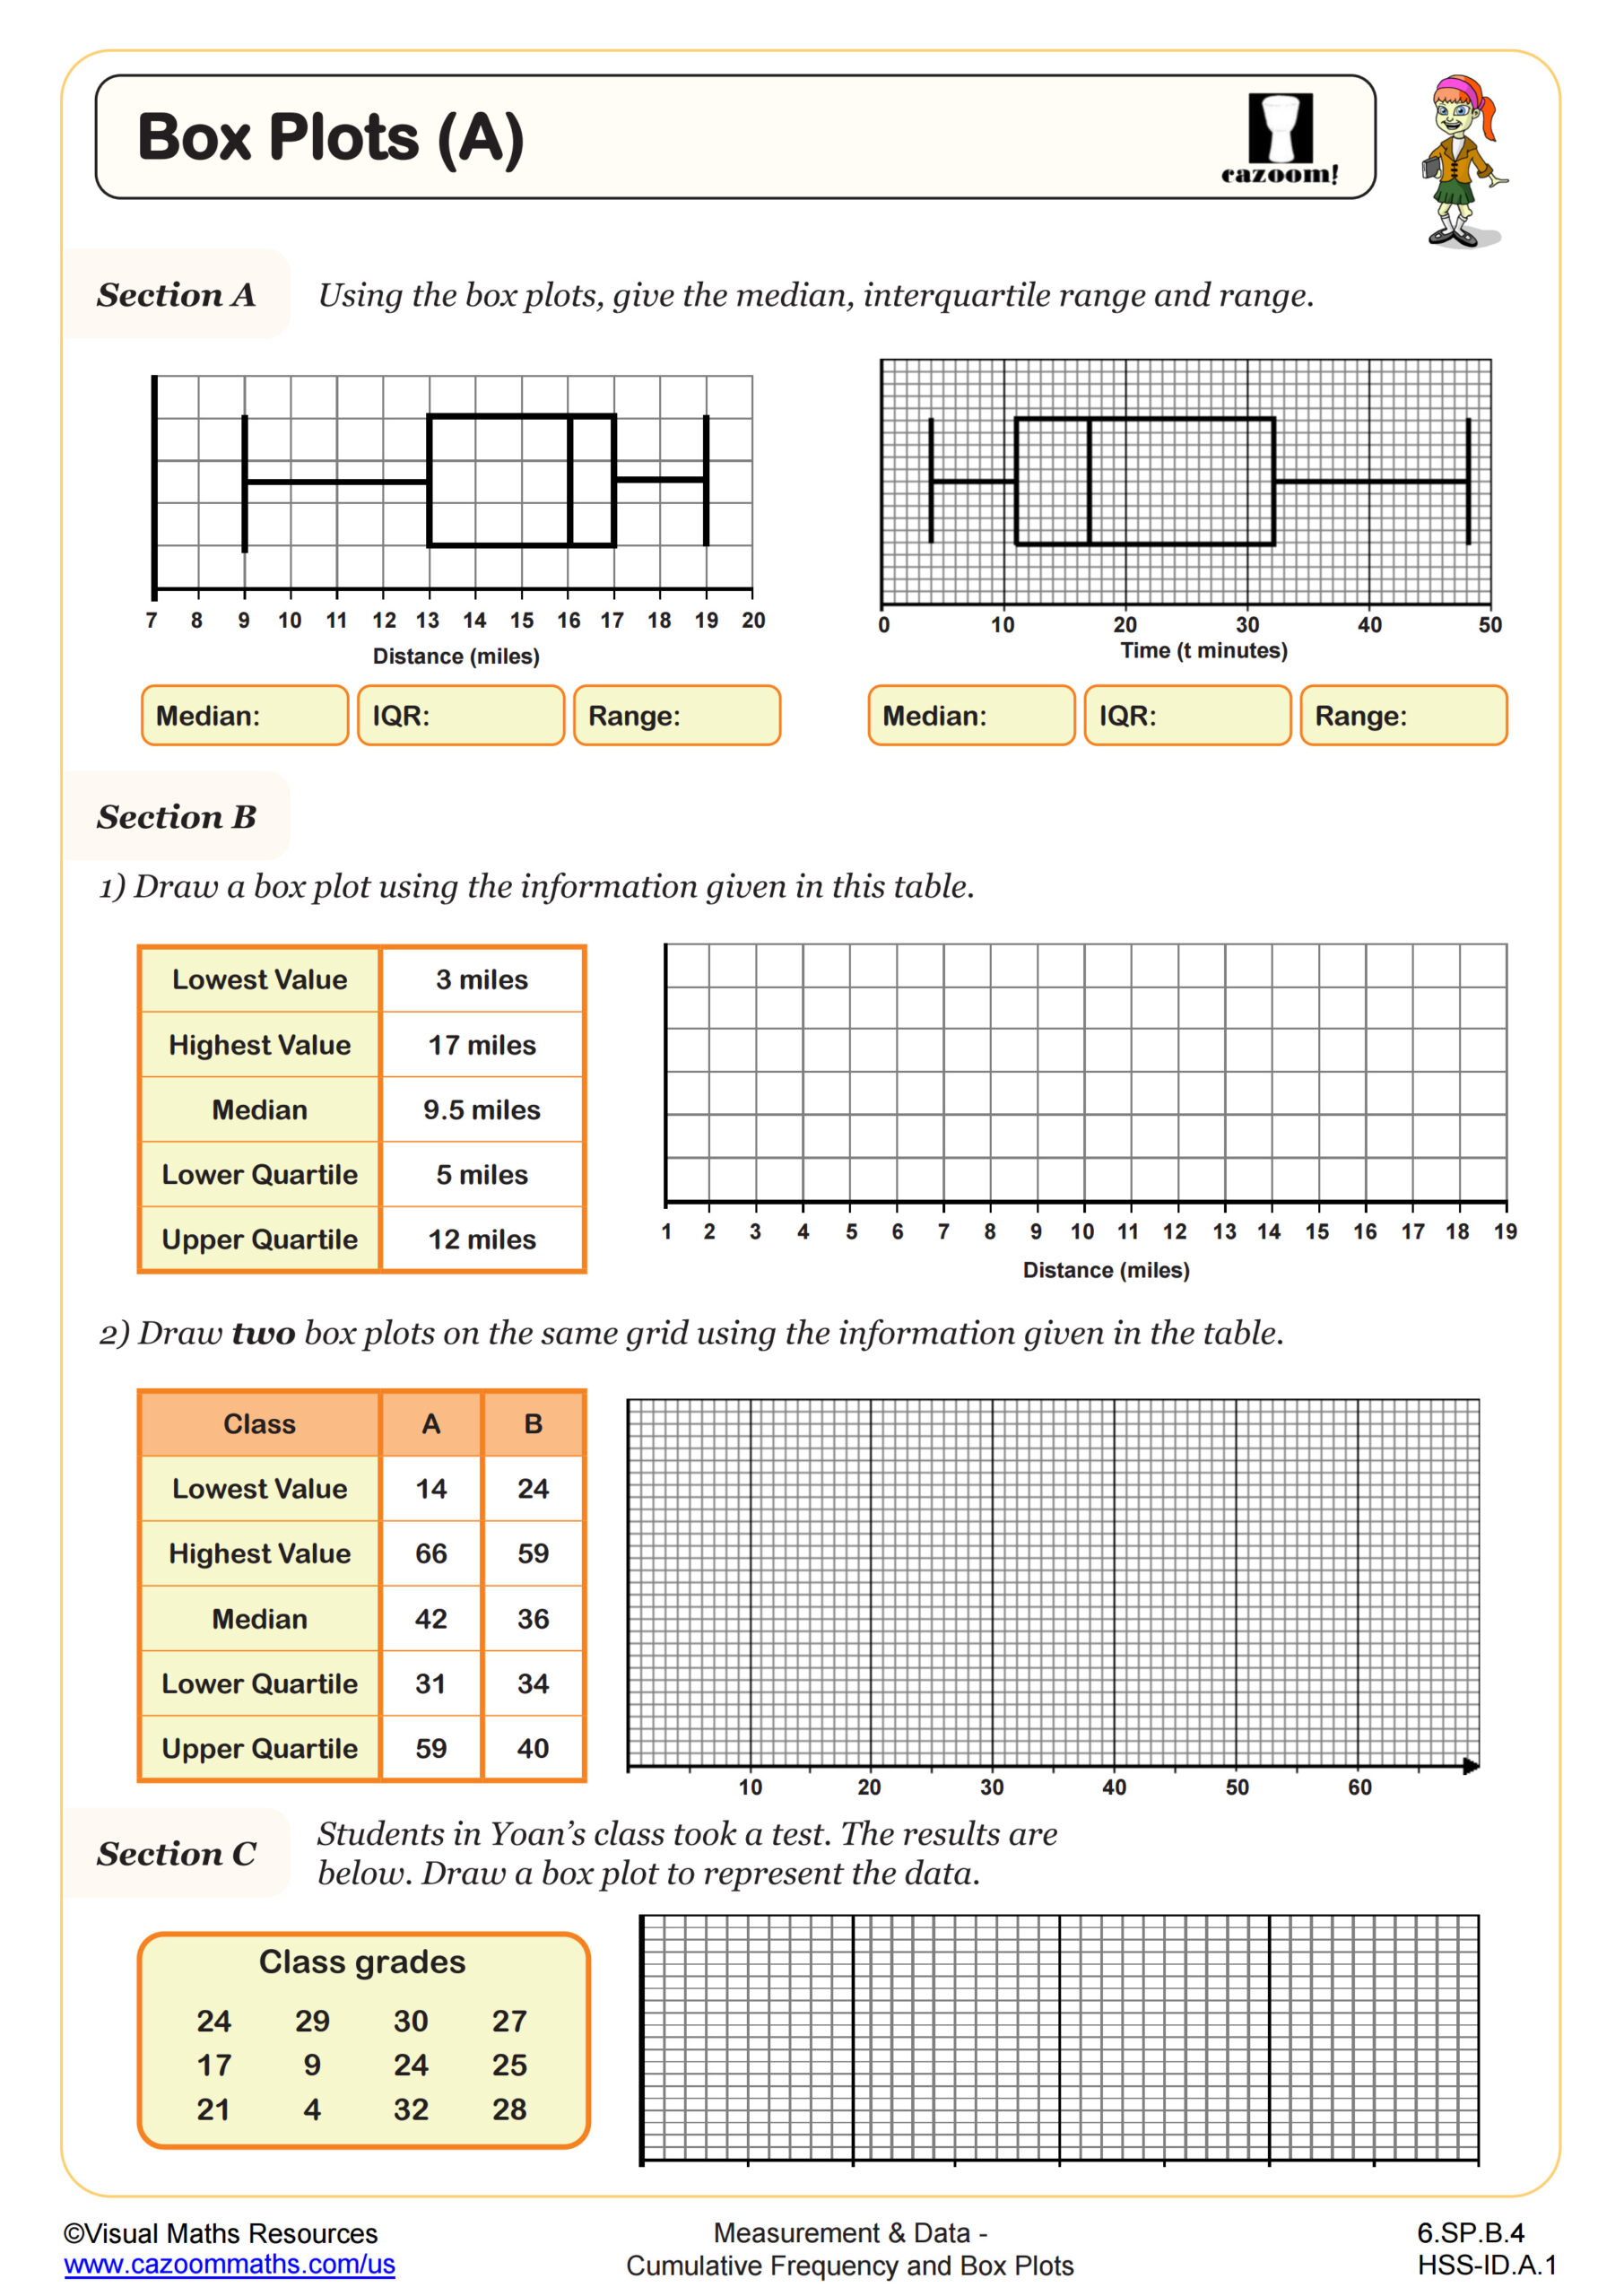
Drawing Box Plots from Cumulative Frequency Diagrams WORKSHEET
Suitable for Grades: Algebra I
CCSS: HSS.ID.A.1, HSS.ID.B.5
CCSS Description: Represent data with plots on the real number line (dot plots, histograms, and box plots).
Summarize categorical data for two categories in two-way frequency tables. Interpret relative frequencies in the context of the data (including joint, marginal, and conditional relative frequencies). Recognize possible associations and trends in the data.
Summarize categorical data for two categories in two-way frequency tables. Interpret relative frequencies in the context of the data (including joint, marginal, and conditional relative frequencies). Recognize possible associations and trends in the data.
Drawing Box Plots from Cumulative Frequency Diagrams WORKSHEET DESCRIPTION
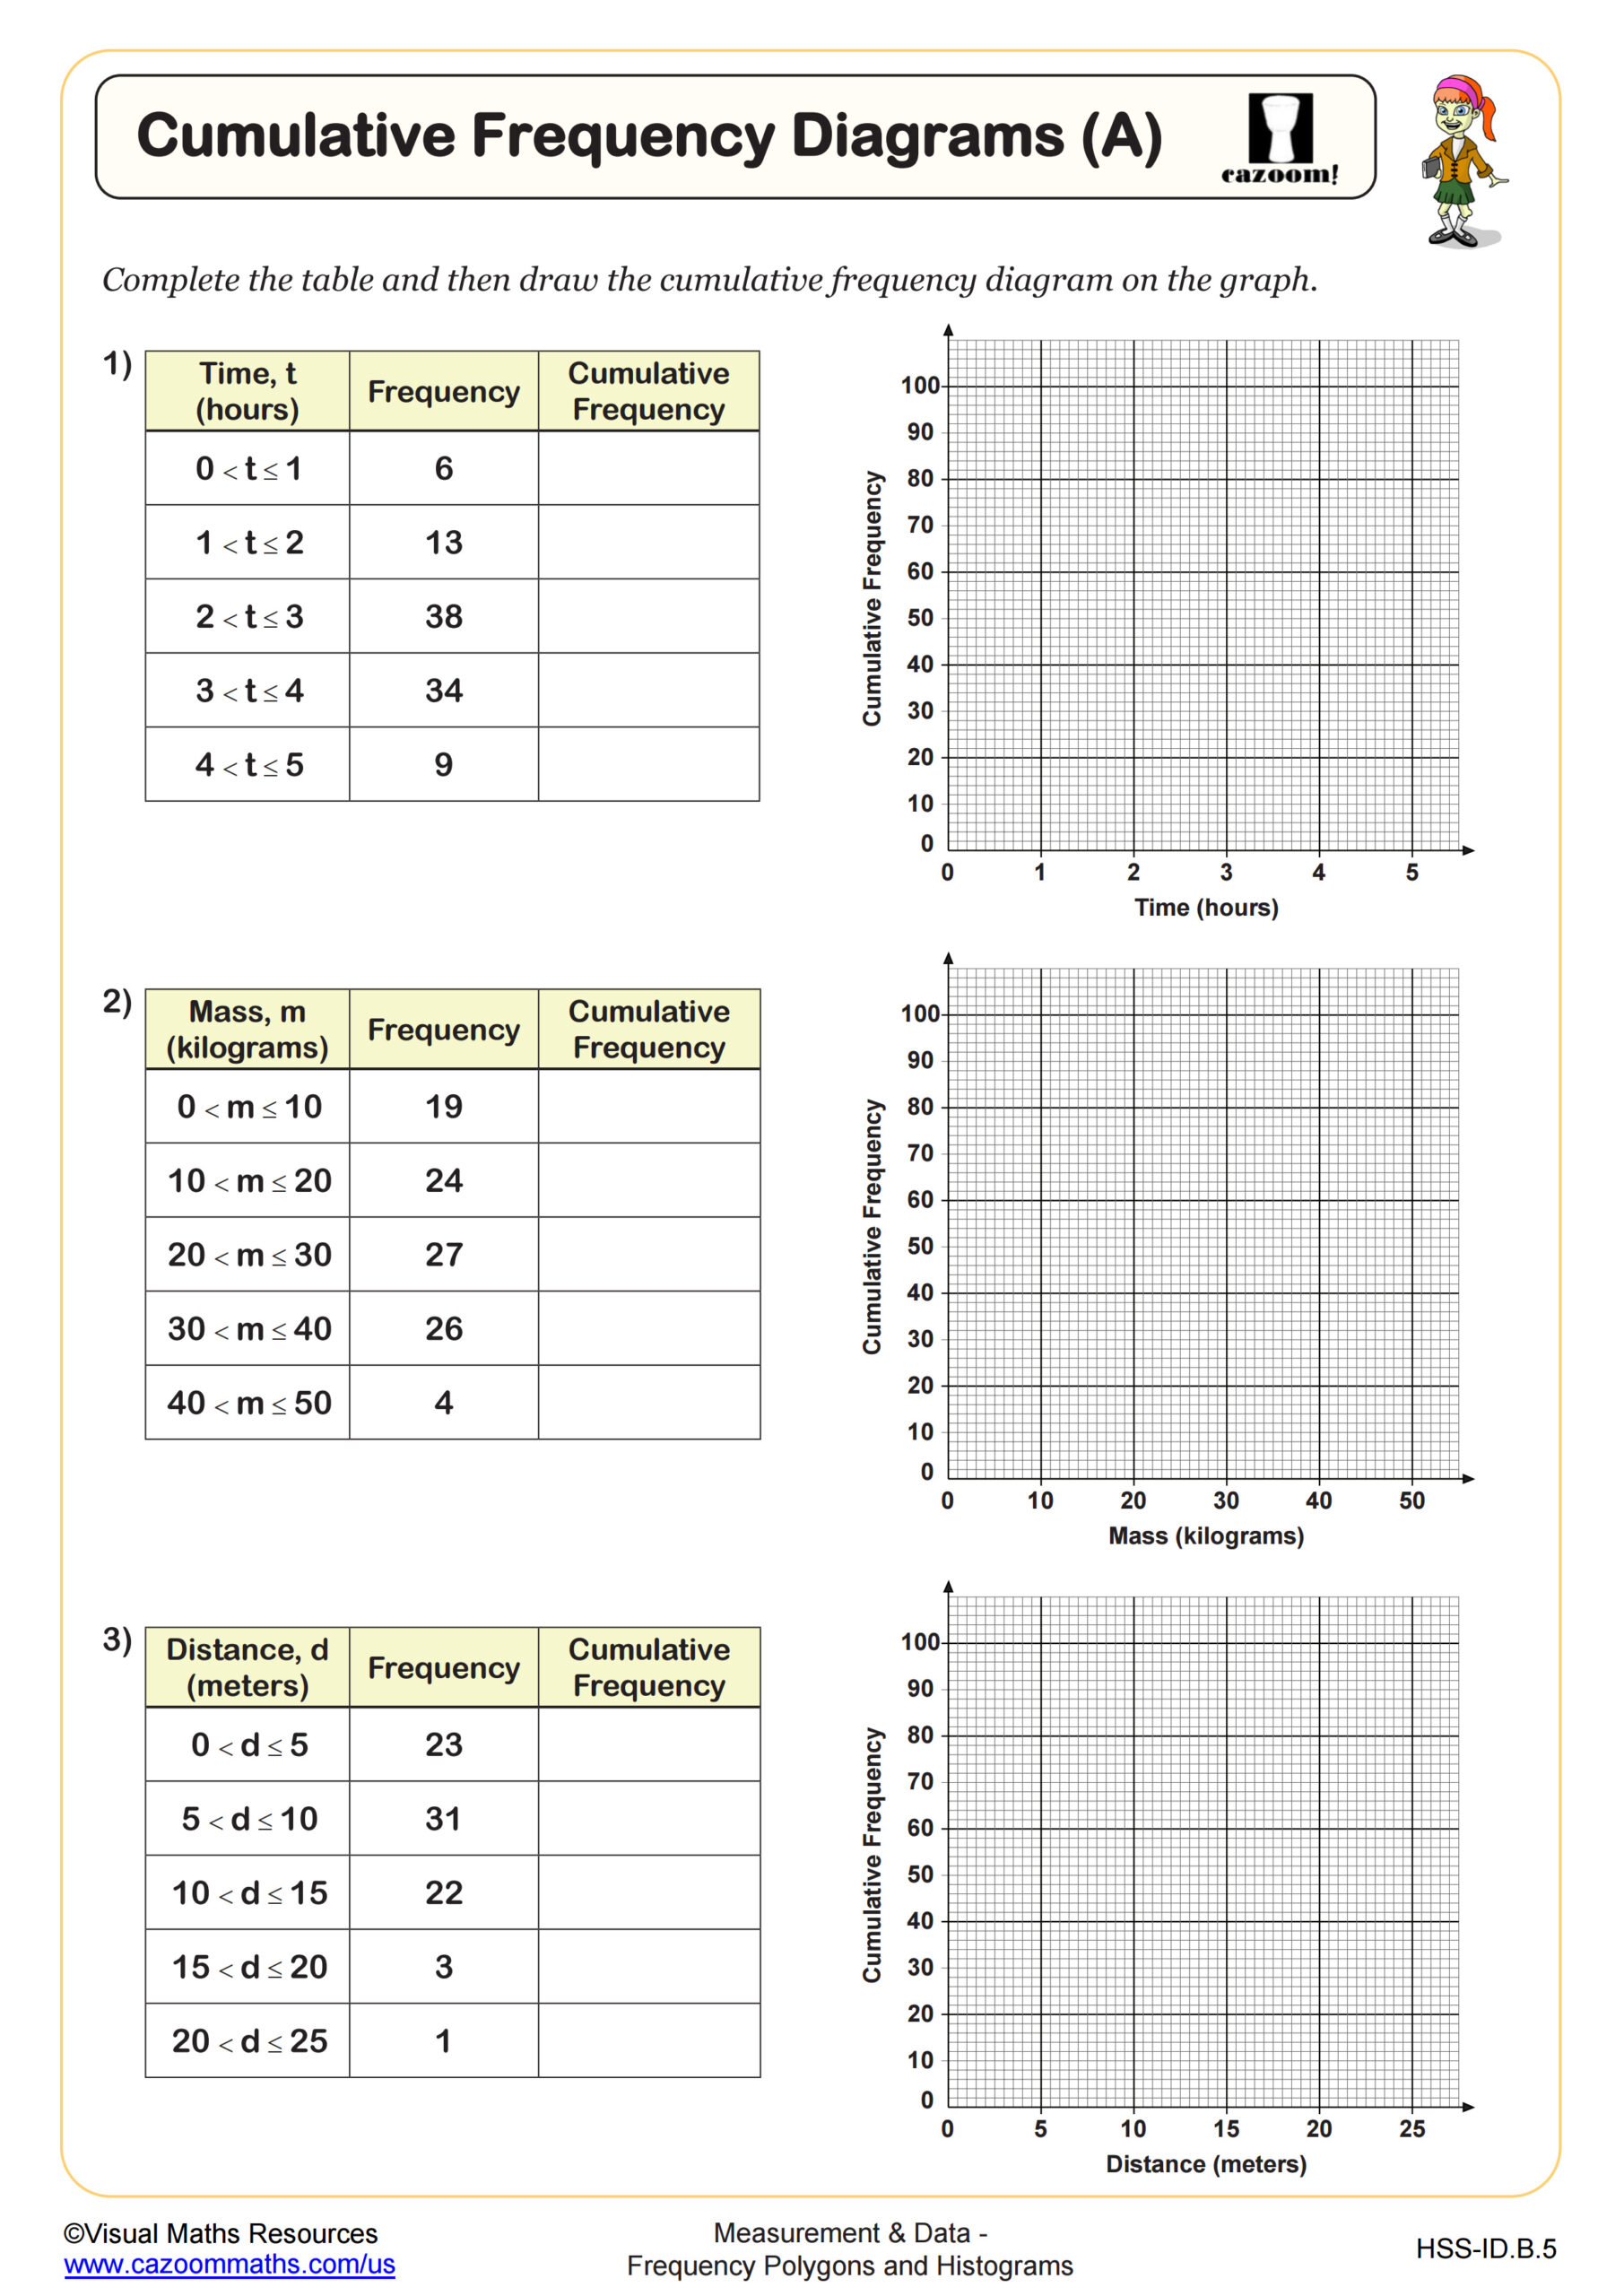
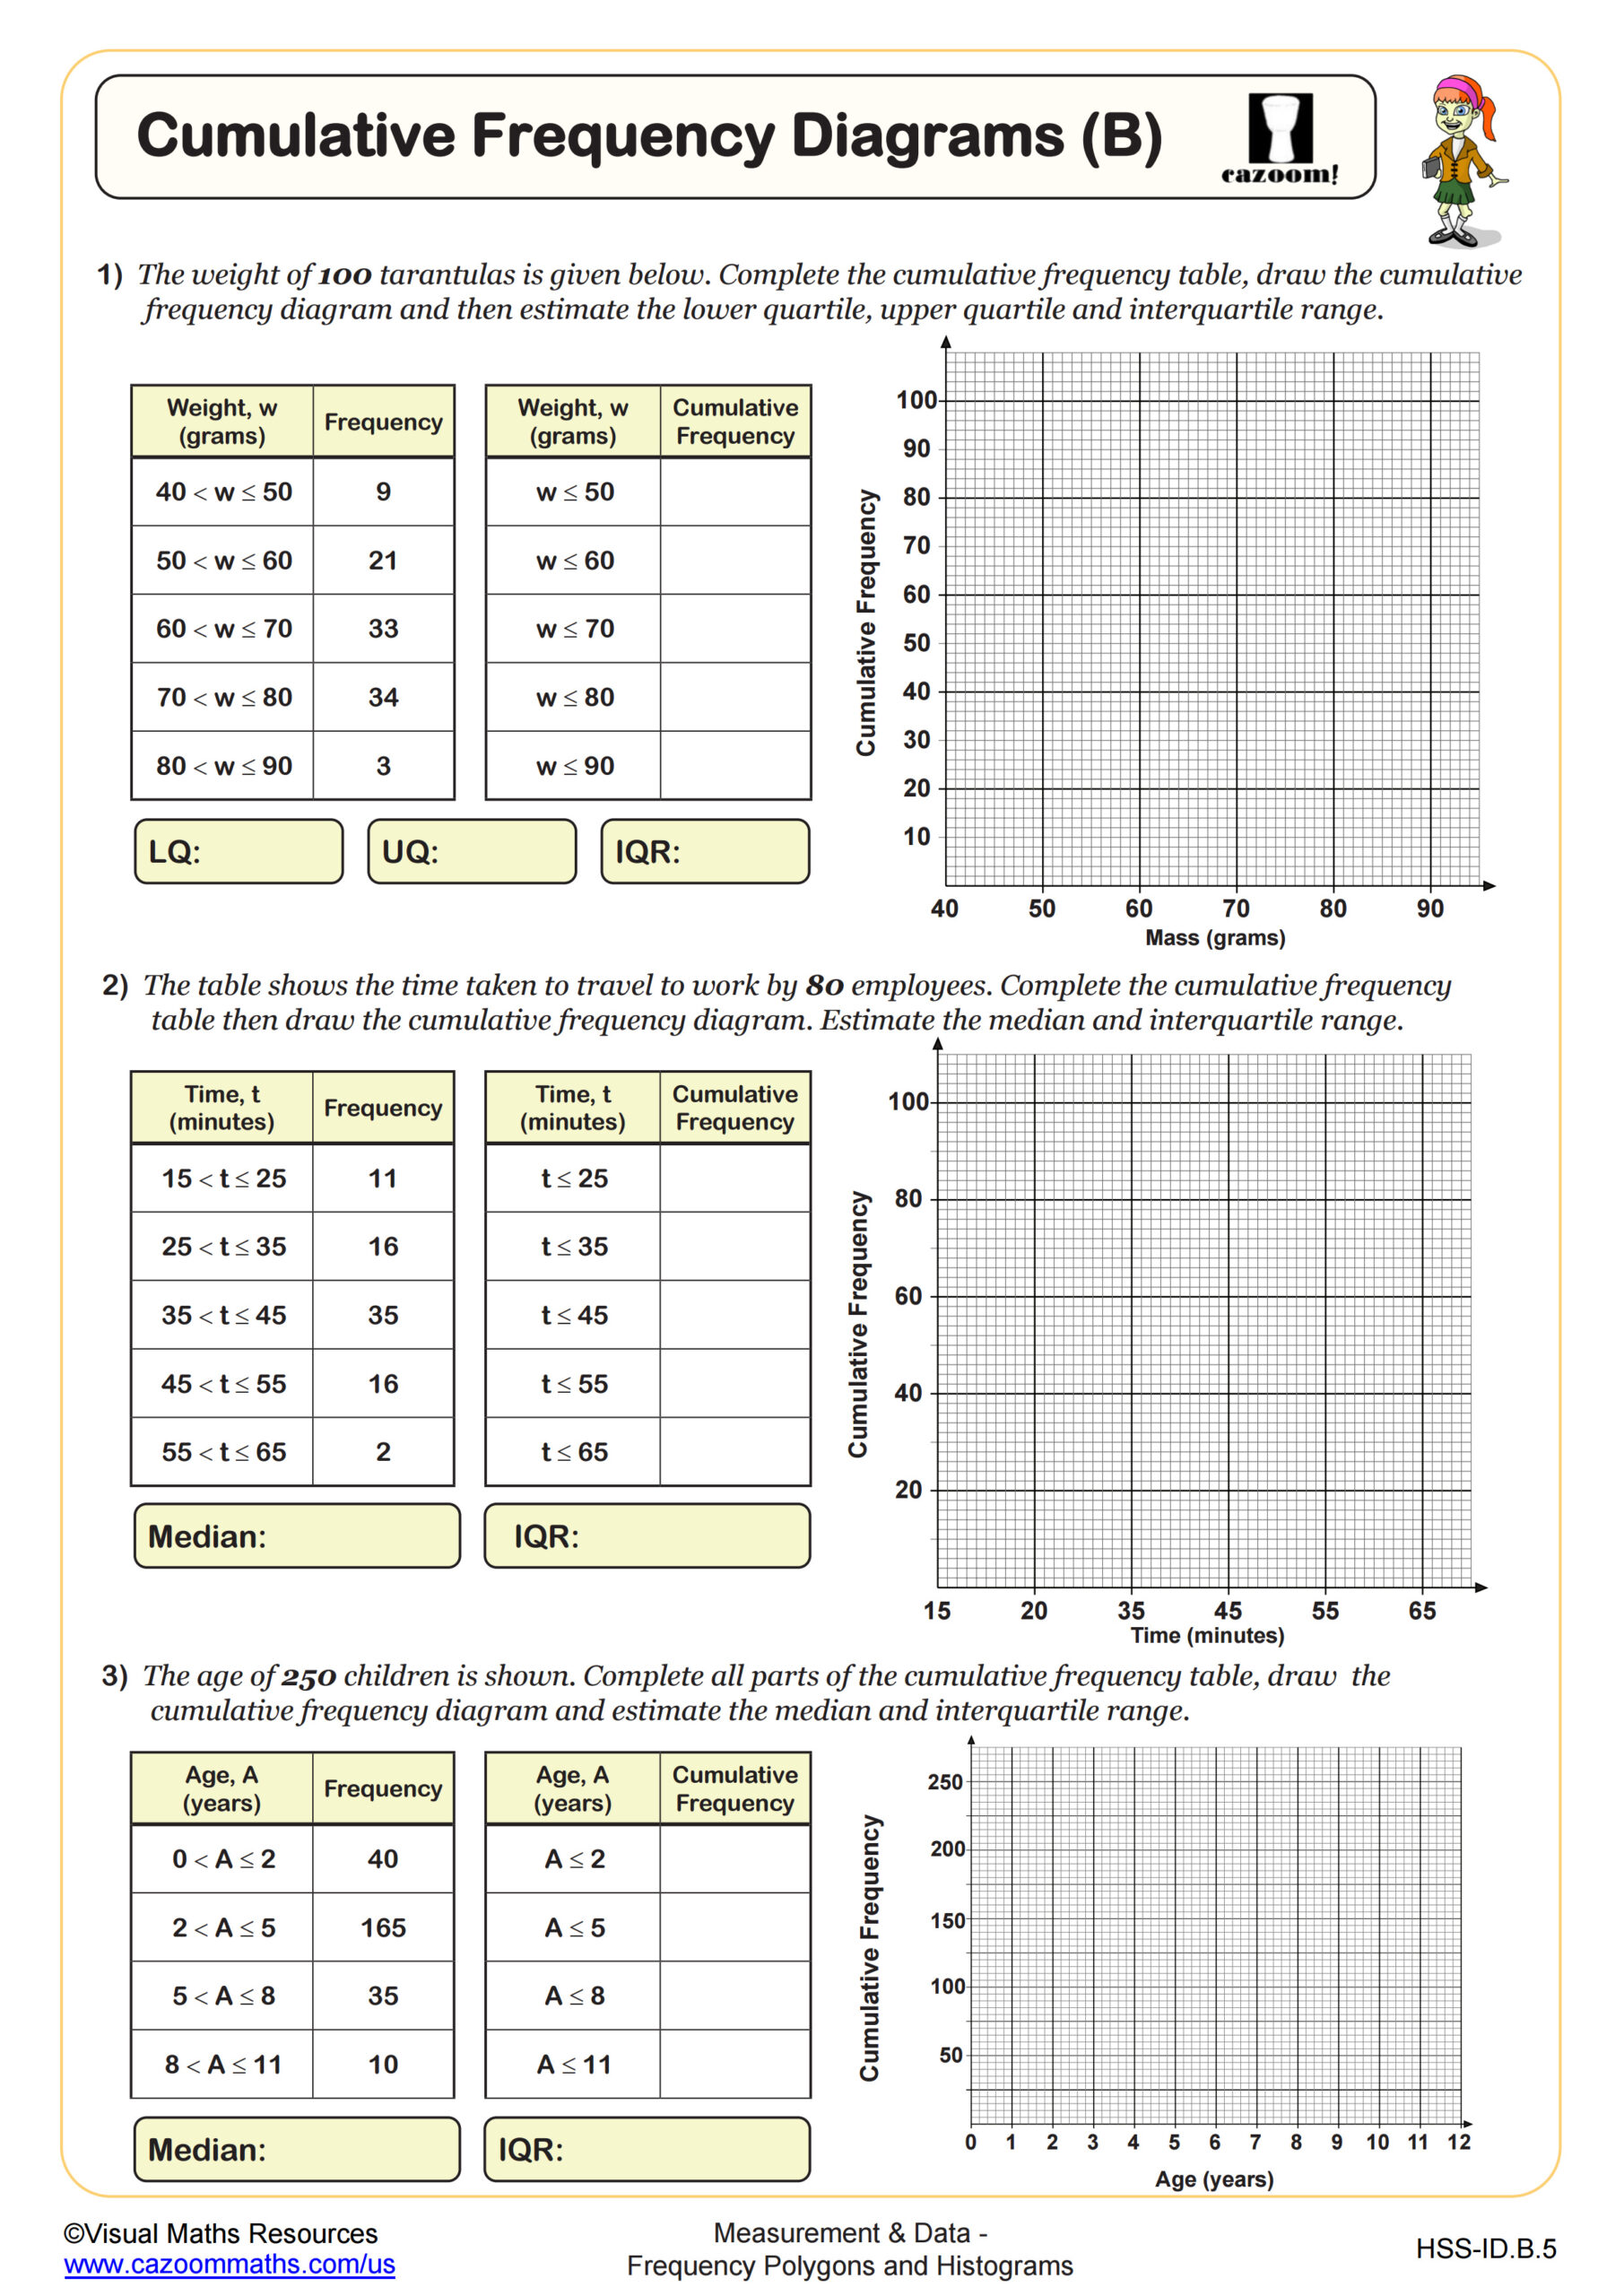
This worksheet is designed to help build the skill of drawing a box plot from a cumulative frequency diagram. In section A, learners are given two cumulative frequency diagrams and below each one is a separate axes for box plot. In section B, learners are given a grouped frequency table and need to draw a cumulative frequency diagram before then constructing a box plot.
All worksheets are created by the team of experienced teachers at Cazoom Math.

RELATED TO Drawing Box Plots from Cumulative Frequency Diagrams WORKSHEET
Frequently Asked Questions
This drawing box plots from cumulative frequency diagrams worksheet is designed for students in Algebra I and aligns with Common Core State Standards.