Back to:
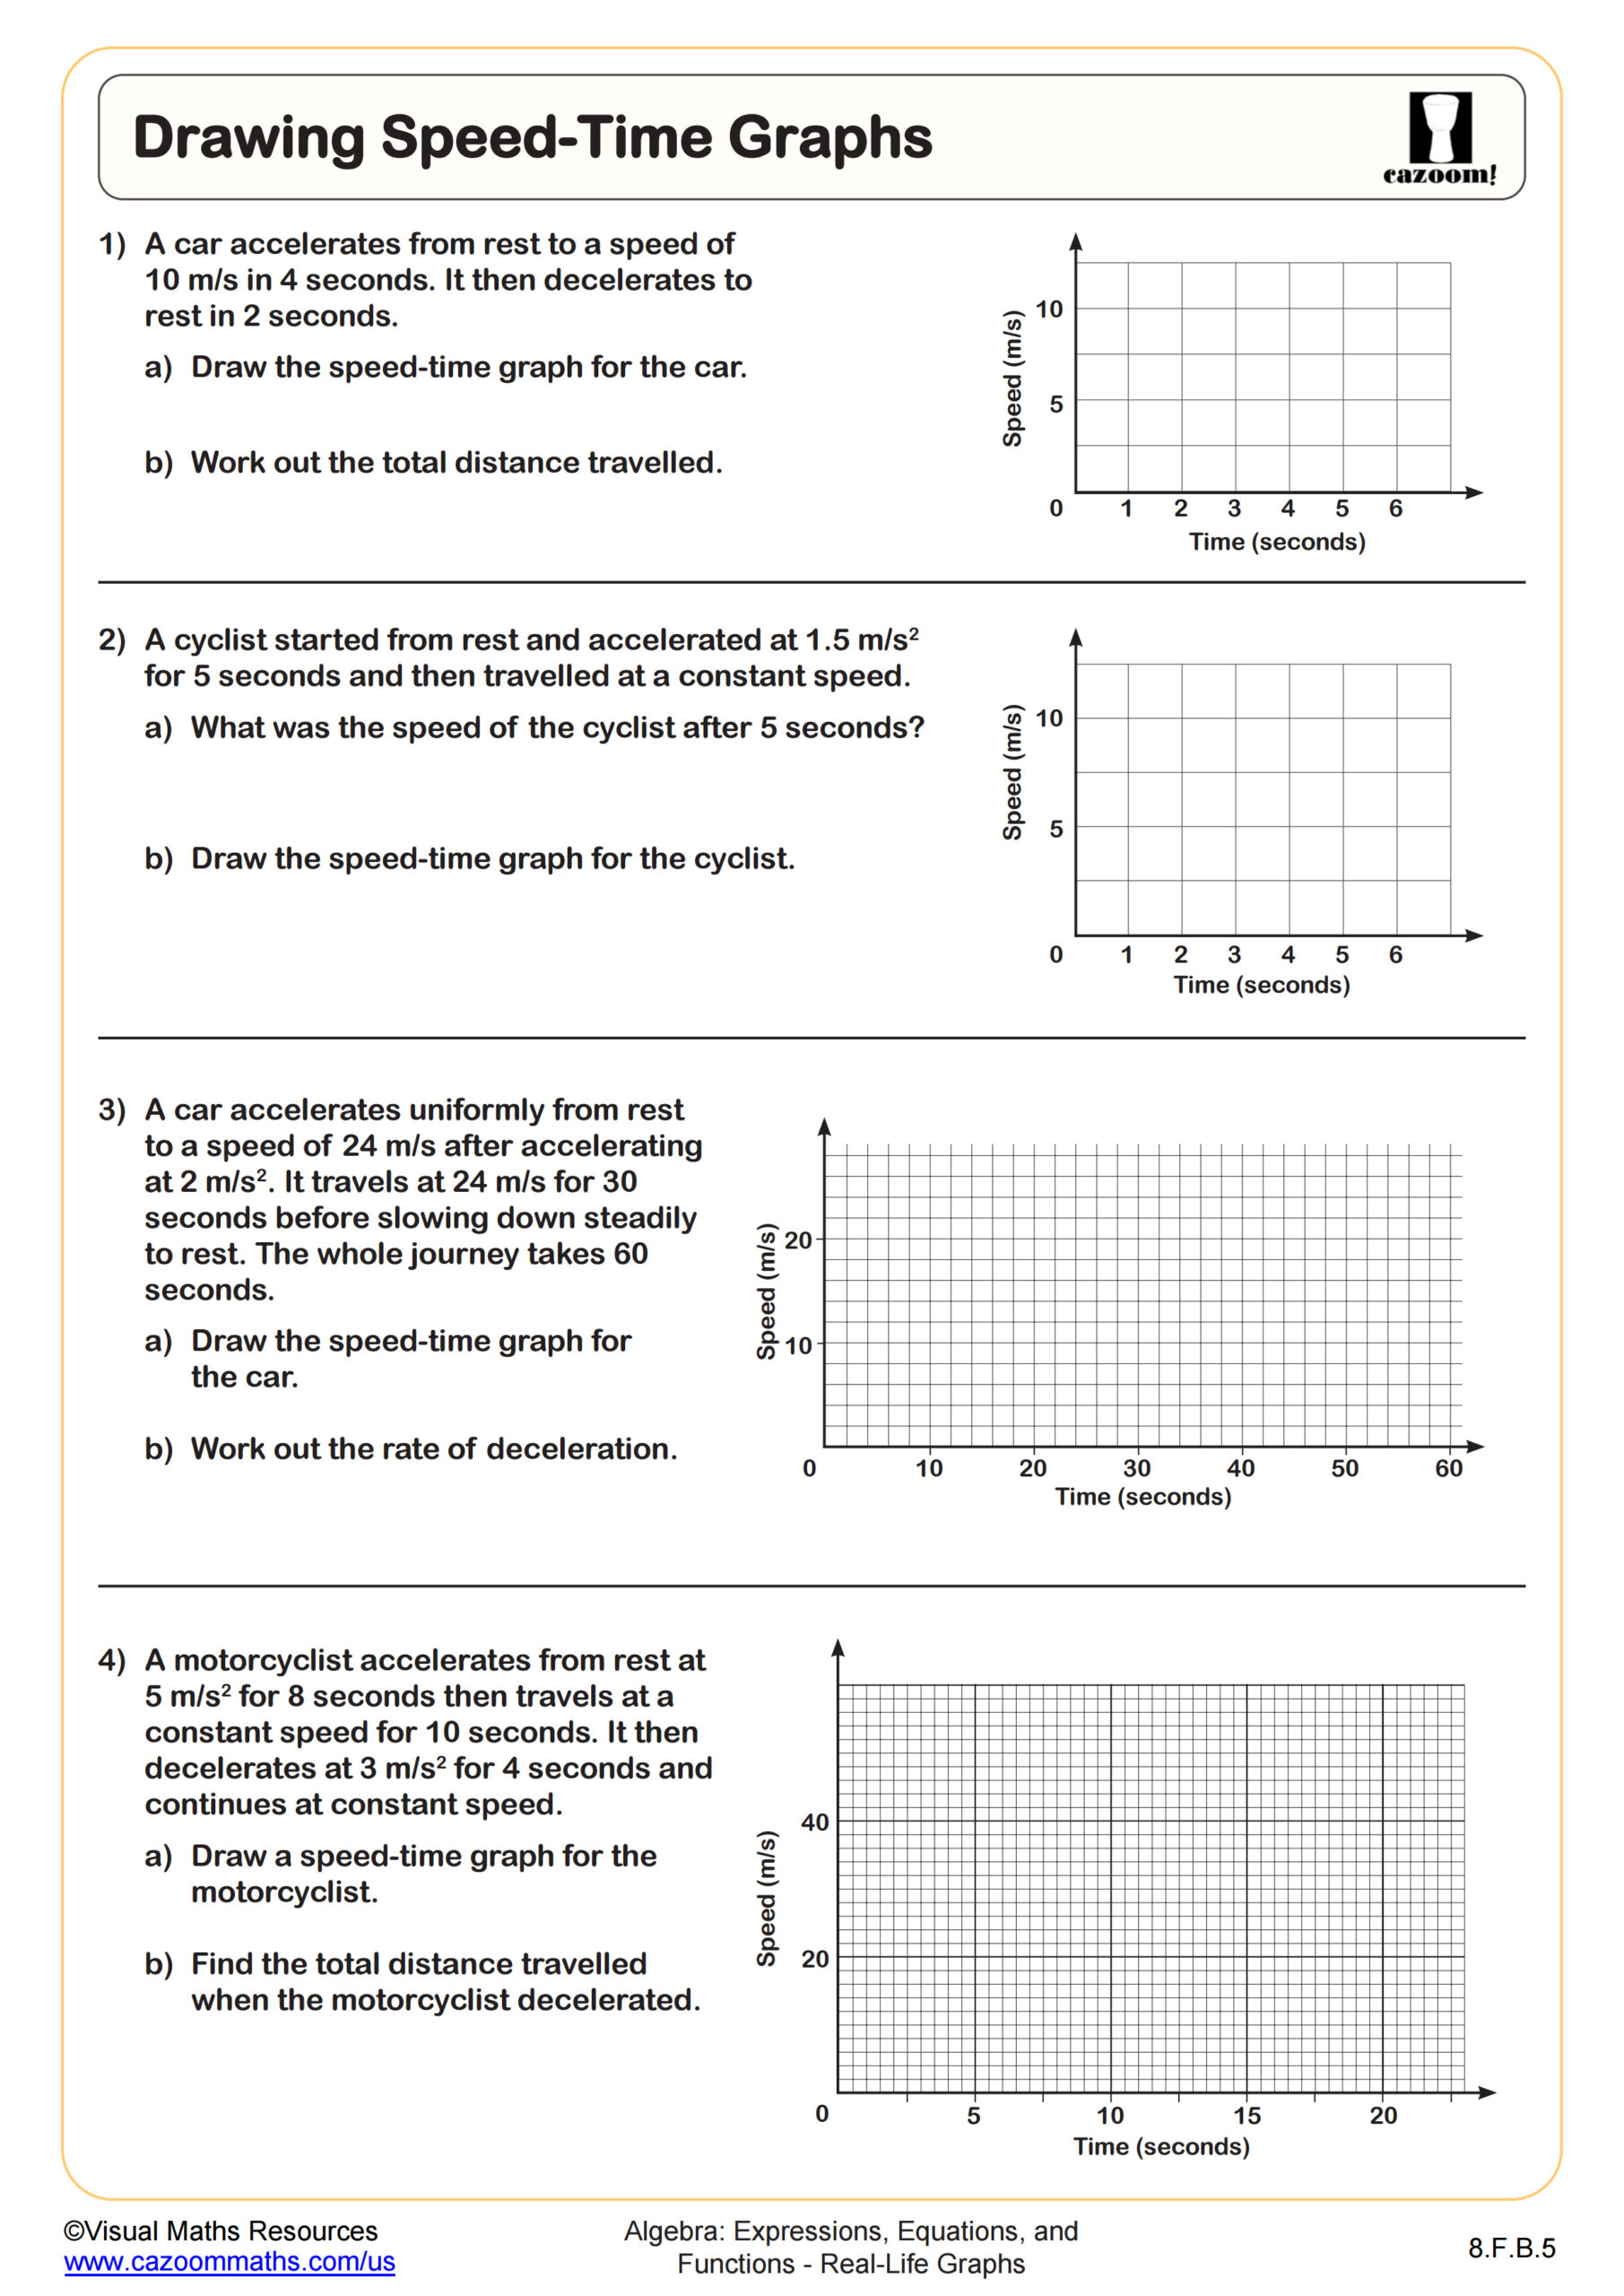
Drawing Speed-Time Graphs WORKSHEET
Suitable for Grades: 8th Grade
CCSS: 8.F.B.5
CCSS Description: Describe qualitatively the functional relationship between two quantities by analyzing a graph (e.g., where the function is increasing or decreasing, linear or nonlinear). Sketch a graph that exhibits the qualitative features of a function that has been described verbally.
Drawing Speed-Time Graphs WORKSHEET DESCRIPTION
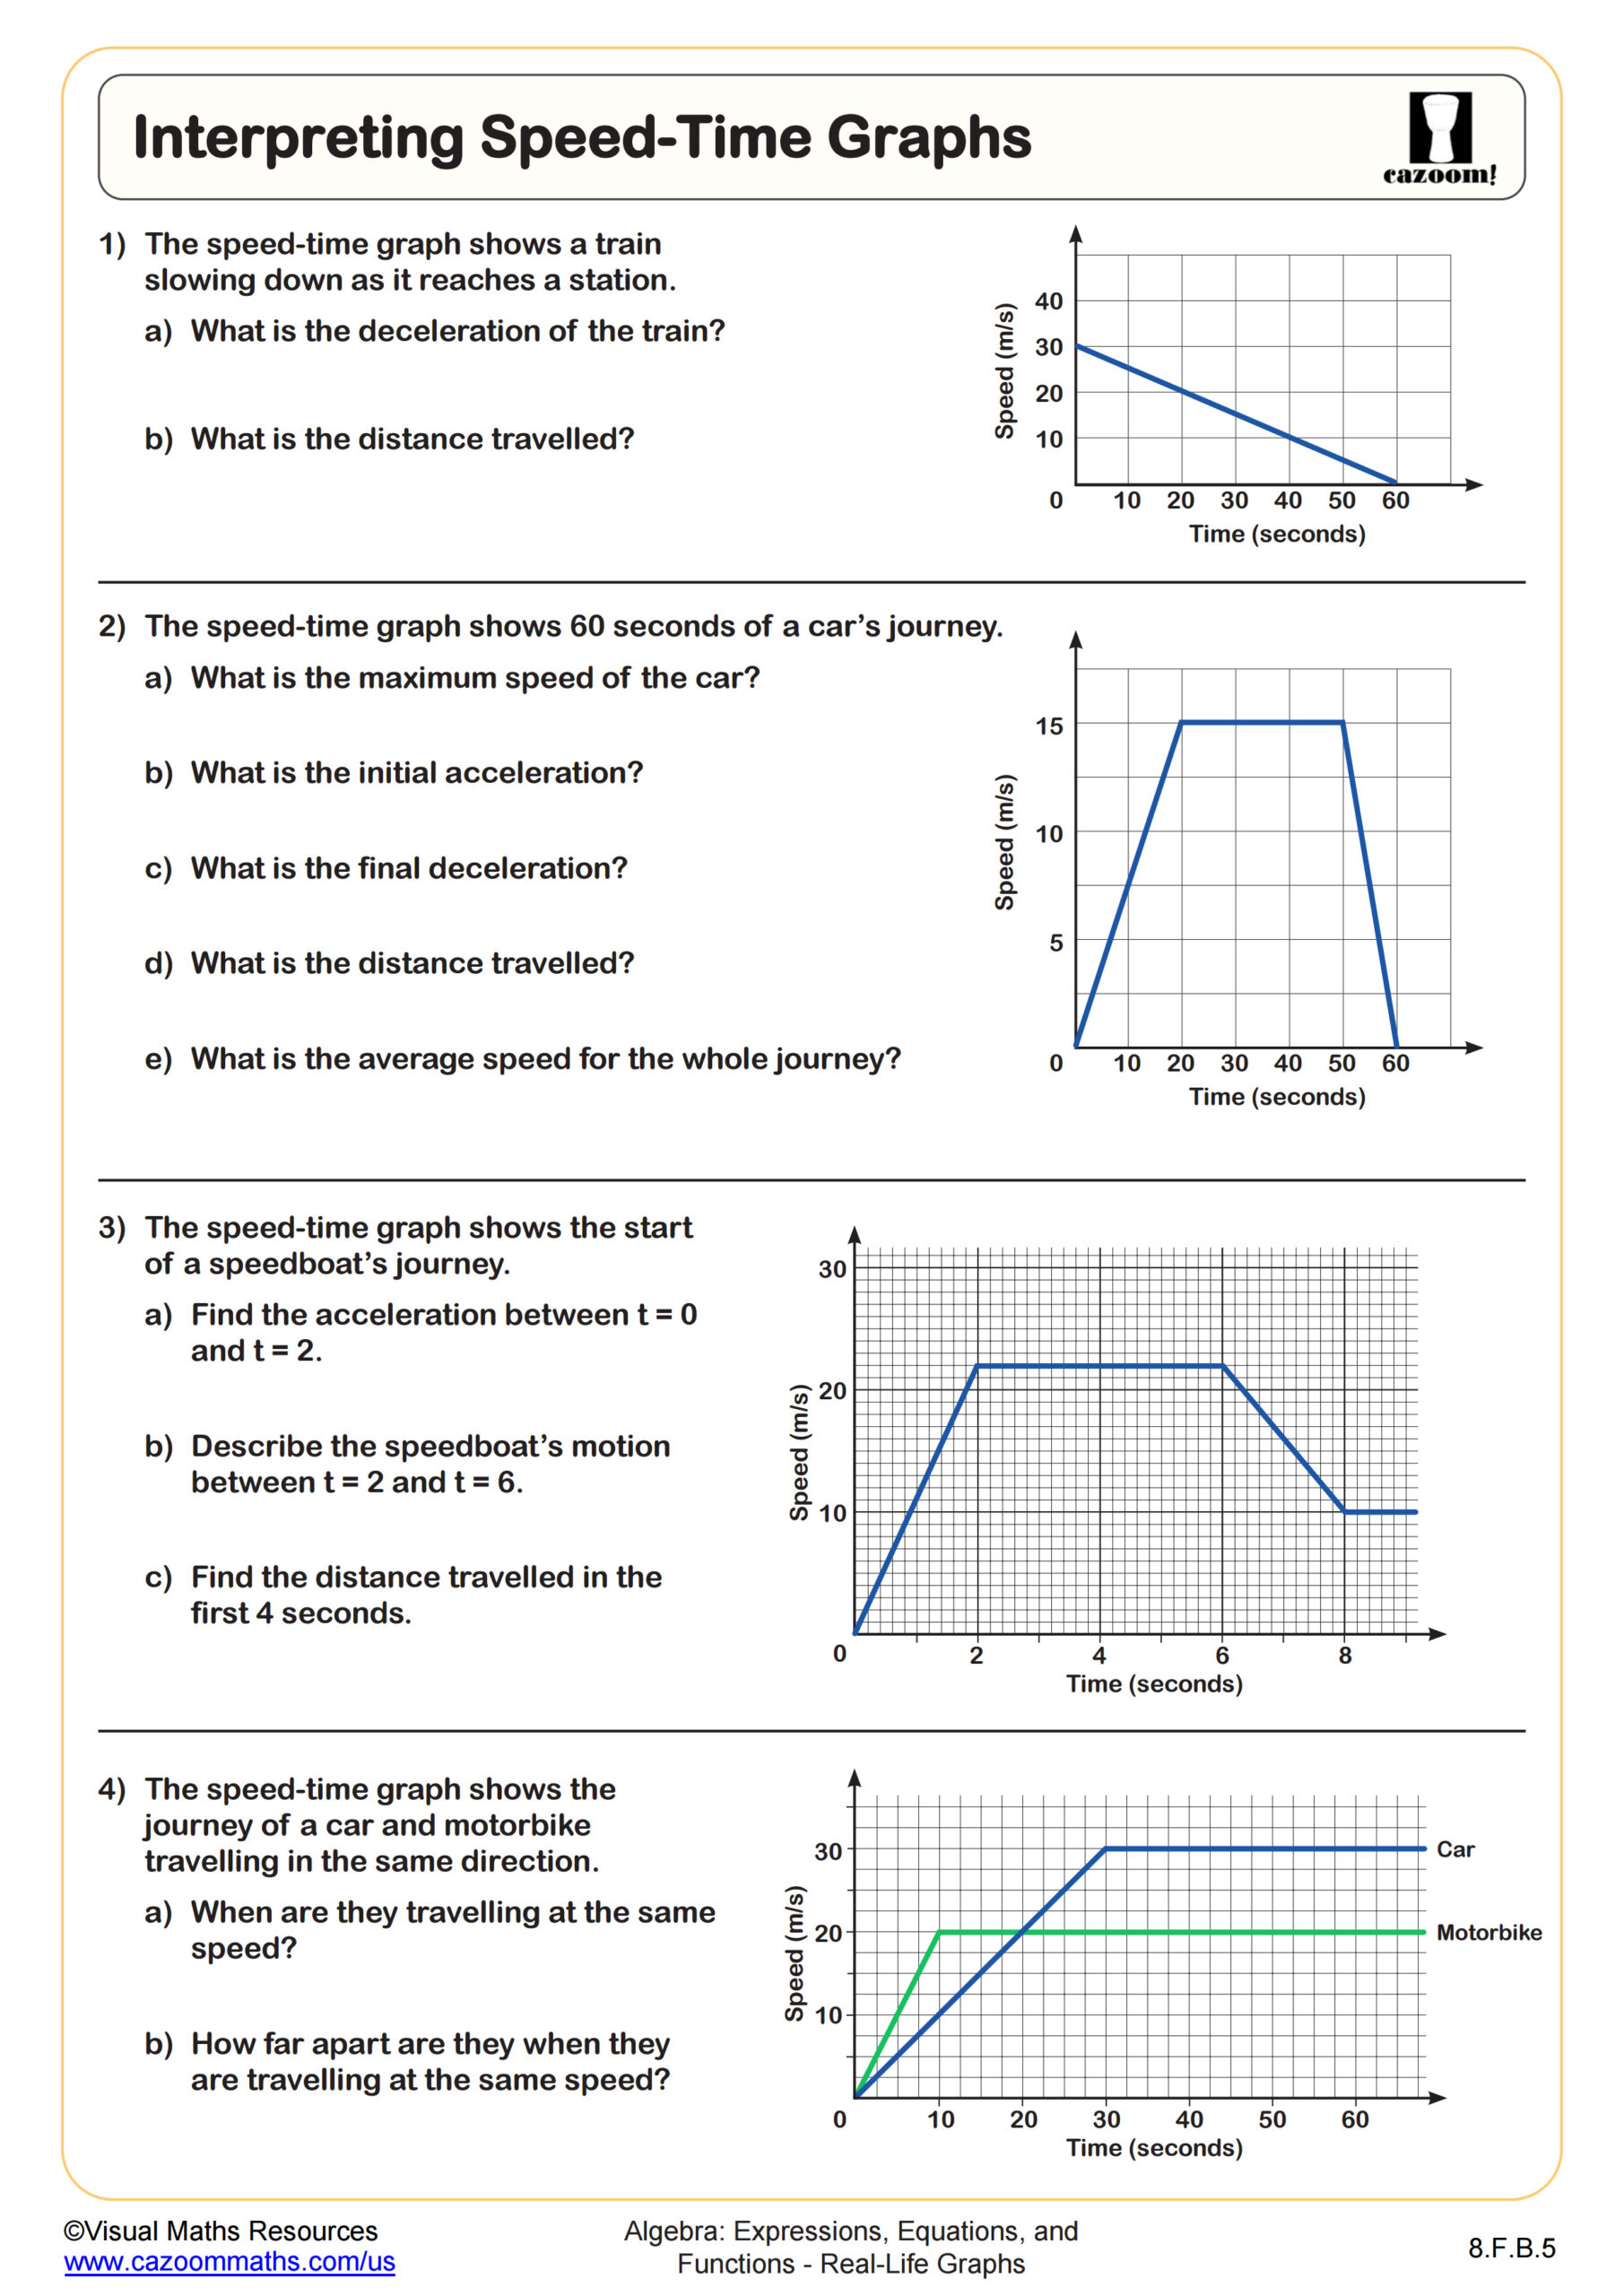
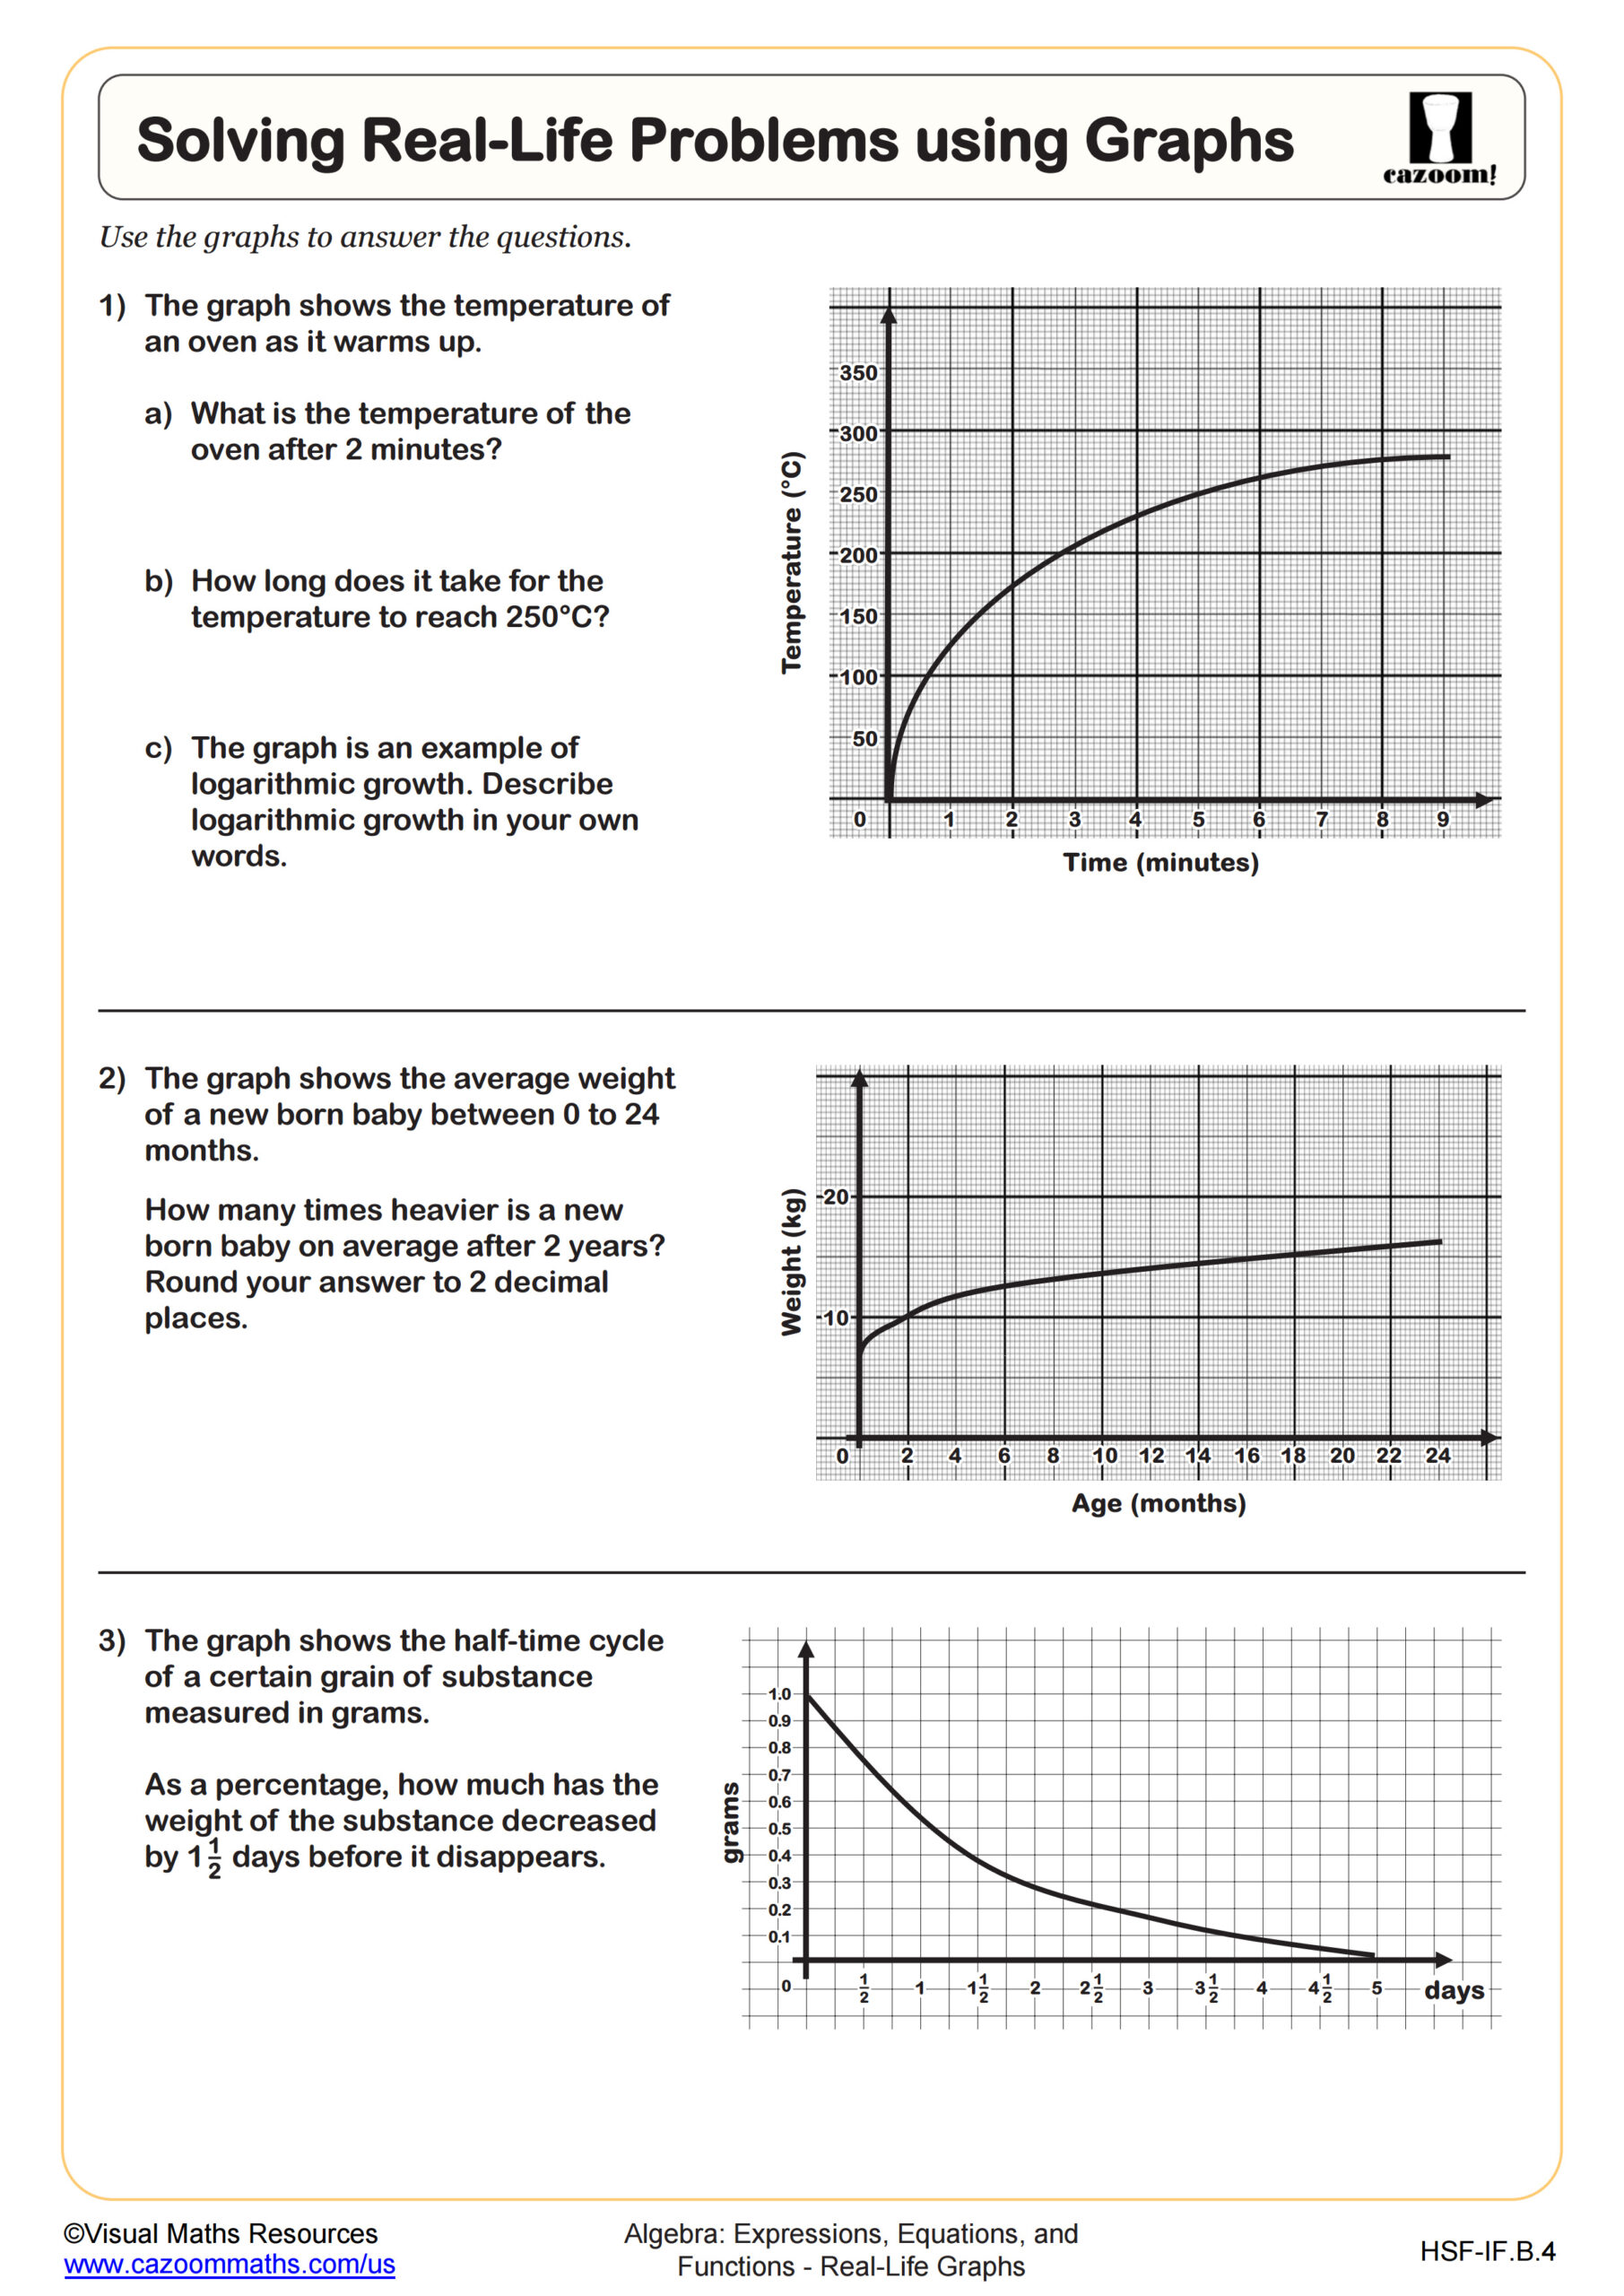
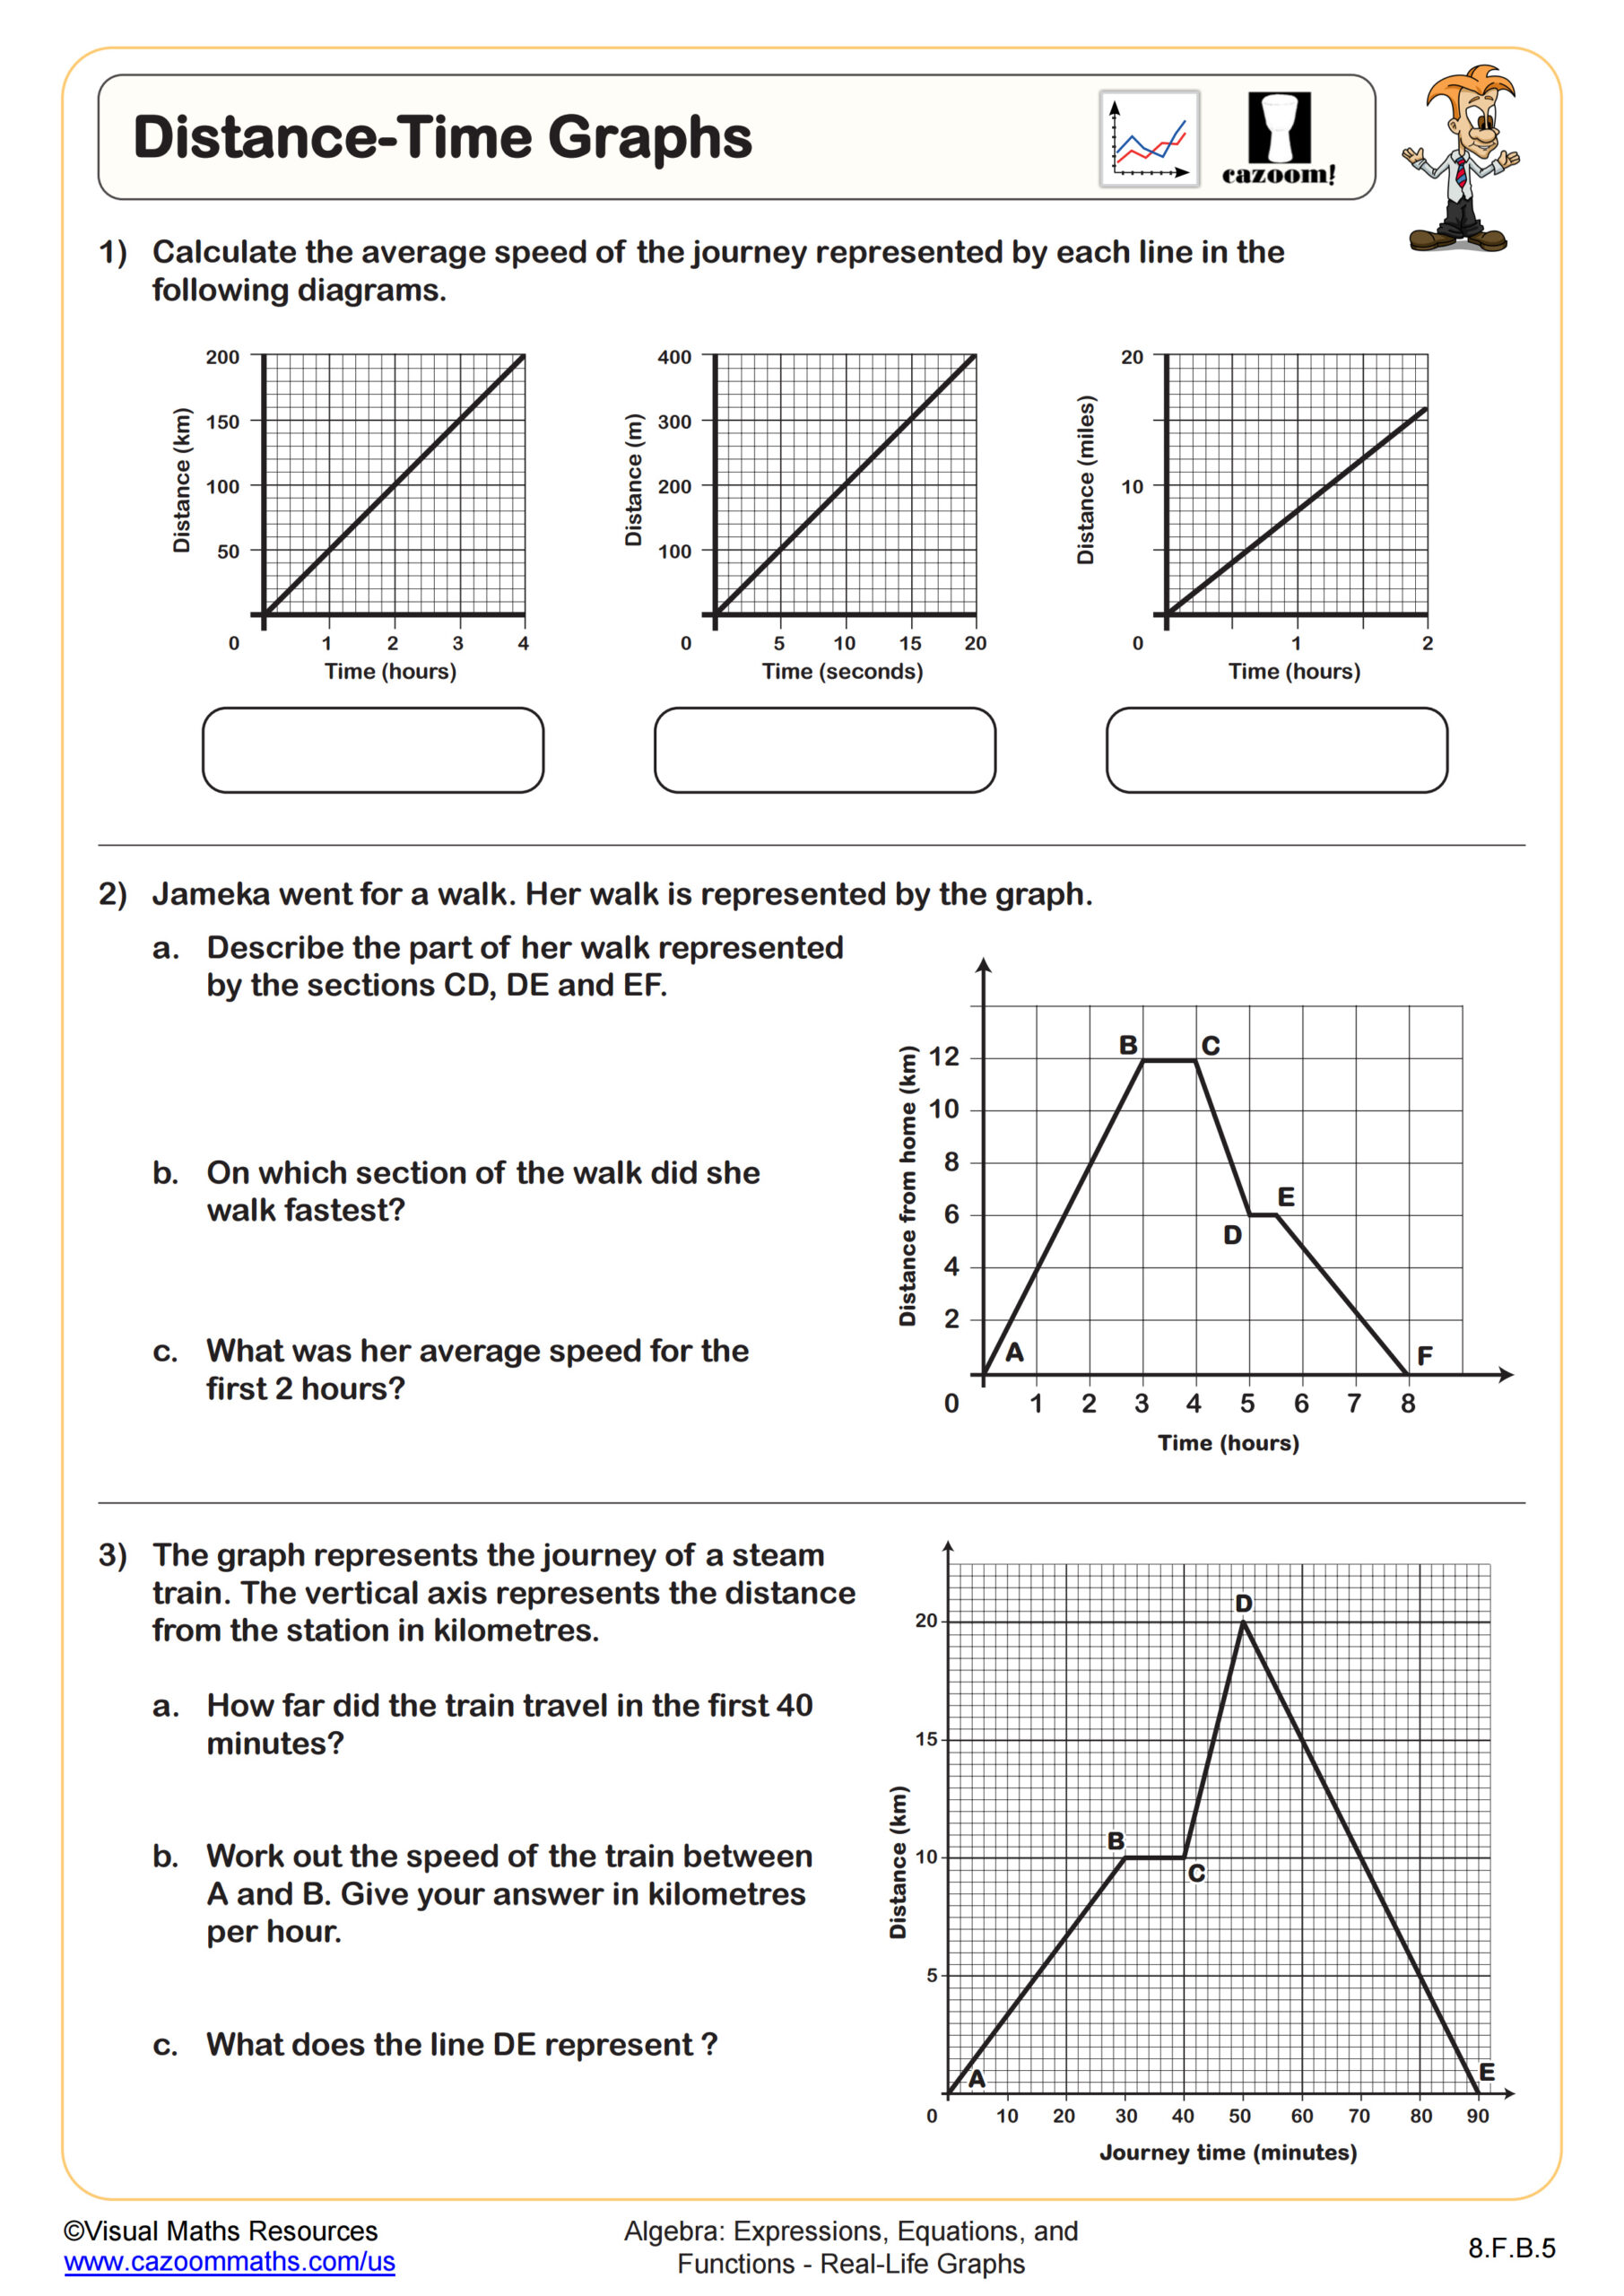
This worksheet gives some practice or drawing speed-time graphs on given axes. Learners will be provided with information such as acceleration, periods of constant speed or distance travelled in a given time, and will have to complete the graphs for described journeys.

RELATED TO Drawing Speed-Time Graphs WORKSHEET
Frequently Asked Questions
This drawing speed-time graphs worksheet is designed for students in 8th Grade and aligns with Common Core State Standards.


