Expected Outcomes WORKSHEET
Expected Outcomes WORKSHEET DESCRIPTION
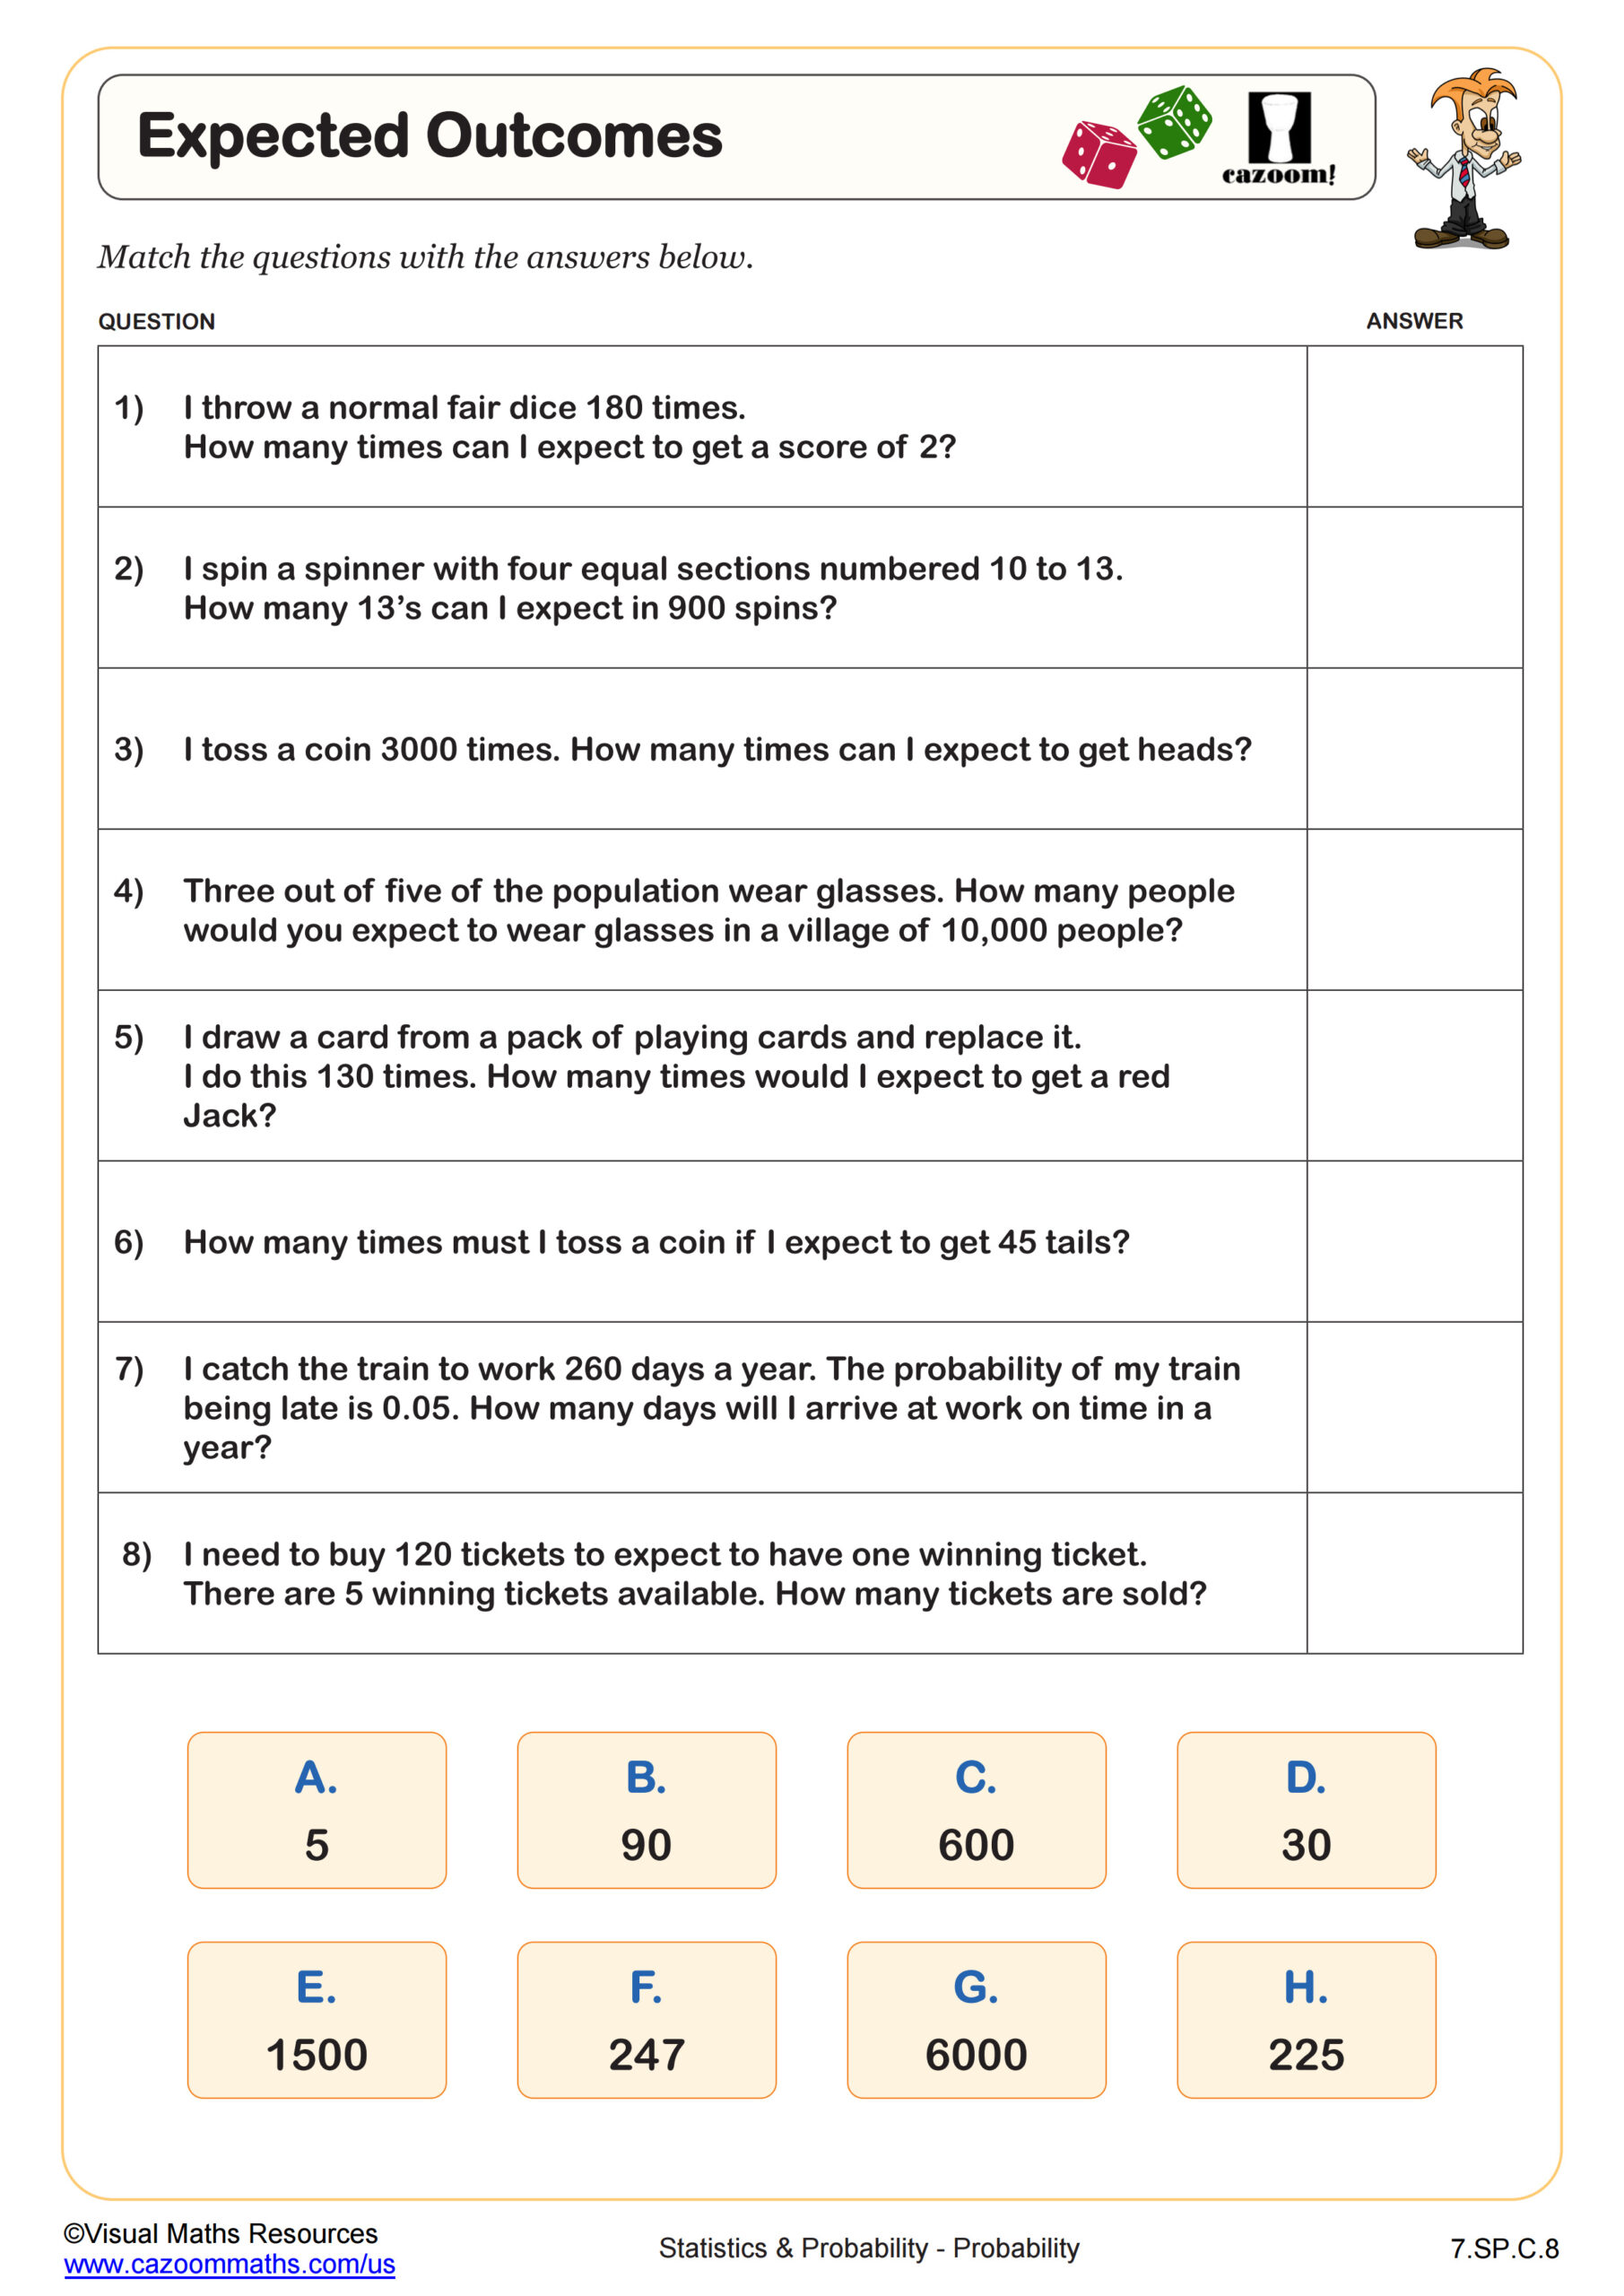
Students will calculate expected frequencies using theoretical probability to complete this worksheet. Students will have to calculate the theoretical probability where it is not given. Probabilities are given as fractions, and in one case, as a decimal.
The worksheet consists of eight questions and eight answers that students will match. Questions include “Three out of five of the population wear glasses. How many people would you expect to wear glasses in a village of 10,000 people?” and “I catch the train to work 260 days a year. The probability of my train being late is 0.05. How many days will I arrive at work on time in a year?” Students will also use an expected frequency to calculate how many times an event must have occurred.
RELATED TO Expected Outcomes WORKSHEET
Frequently Asked Questions
This expected outcomes worksheet is designed for students in 7th Grade and aligns with Common Core State Standards.
