Experimental Probability WORKSHEET
Experimental Probability WORKSHEET DESCRIPTION
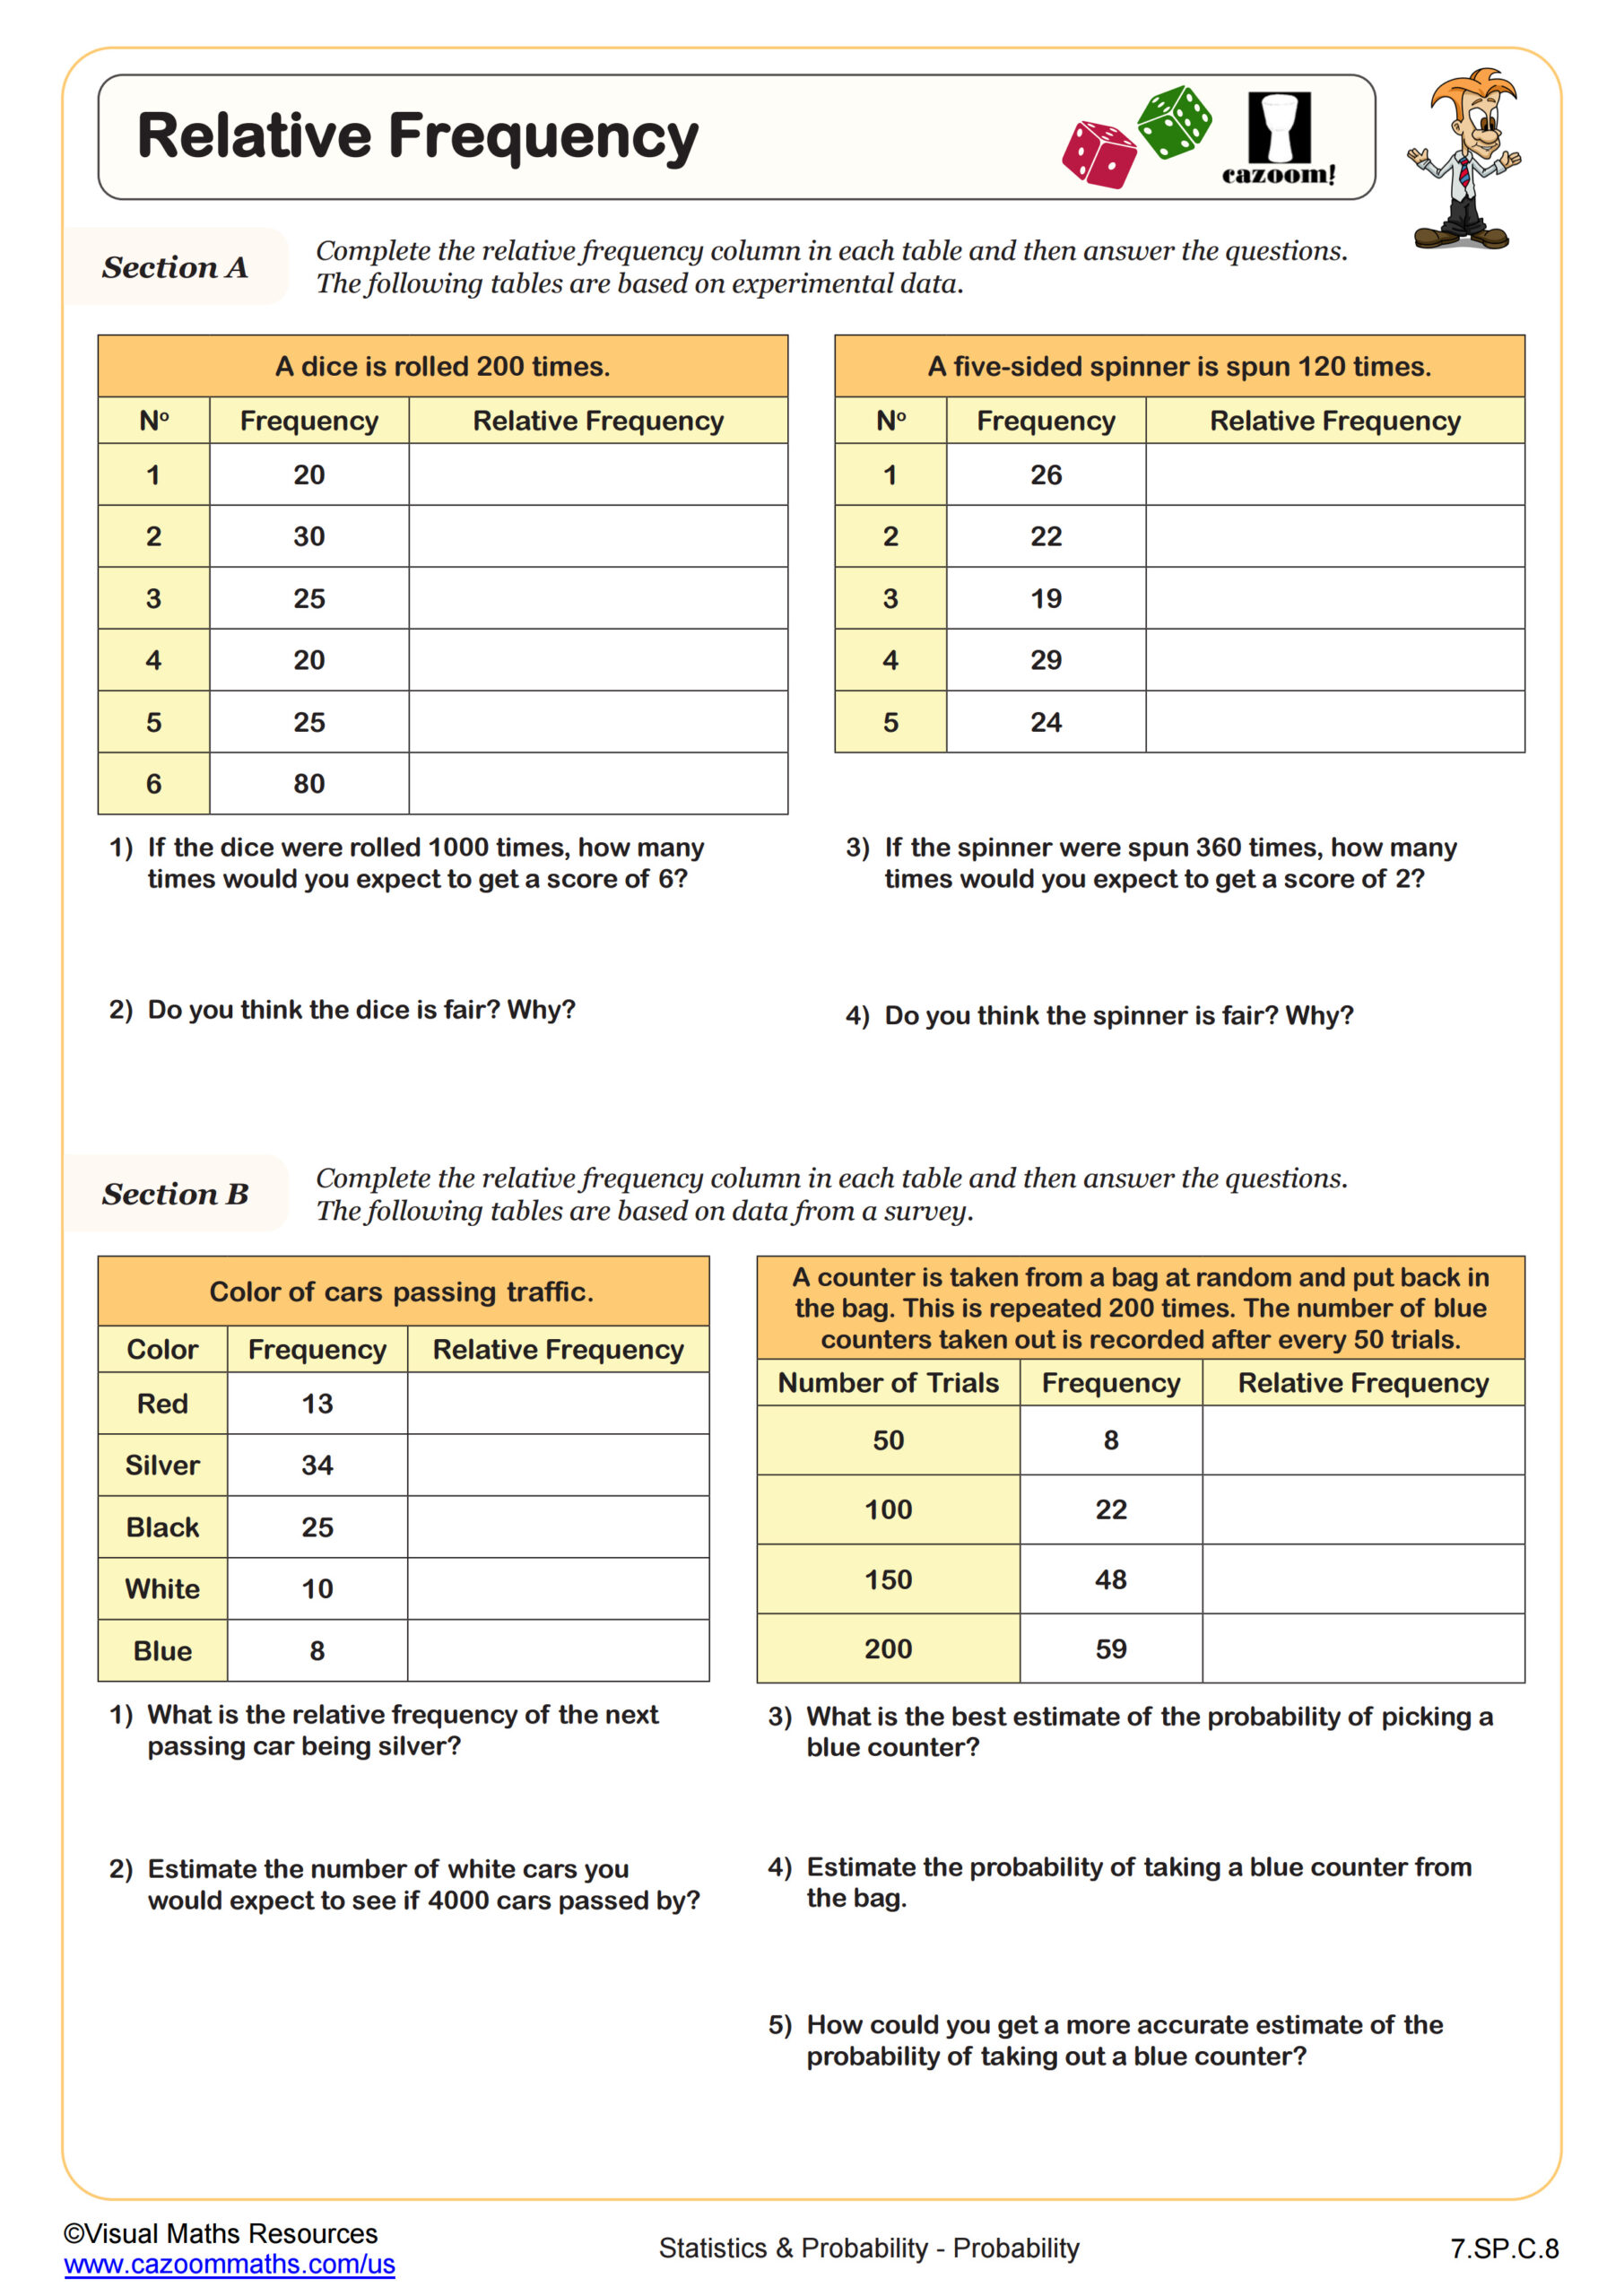
Students will conduct their own dice experiment and compare their results with theoretical probability in section A. In section A, students must roll a dice 60 times and record the number of ‘6’s scored after every 10 rolls in the table provided and plot their results on a graph (axes provided). Students will compare their results with the theoretical probability of rolling a fair dice and could also compare their results with their peers.
In section B, the same experiment has been carried out, but this time, the results have been provided. Students will again work out the experimental probability of these results, plot them on a graph, and discuss by answering questions about the data.
All worksheets are created by the team of experienced teachers at Cazoom Math.

RELATED TO Experimental Probability WORKSHEET
.jpg?w=3840)
Frequently Asked Questions
This experimental probability worksheet is designed for students in 7th Grade and aligns with Common Core State Standards.