Back to:
Finding Slope (A) WORKSHEET
Suitable for Grades: 8th Grade, IM 1
CCSS: 8.F.B.4, HSS.ID.C.7
CCSS Description: Construct a function to model a linear relationship between two quantities. Determine the rate of change and initial value of the function from a description of a relationship or from two (x, y) values, including reading these from a table or from a graph. Interpret the rate of change and initial value of a linear function in terms of the situation it models, and in terms of its graph or a table of values.
Interpret the slope (rate of change) and the intercept (constant term) of a linear model in the context of the data.
Interpret the slope (rate of change) and the intercept (constant term) of a linear model in the context of the data.
Finding Slope (A) WORKSHEET DESCRIPTION
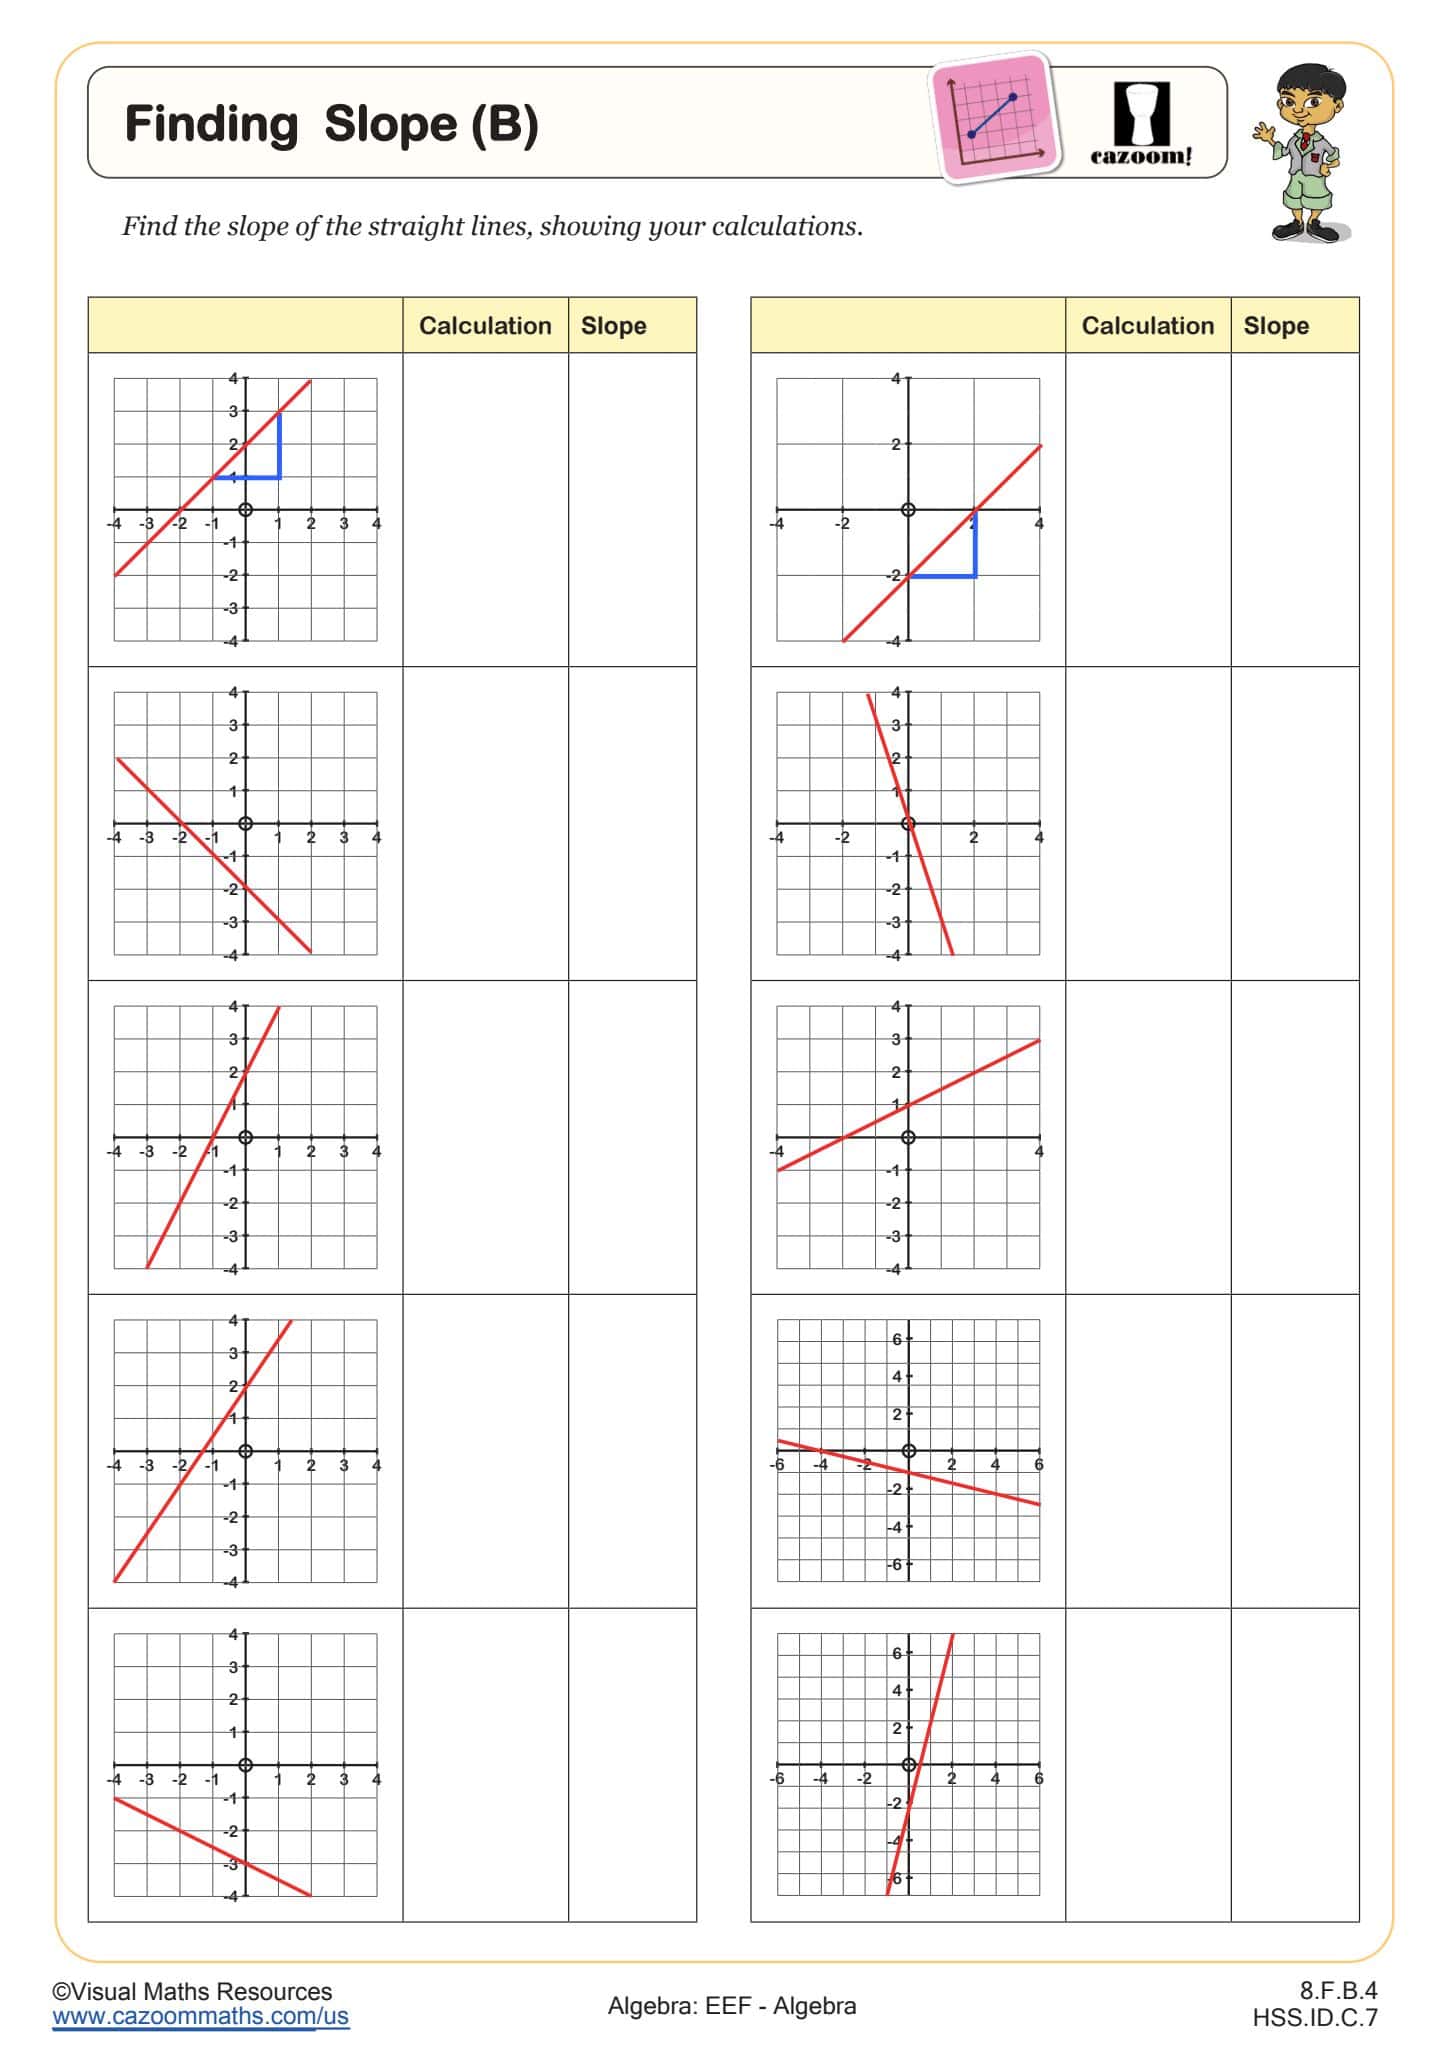
In this worksheet, students will calculate the slope of 12 straight lines presented on square grids.Step-by-step guidance is included to support their calculations.
The lines have both positive and negative slopes, with two featuring fractional slopes.
Ready to move on? See Finding Slope (B) and Finding Slope (C) for lines drawn on the x- and y-axes and for calculating slope between two points.
All worksheets are created by the team of experienced teachers at Cazoom Math.

RELATED TO Finding Slope (A) WORKSHEET

Frequently Asked Questions
This finding slope (a) worksheet is designed for students in 8th Grade and IM 1 and aligns with Common Core State Standards.