Graphing Relationships (A) - Drawing and Interpreting WORKSHEET
Construct a function to model a linear relationship between two quantities. Determine the rate of change and initial value of the function from a description of a relationship or from two (x, y) values, including reading these from a table or from a graph. Interpret the rate of change and initial value of a linear function in terms of the situation it models, and in terms of its graph or a table of values.
Graphing Relationships (A) - Drawing and Interpreting WORKSHEET DESCRIPTION
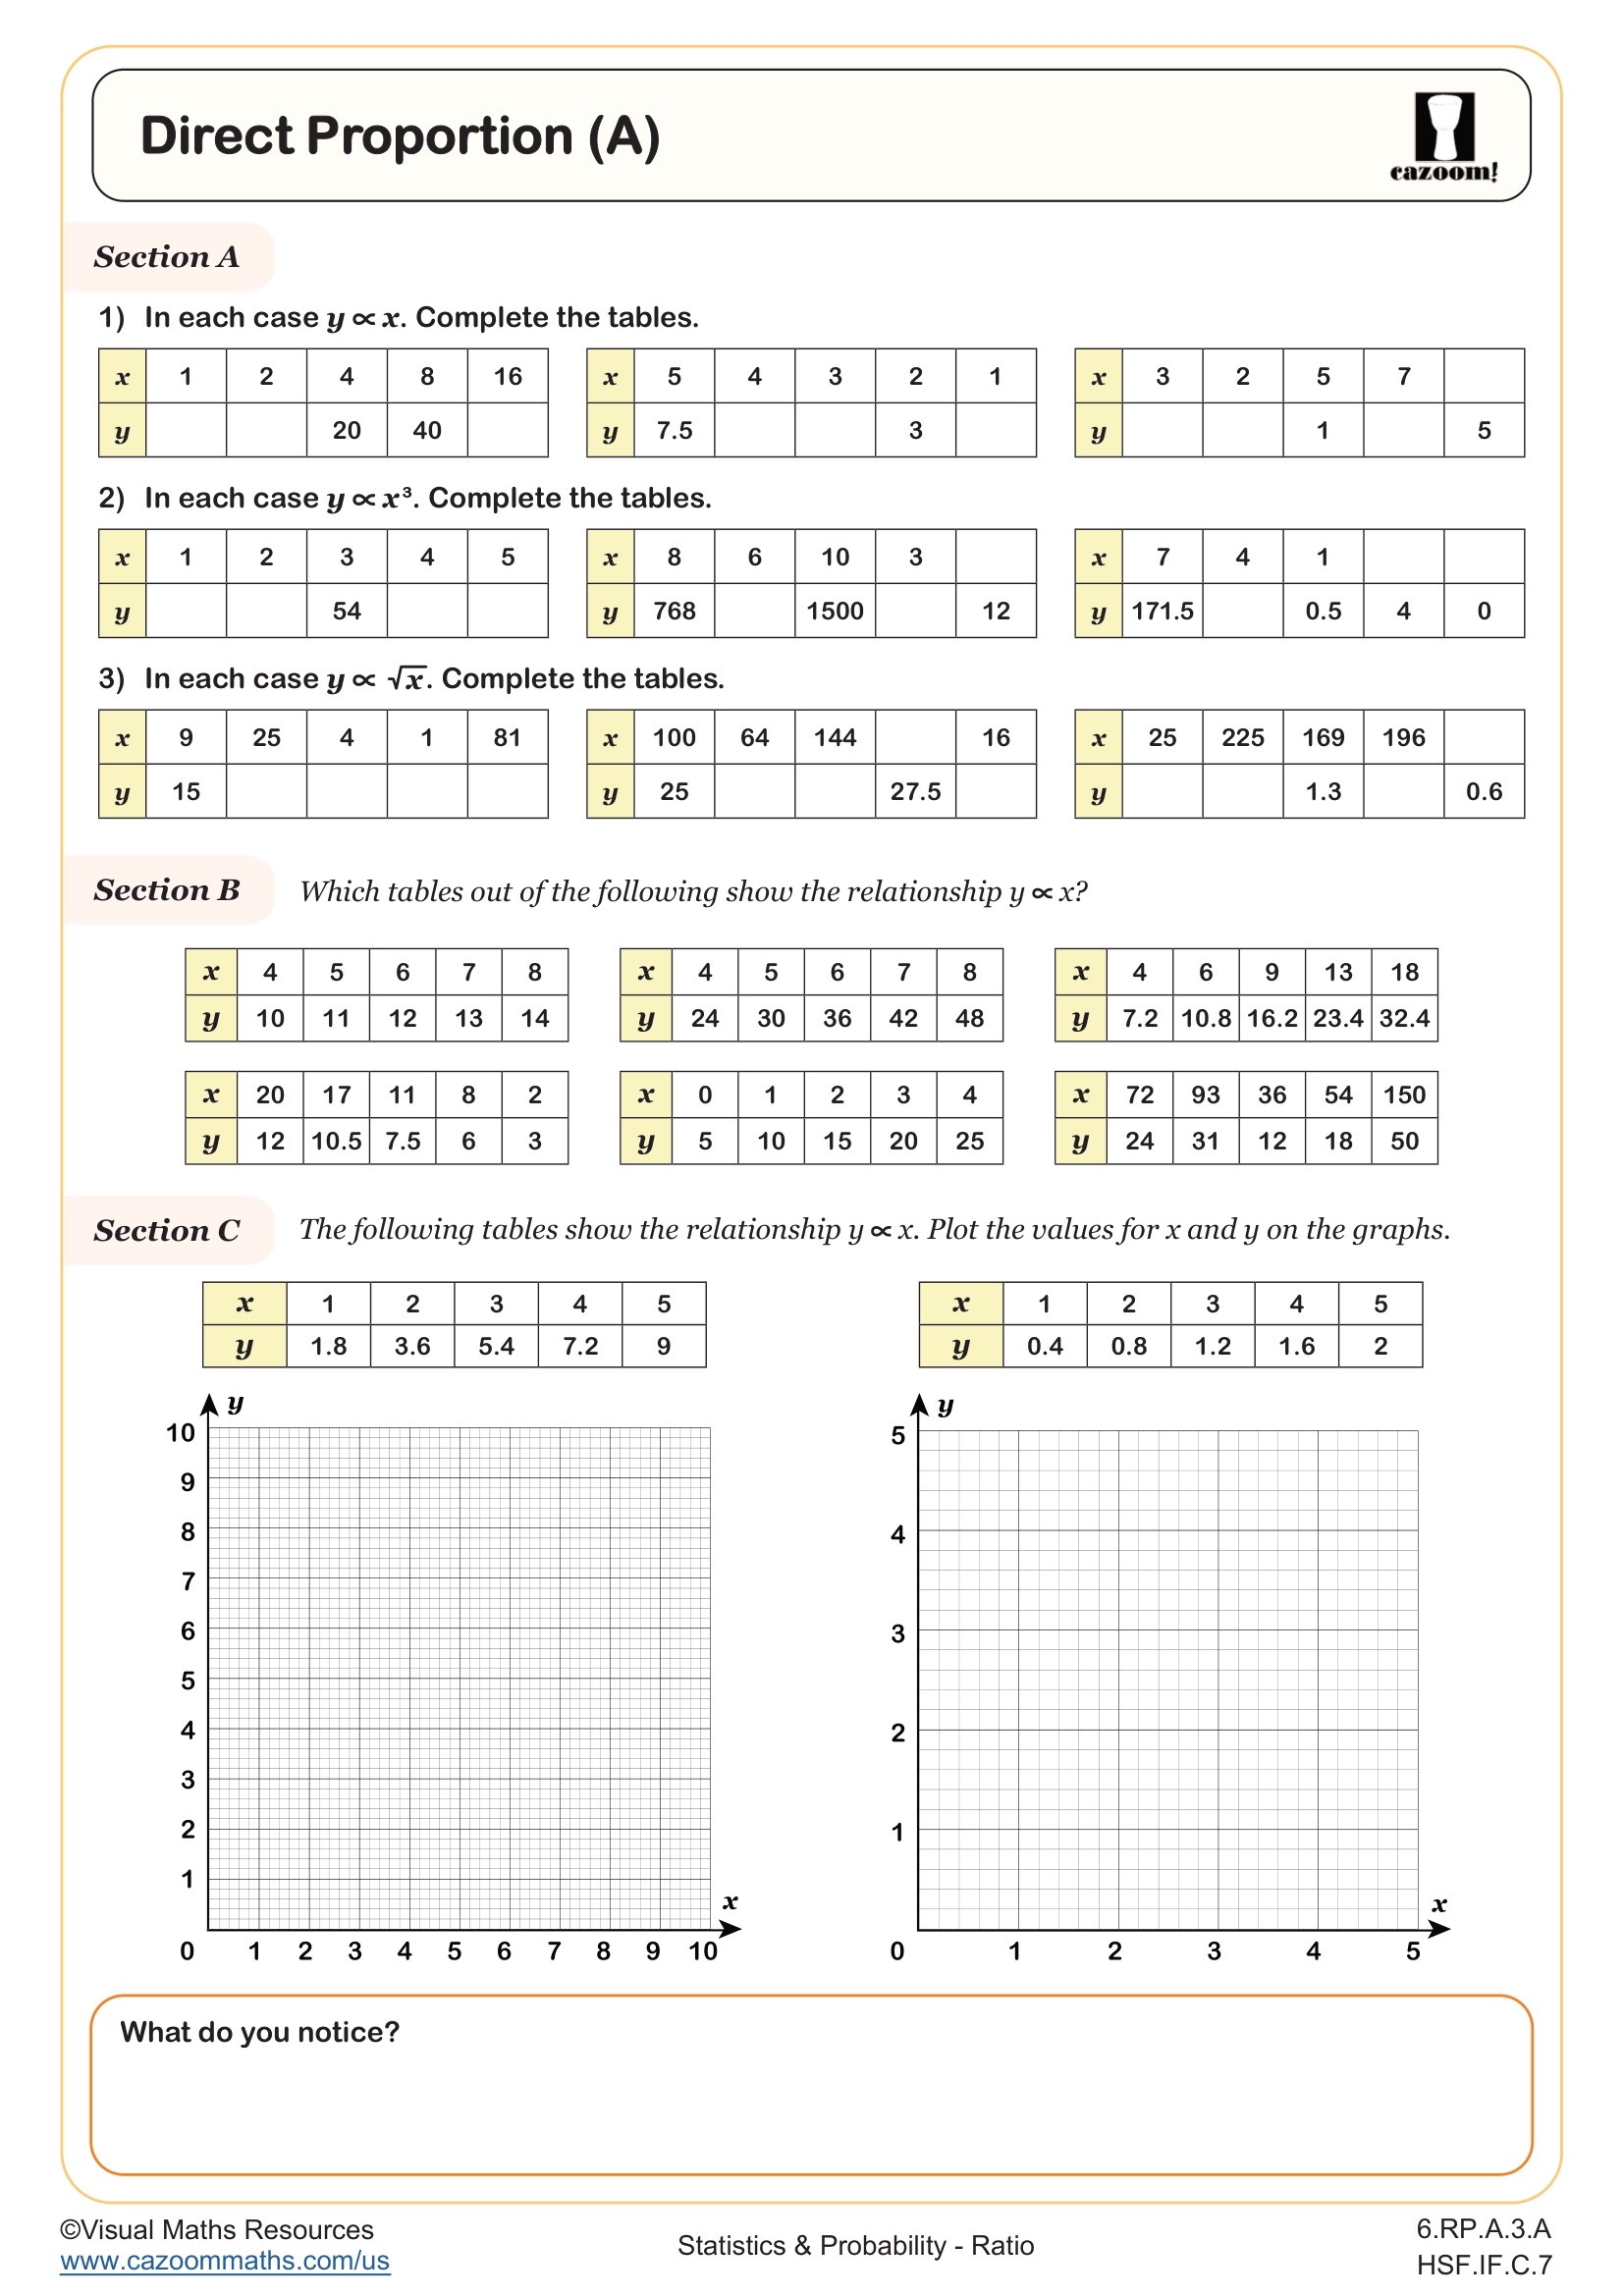
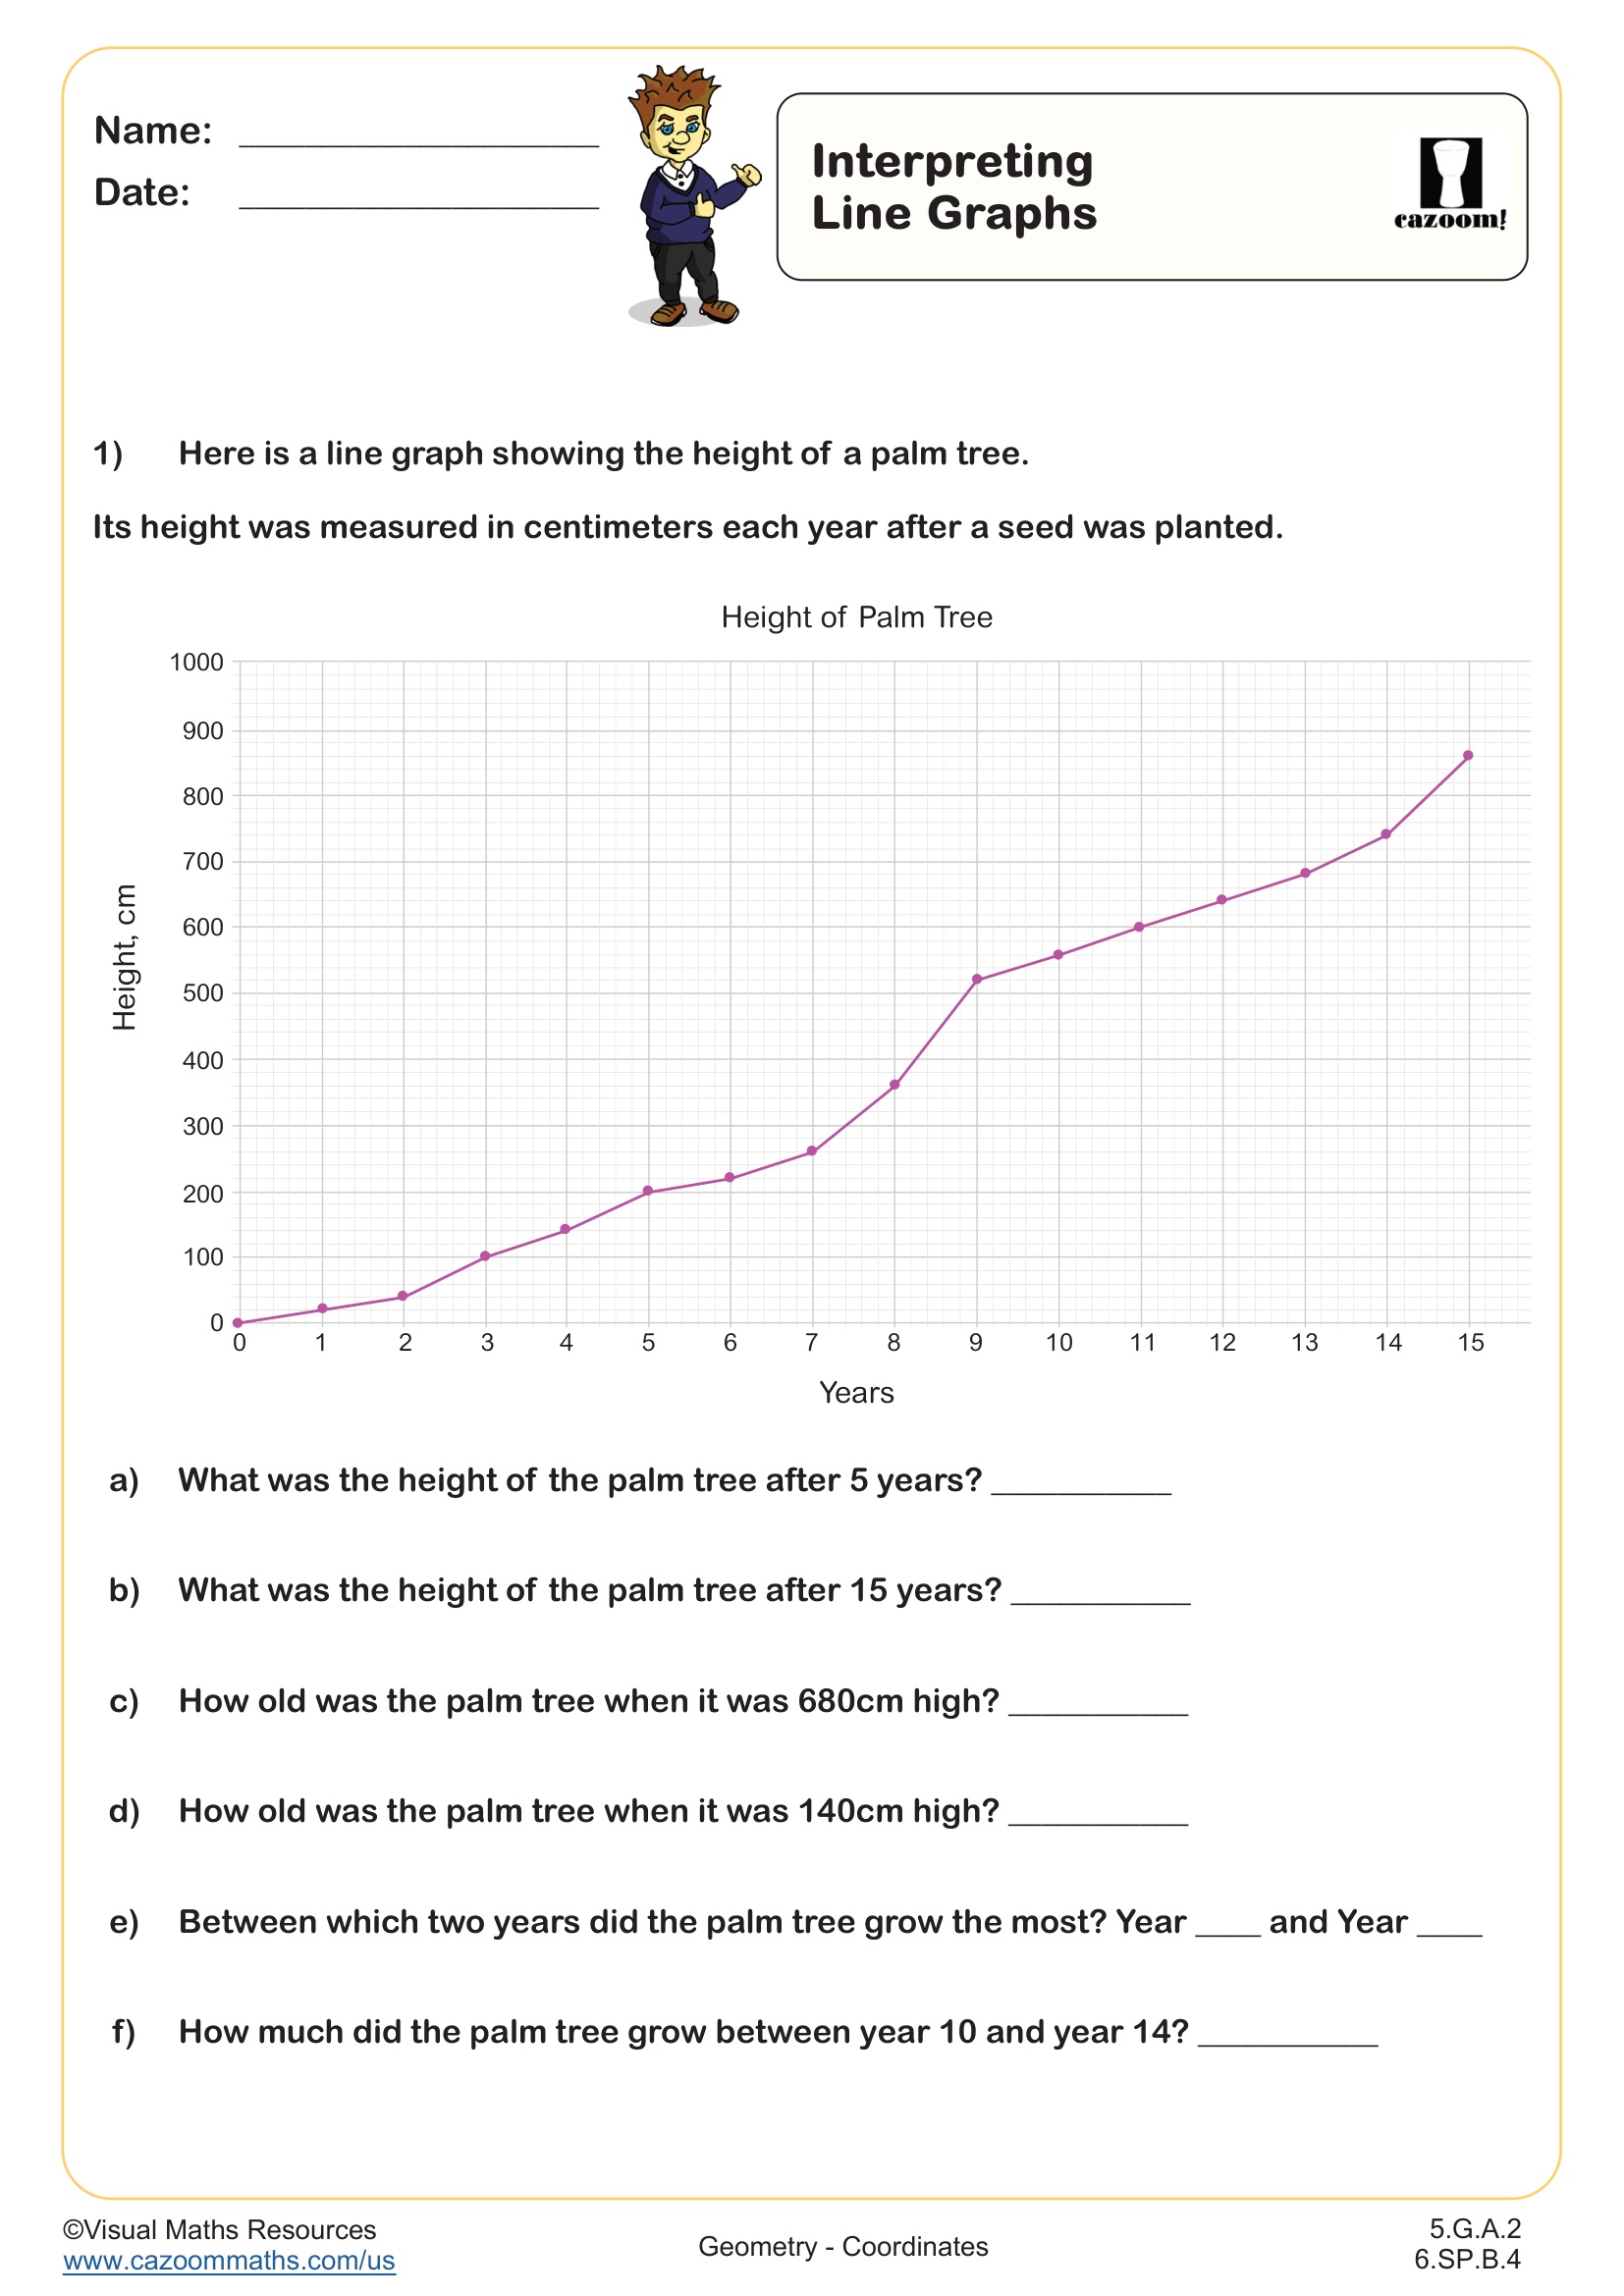
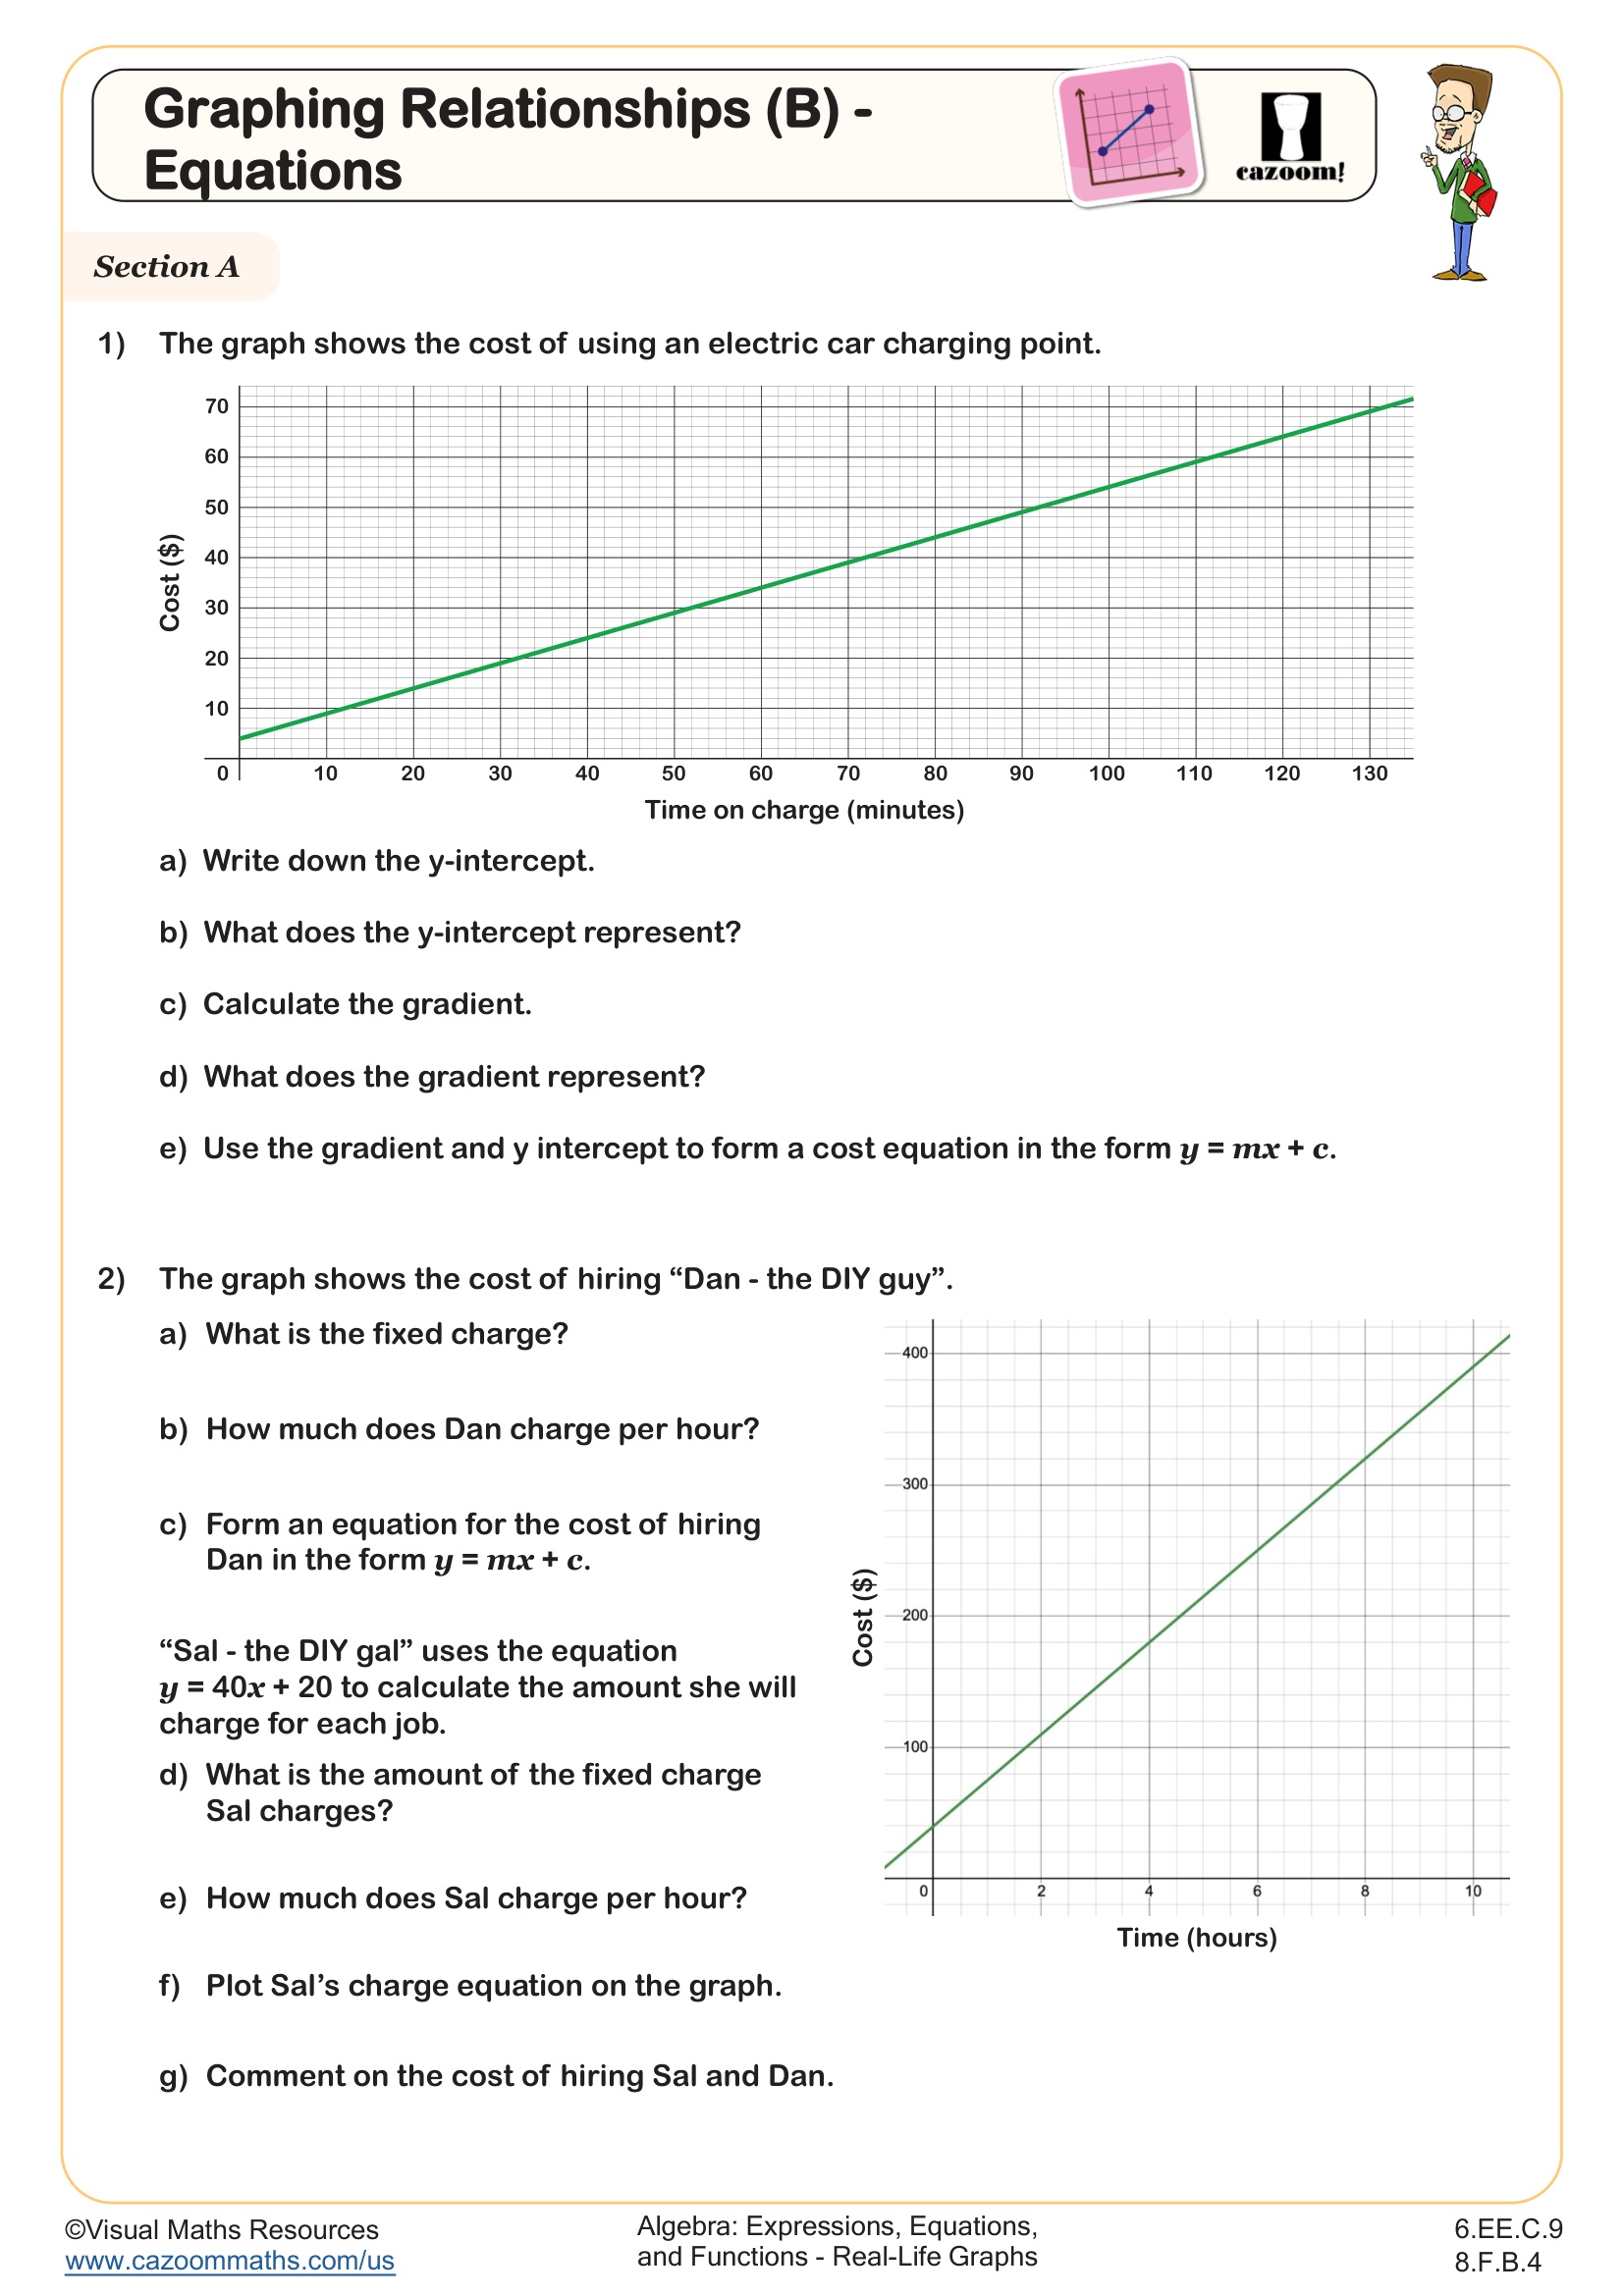
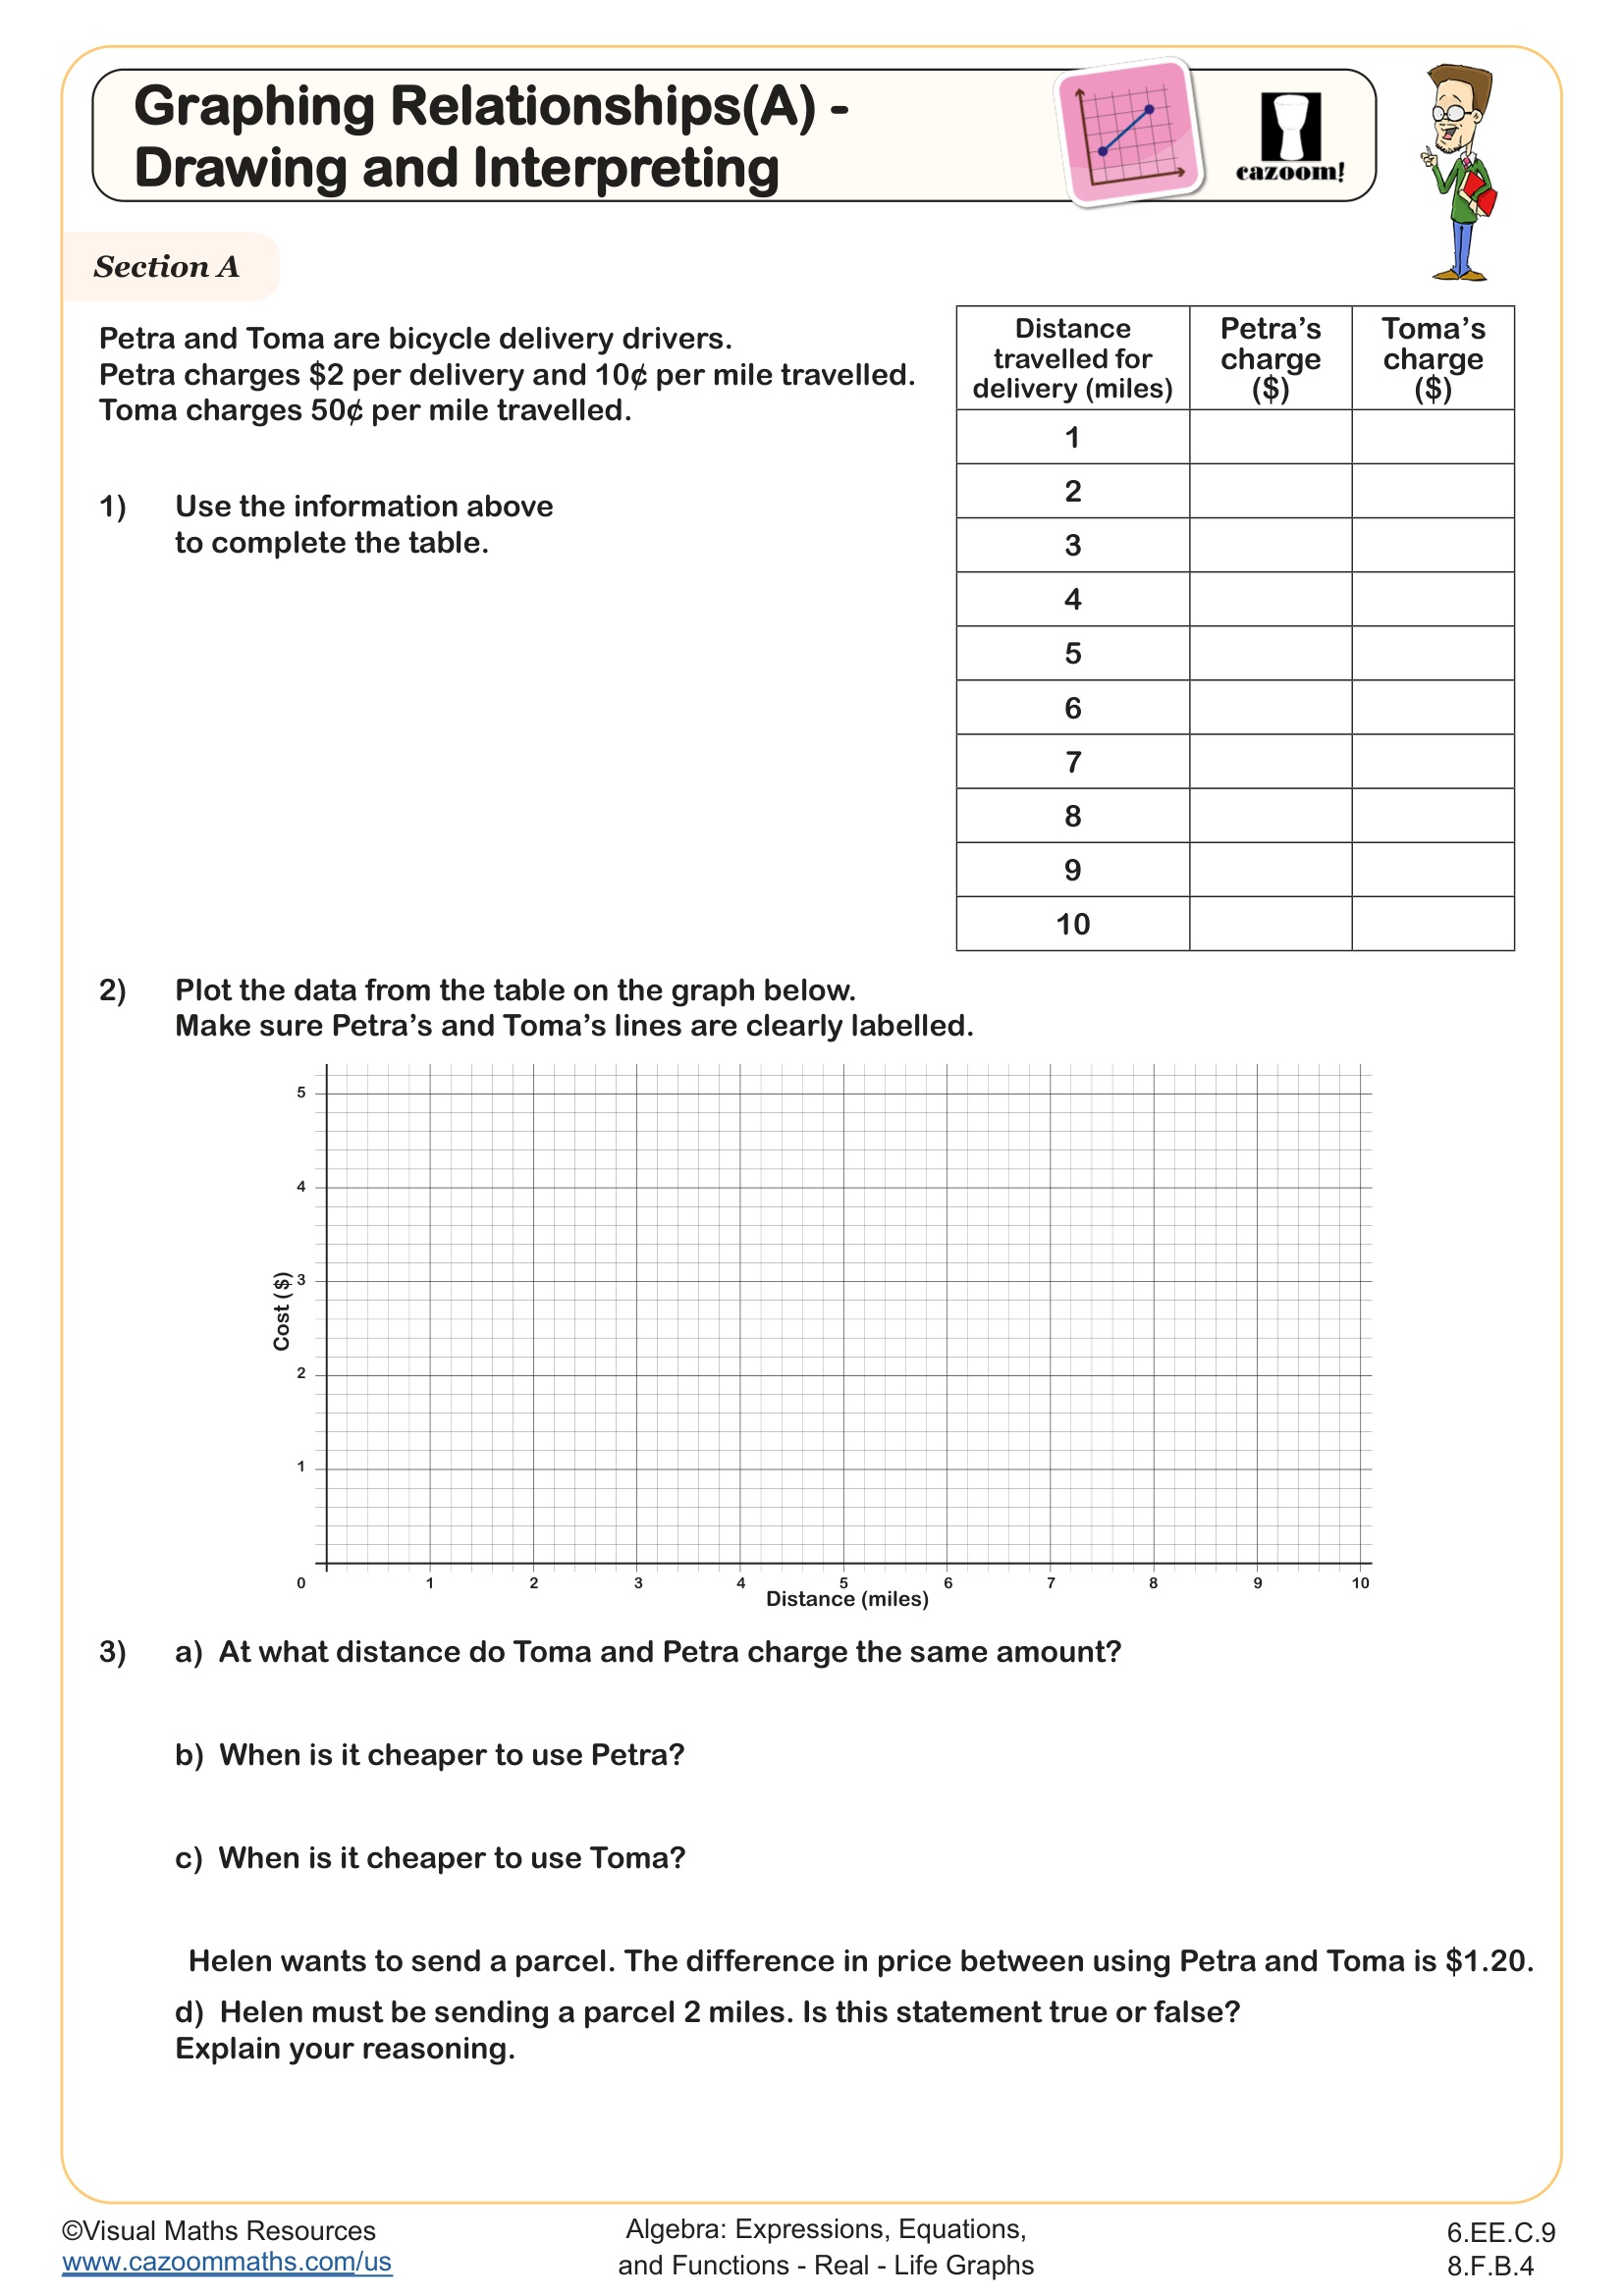
This worksheet focuses on the practical application of drawing and interpreting charge graphs and exposes learners to various different ‘cost’ scenarios; designed to develop students' abilities to interpret and construct linear graphs, understand proportional relationships, and apply mathematical reasoning to solve practical problems.
Students will begin by completing a table using given pricing information, plotting the data and answering questions in order to compare the charges of two bicycle delivery services in section A.
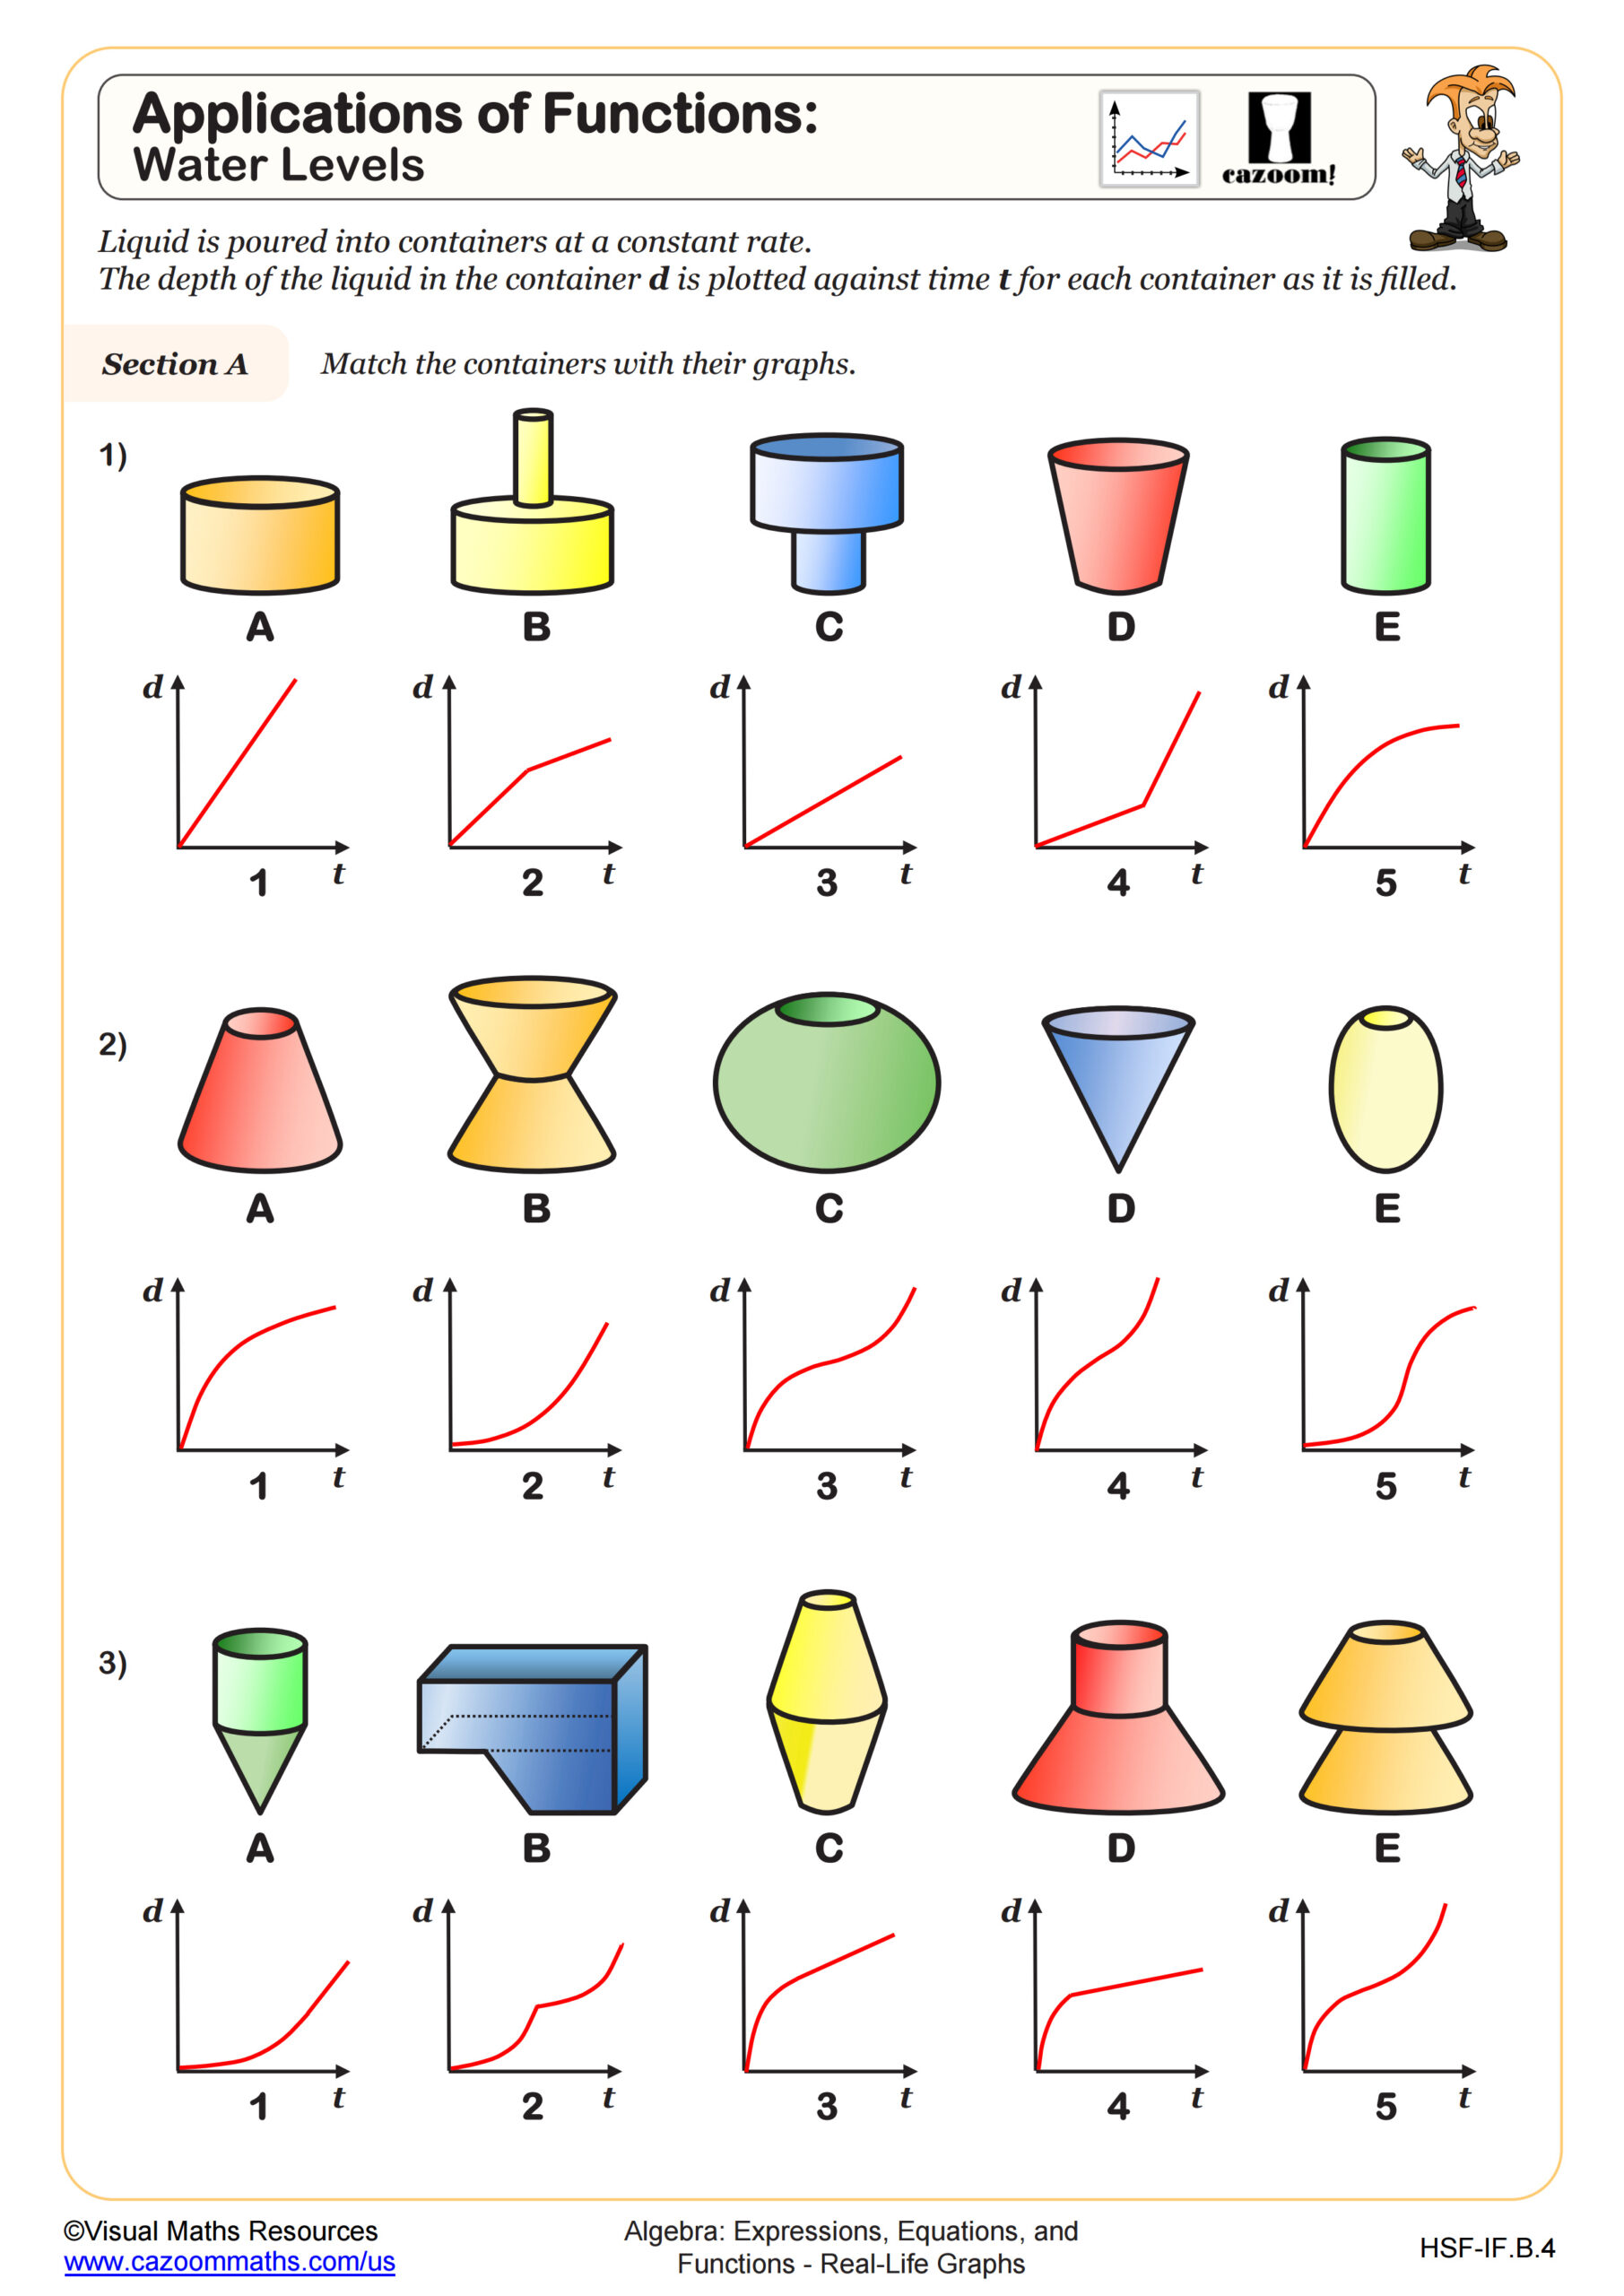
Then, section B will see students matching multiple electricity companies charges to the correct charge graphs.
Students will draw four different charge graphs in section C.
Lastly, section D provides more opportunity to interpret charge graphs as learners answer questions about costs.
RELATED TO Graphing Relationships (A) - Drawing and Interpreting WORKSHEET
Frequently Asked Questions
This graphing relationships (a) - drawing and interpreting worksheet is designed for students in 6th Grade and 8th Grade and aligns with Common Core State Standards.
