Graphing Relationships (B) - Equations WORKSHEET
Construct a function to model a linear relationship between two quantities. Determine the rate of change and initial value of the function from a description of a relationship or from two (x, y) values, including reading these from a table or from a graph. Interpret the rate of change and initial value of a linear function in terms of the situation it models, and in terms of its graph or a table of values.
Graphing Relationships (B) - Equations WORKSHEET DESCRIPTION
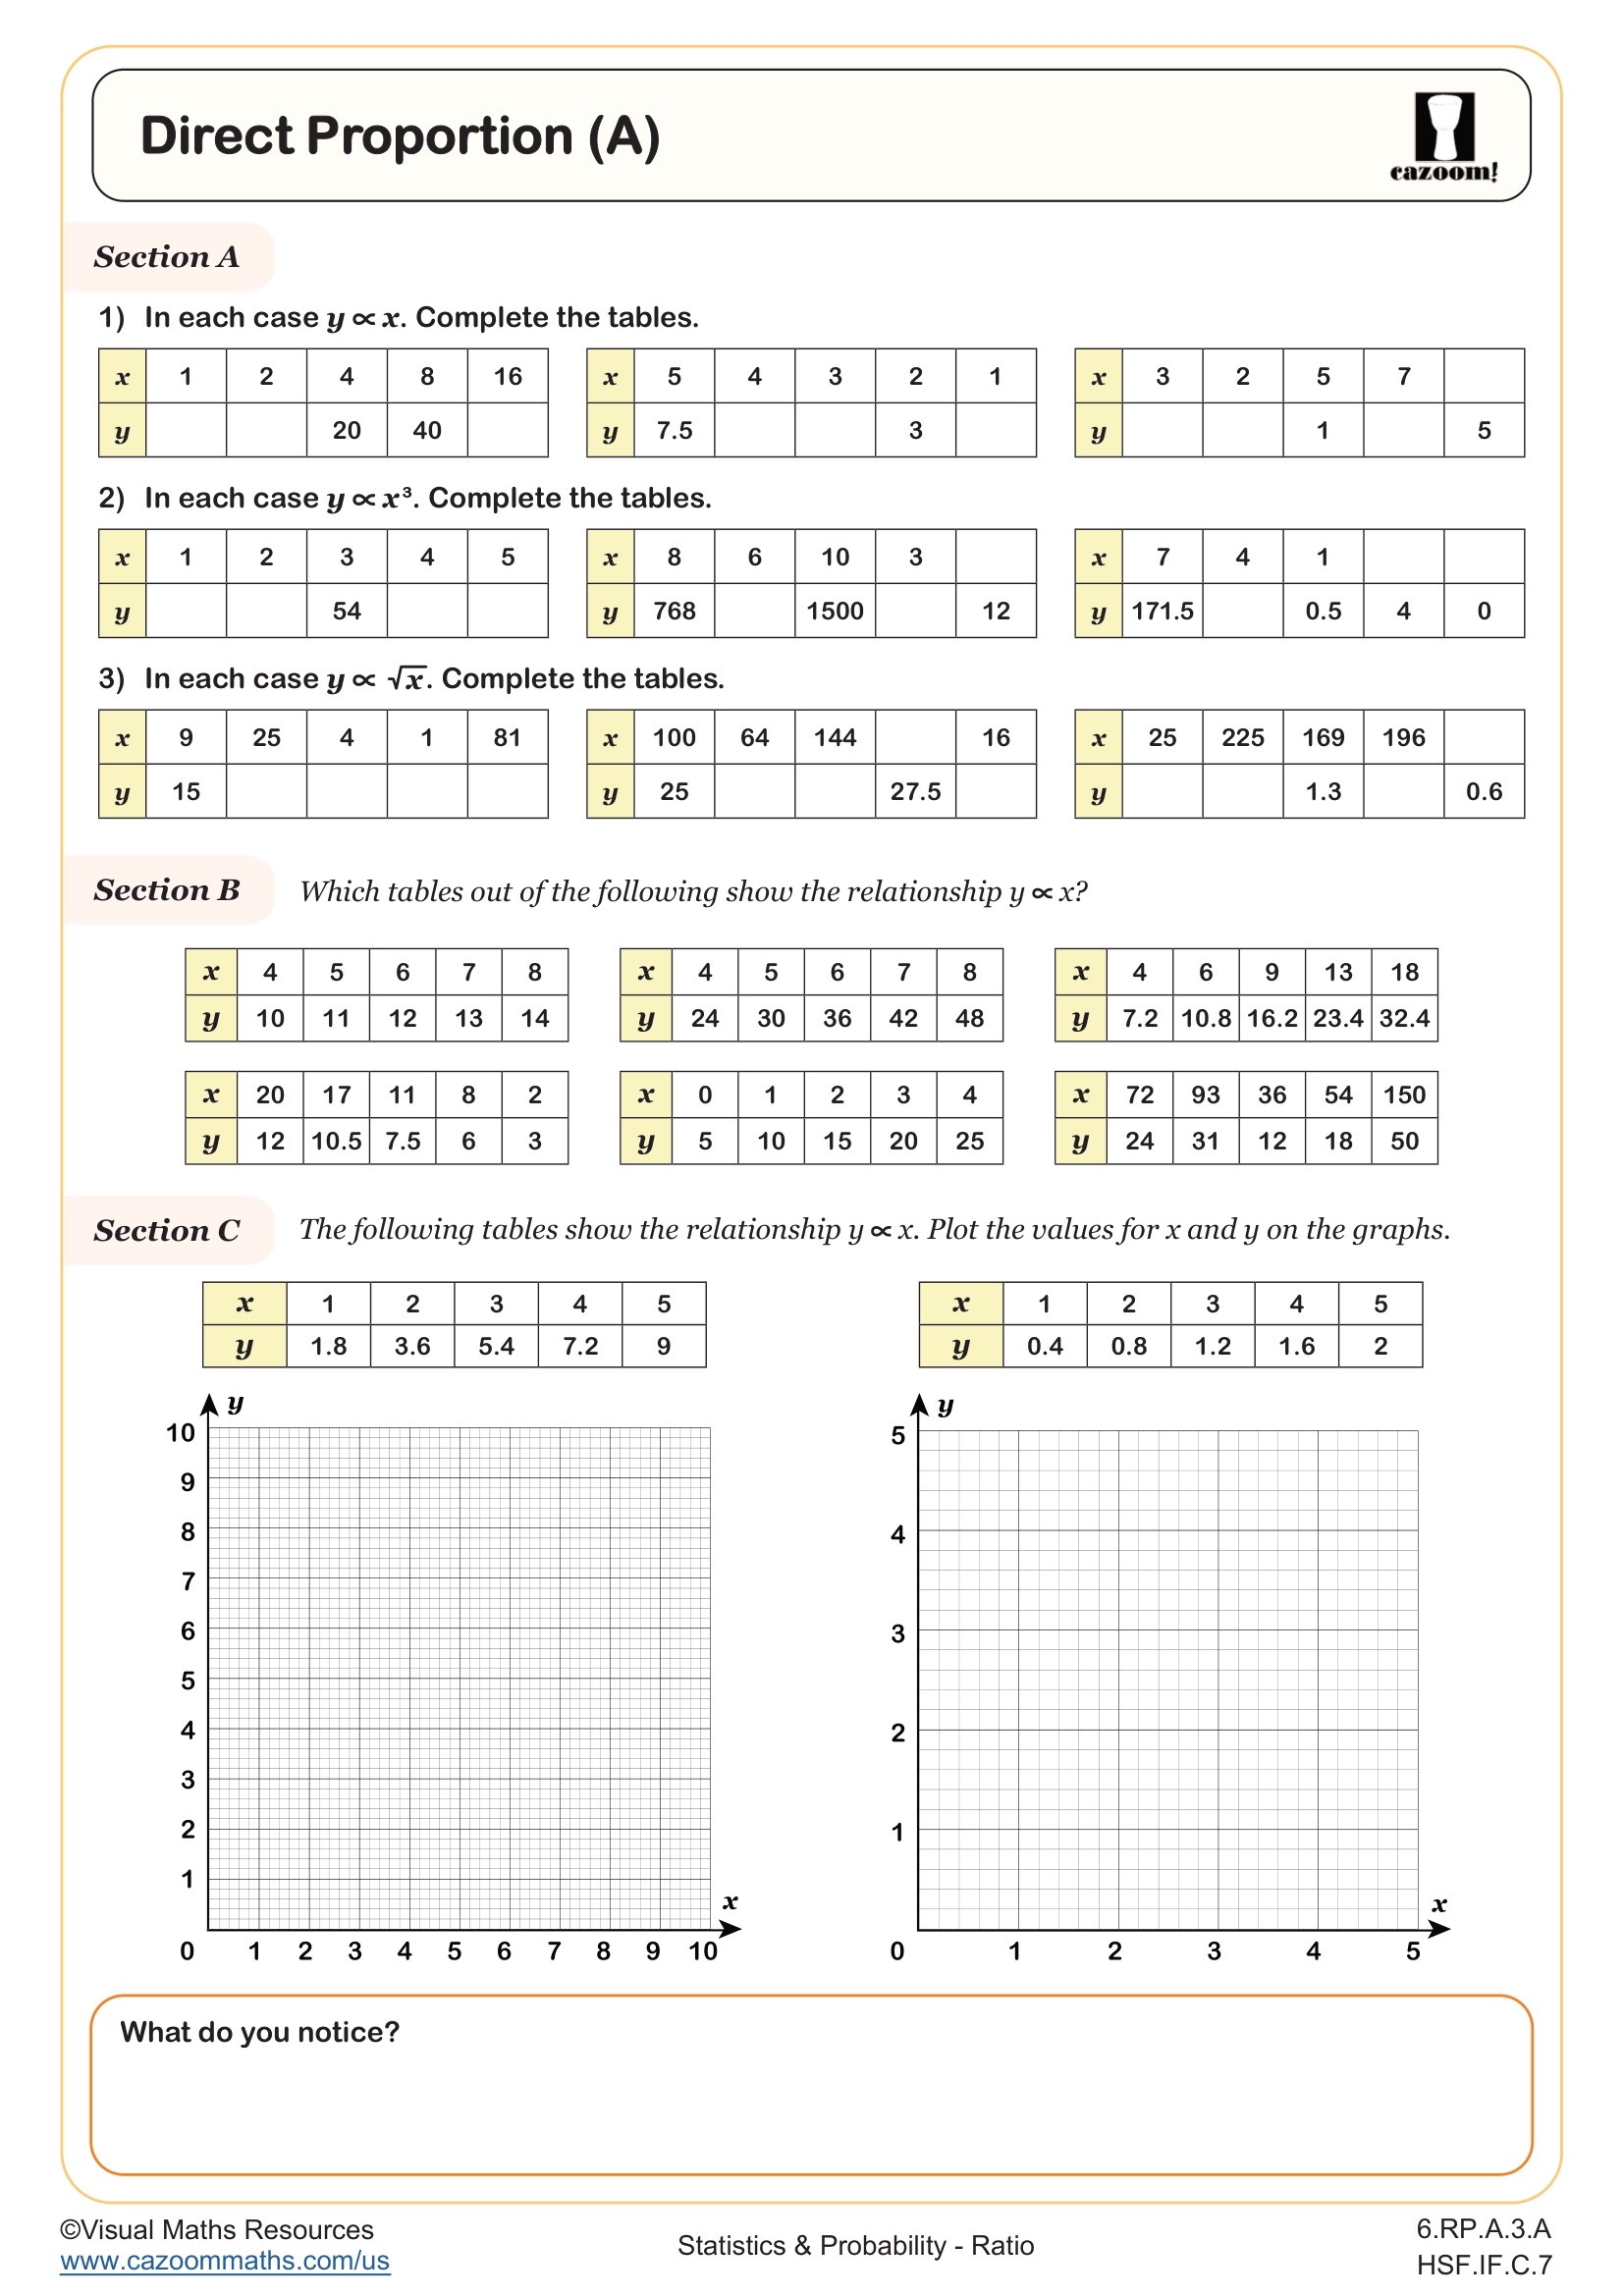
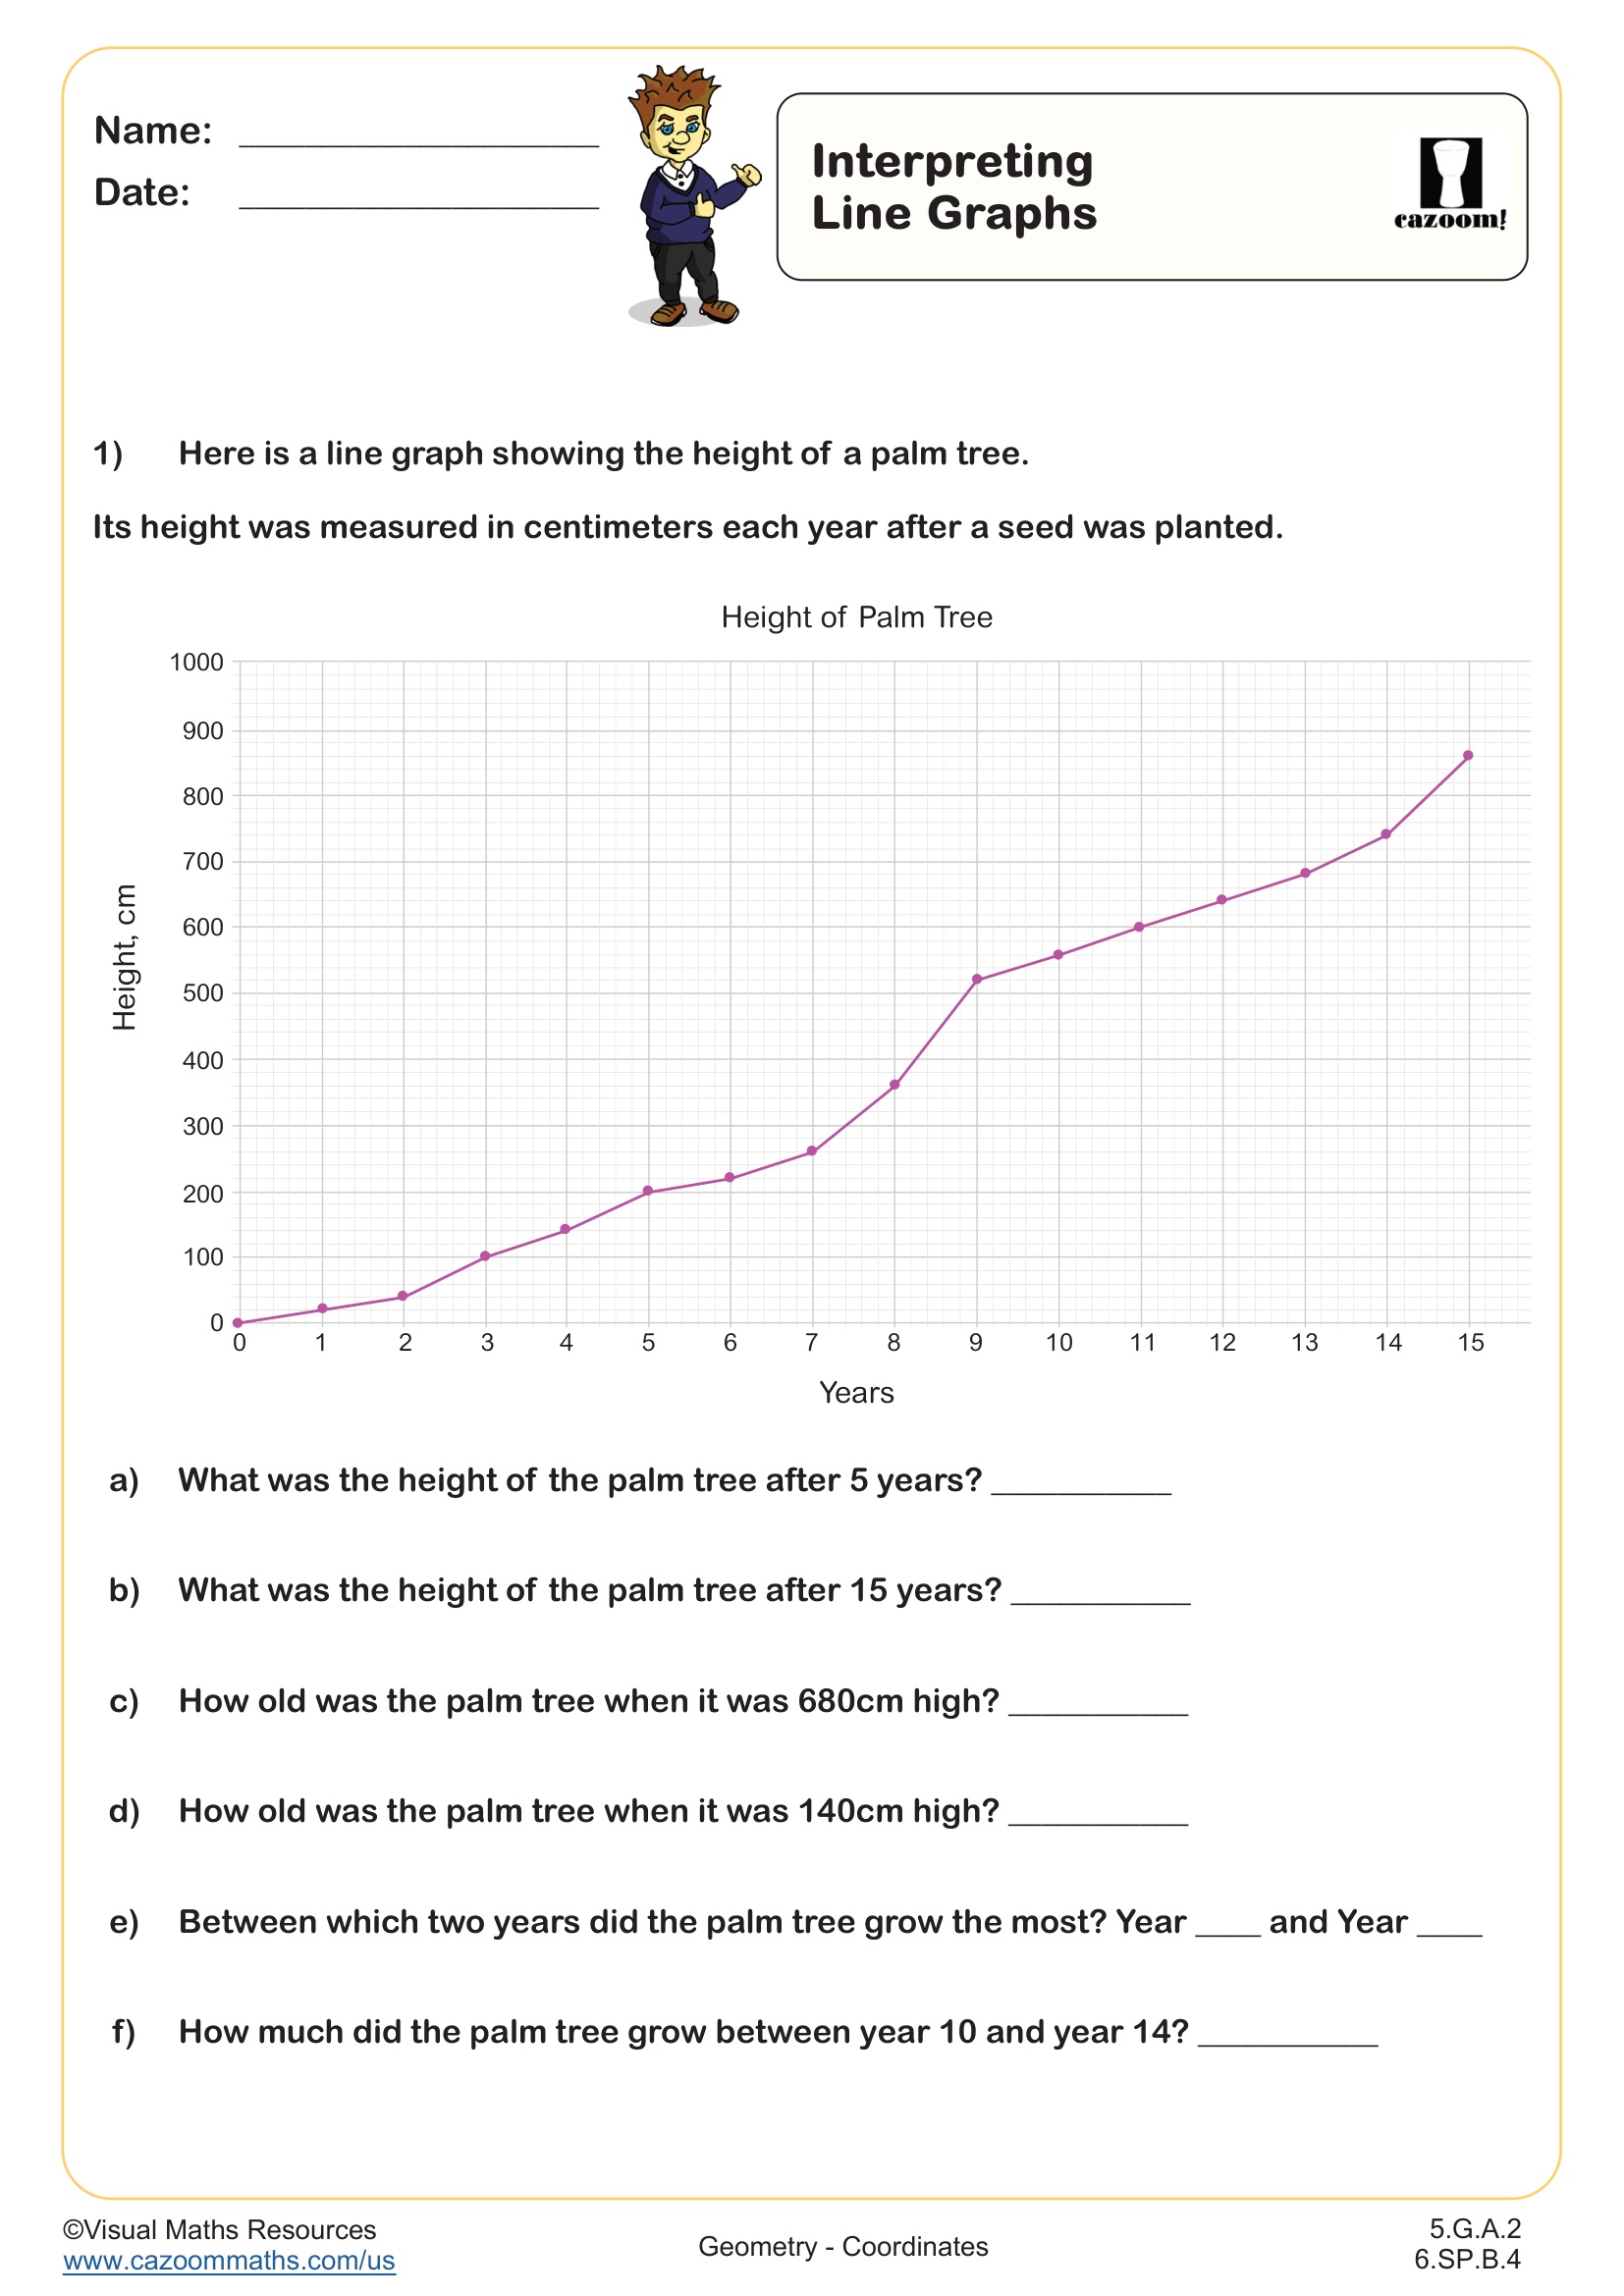
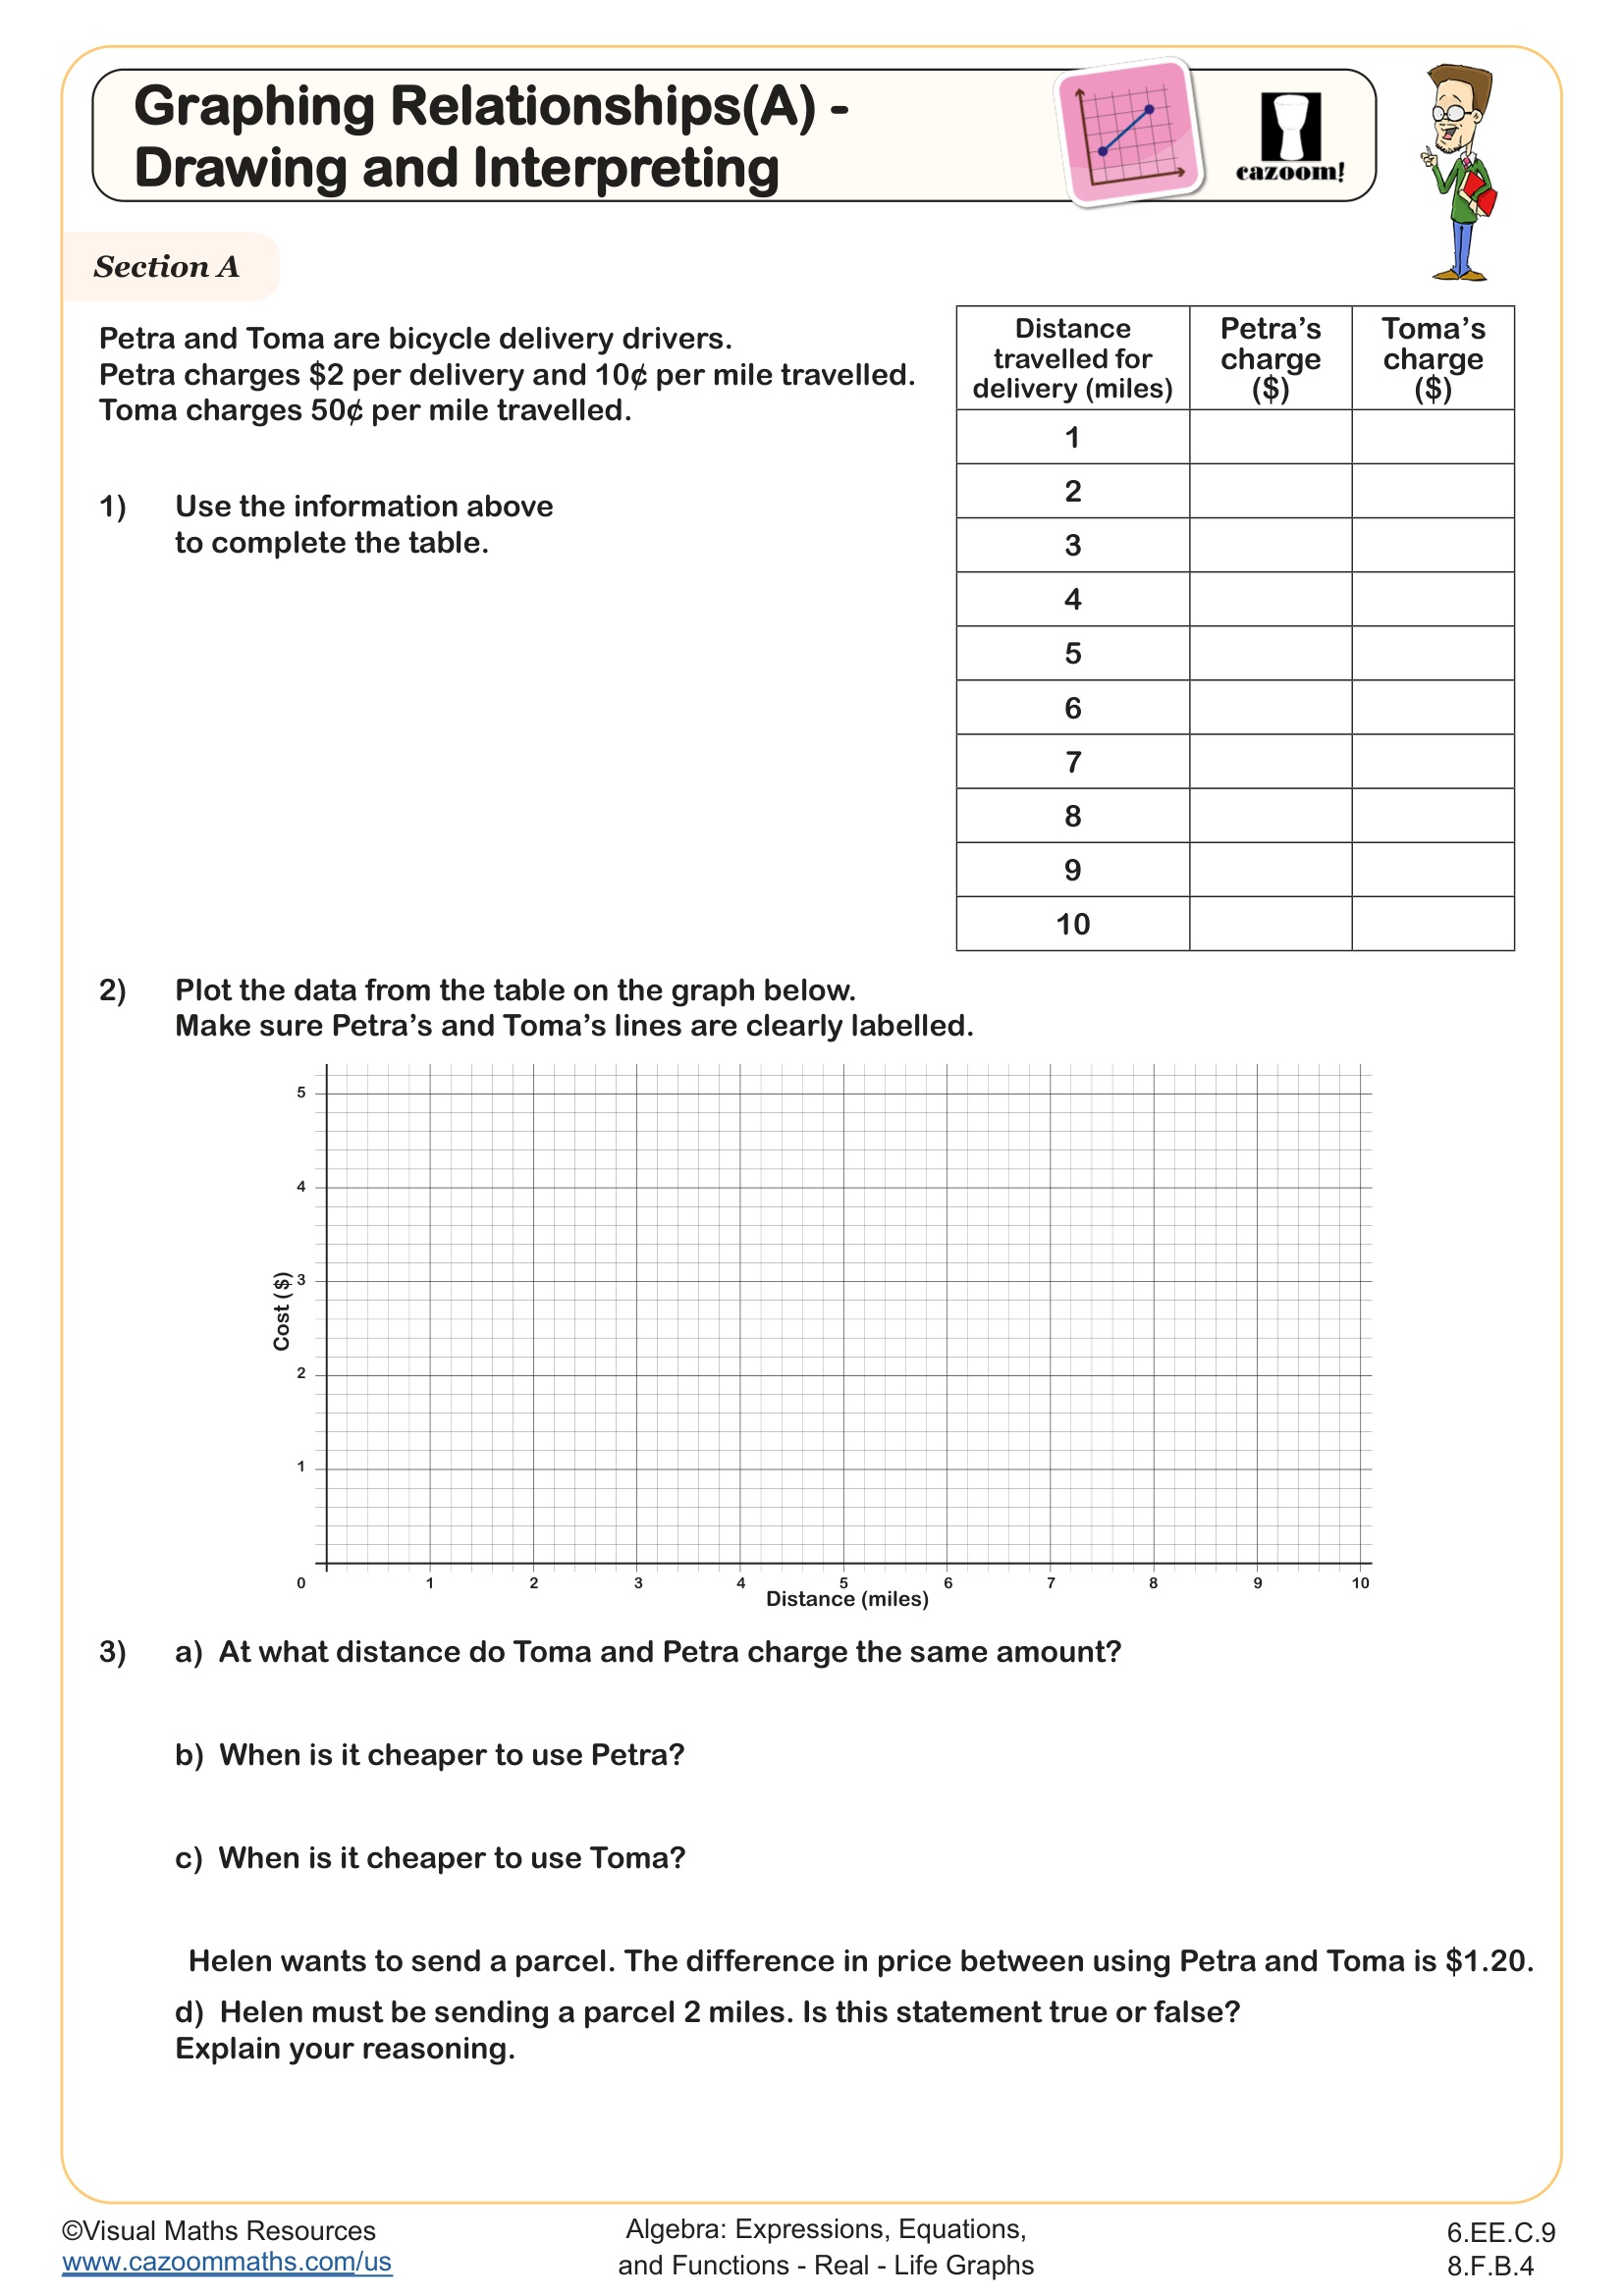
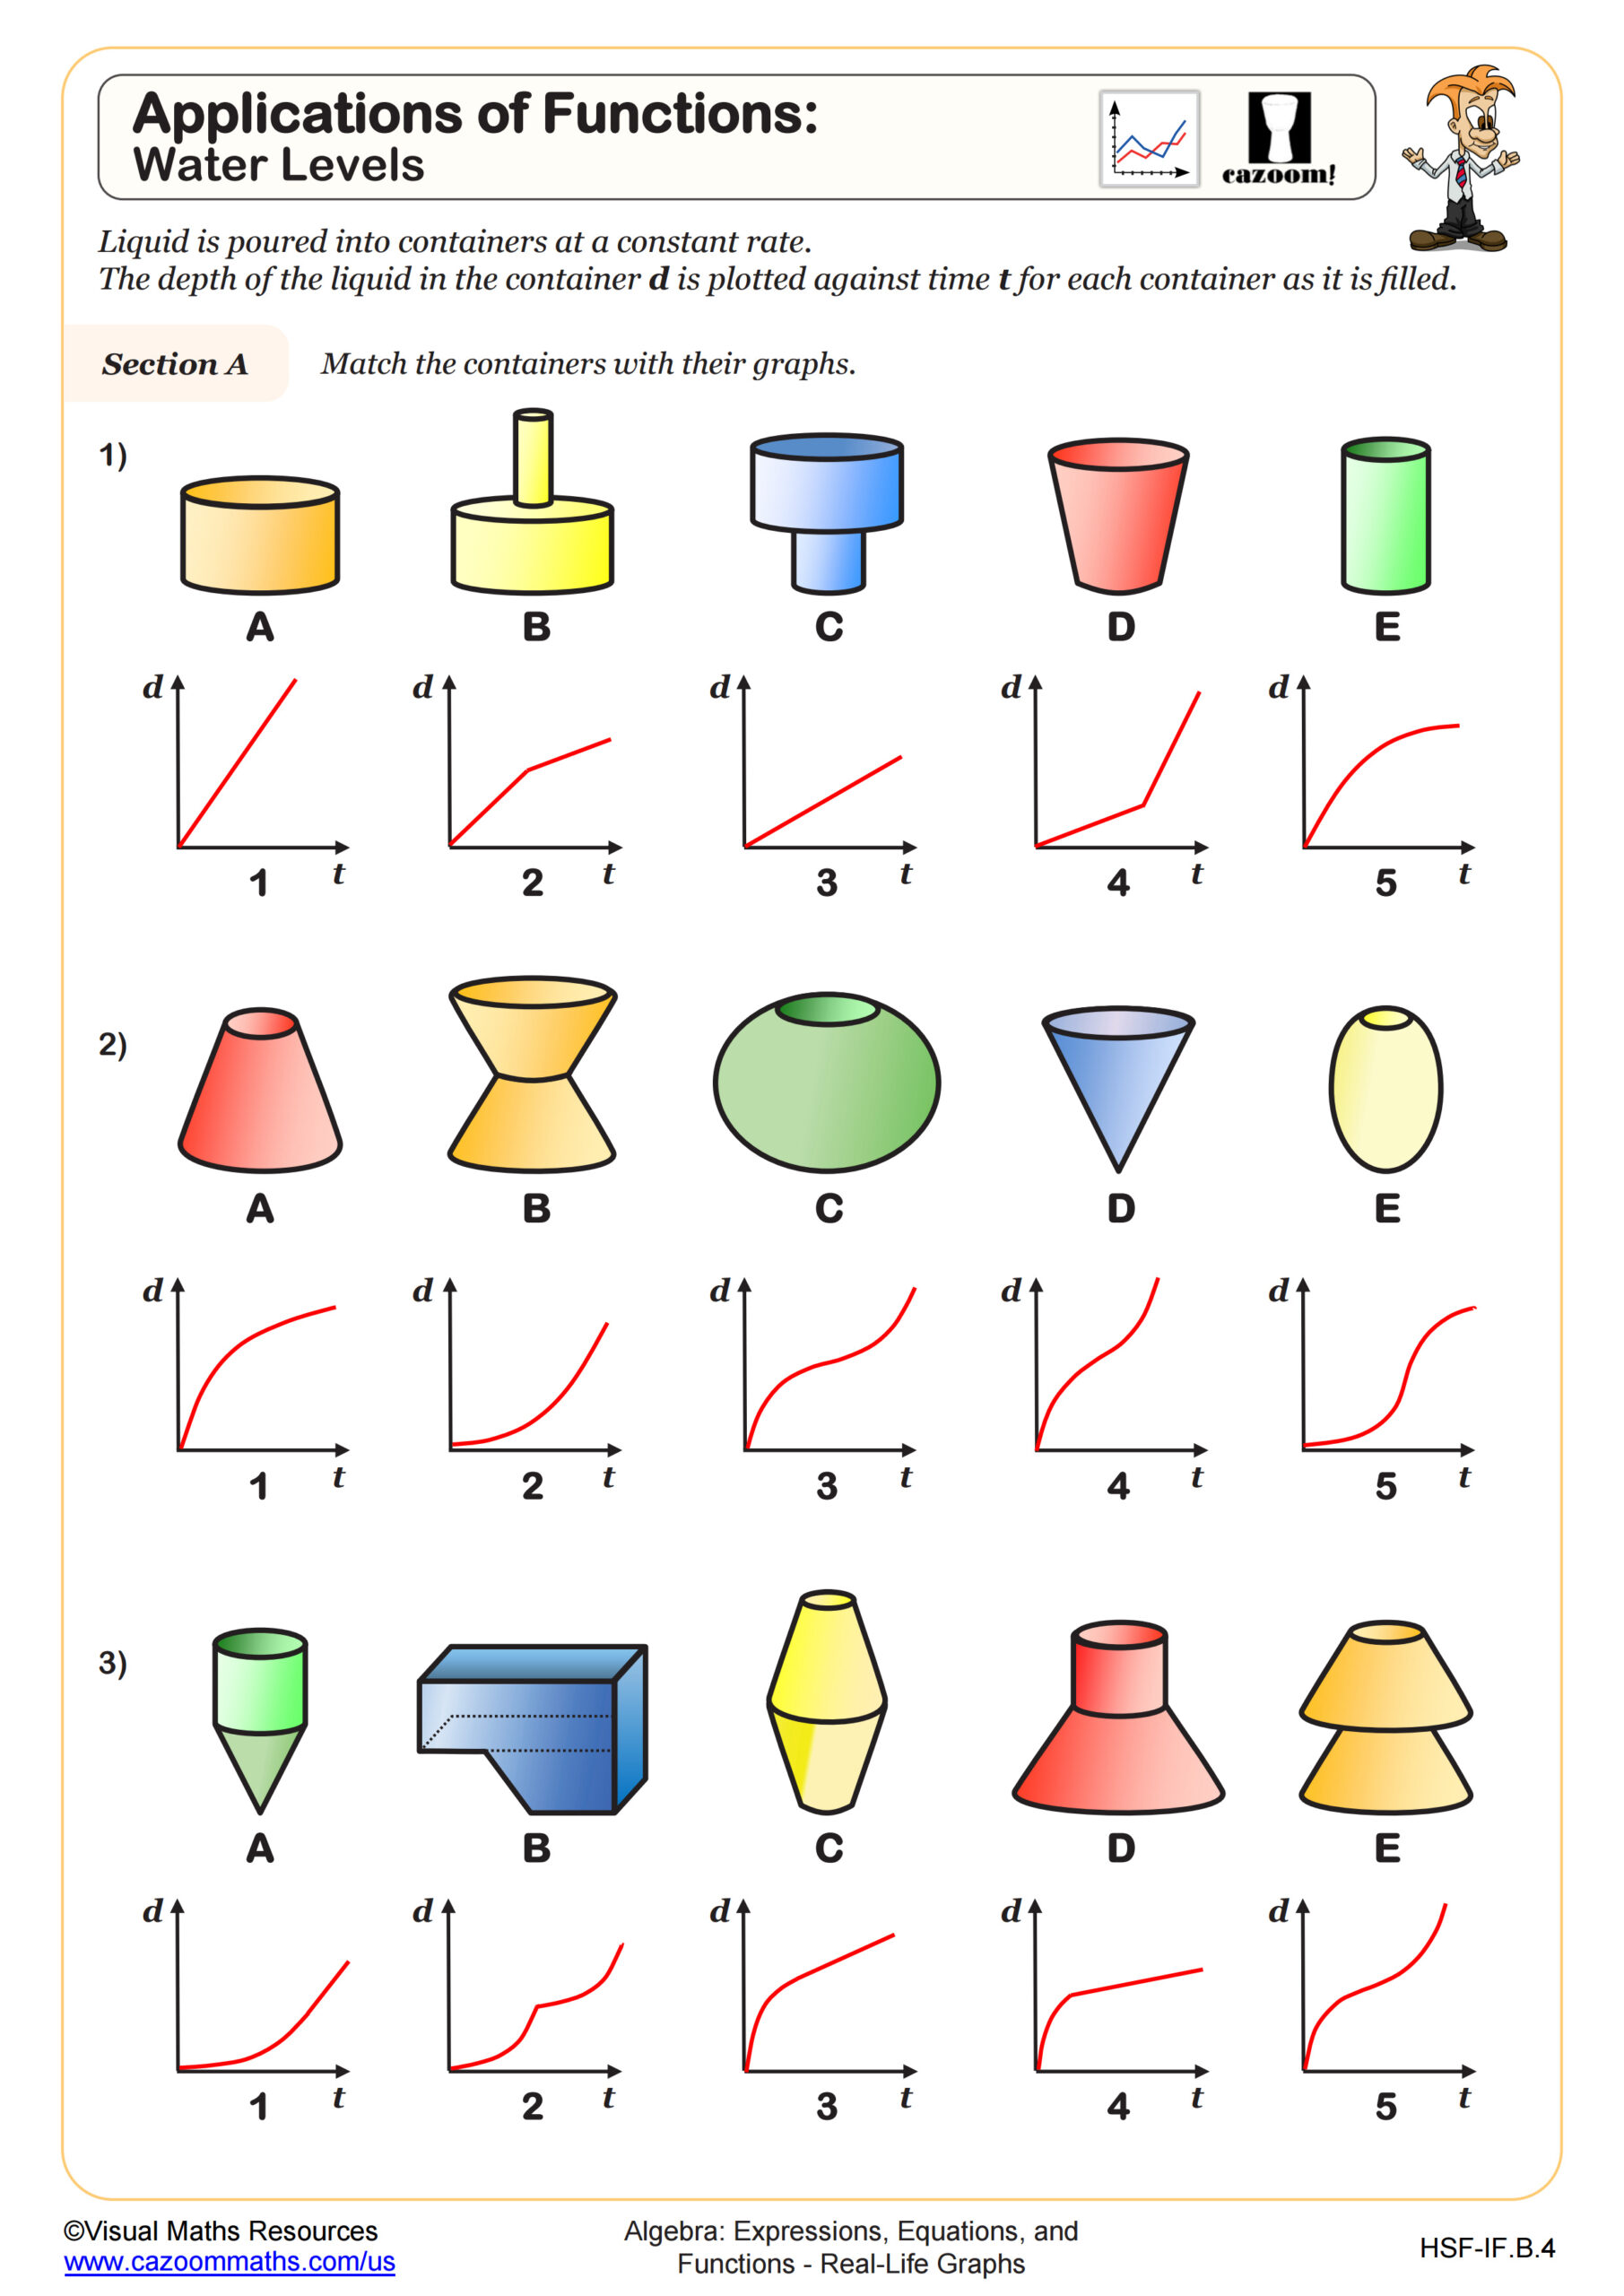
Enhance students' ability to interpret graphs with this worksheet, which connects real-life graphs to linear functions in the form y = mx + c. Learners will find the equations of straight lines and understand how the y-intercept and gradient represent a fixed charge and charge per unit in section A. This section leads students to match linear equations with charge scenarios and their corresponding graphs in section B. Finally, students will form equations themselves from scenarios such as, “A taxi company charges a fixed fee of $3.70 and 70 ¢ per mile.” This approach helps reinforce their understanding of how linear functions apply to real-world situations.
All worksheets are created by the team of experienced teachers at Cazoom Math.

RELATED TO Graphing Relationships (B) - Equations WORKSHEET
Frequently Asked Questions
This graphing relationships (b) - equations worksheet is designed for students in 6th Grade and 8th Grade and aligns with Common Core State Standards.