Back to:
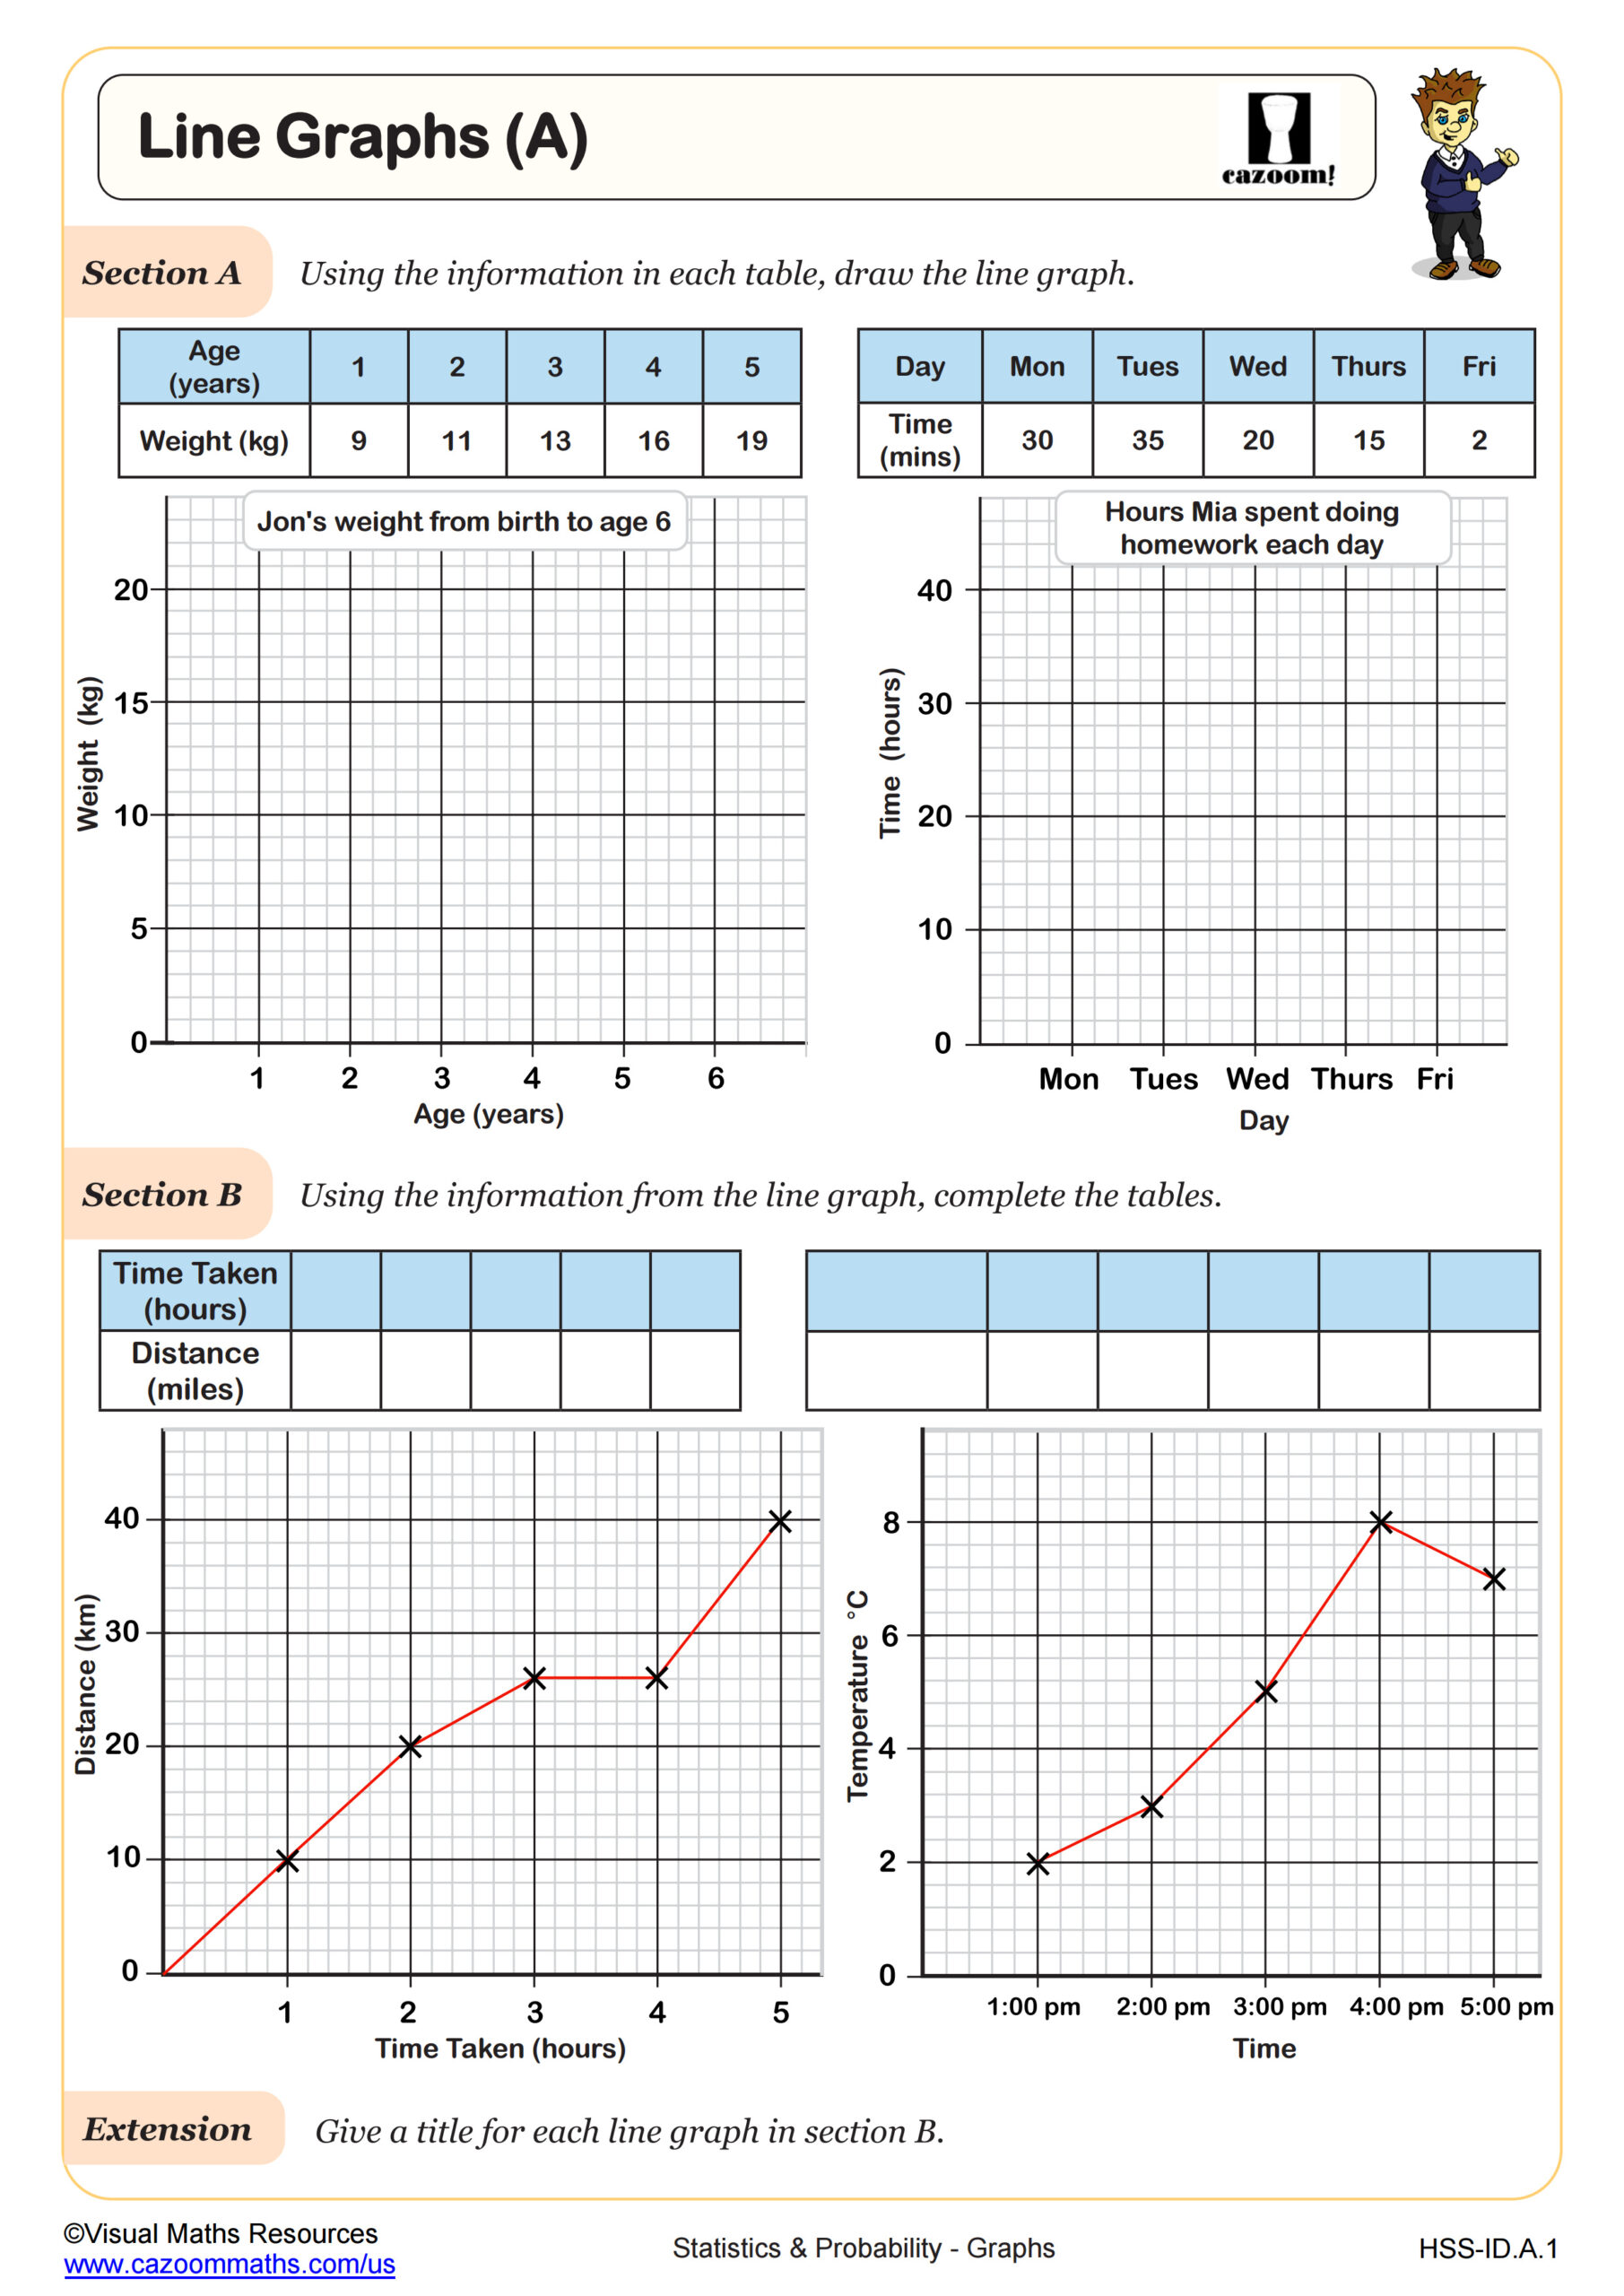
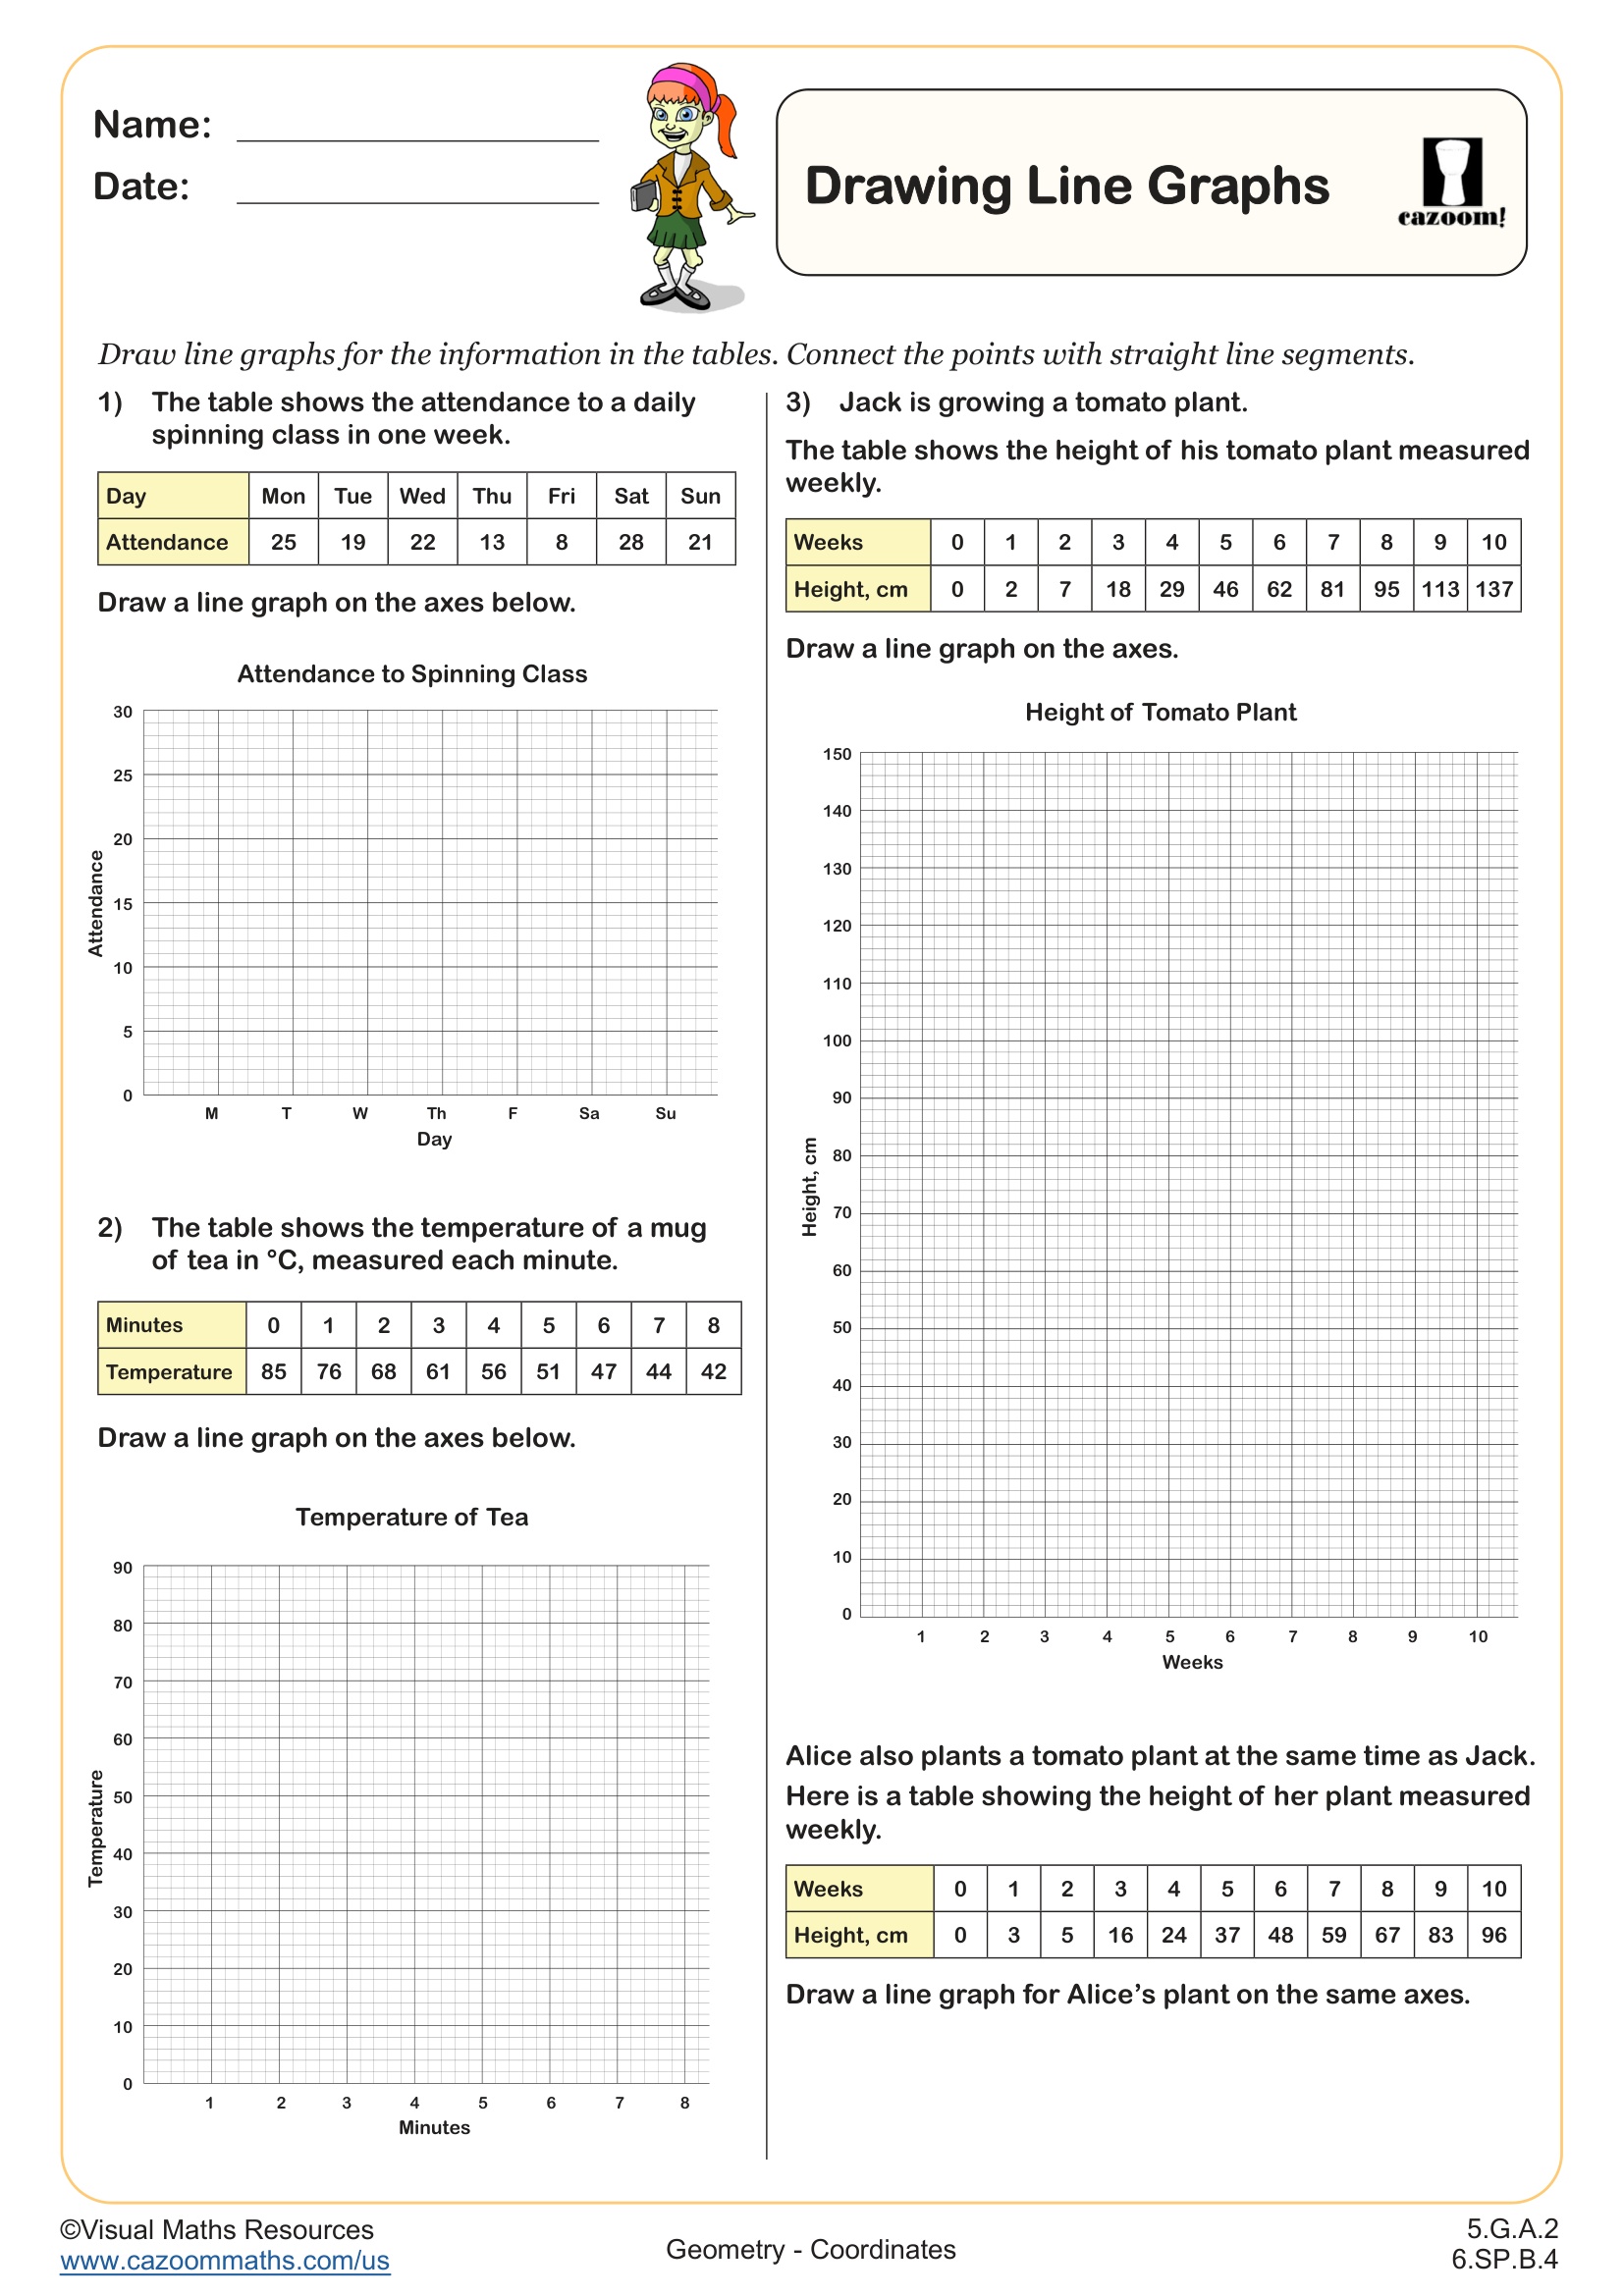
Interpreting Line Graphs WORKSHEET
Suitable for Grades: 5th Grade, 6th Grade
CCSS: 5.G.A.2, 6.SP.B.4
CCSS Description: CCSS Description: Represent real world and mathematical problems by graphing points in the first quadrant of the coordinate plane, and interpret coordinate values of points in the context of the situation.
Display numerical data in plots on a number line, including dot plots, histograms, and box plots.
Display numerical data in plots on a number line, including dot plots, histograms, and box plots.
Interpreting Line Graphs WORKSHEET DESCRIPTION
This worksheet provides two lone graphs to read from and interpret. Question 1 provides a graph charting the height of a palm tree and question 2 shows the rainfall measured over the course of a year for two different towns. Leaners will need to read the scales carefully and choose the correct data points for each question.
All worksheets are created by the team of experienced teachers at Cazoom Math.

RELATED TO Interpreting Line Graphs WORKSHEET
Frequently Asked Questions
This interpreting line graphs worksheet is designed for students in 5th Grade and 6th Grade and aligns with Common Core State Standards.