Back to:
Linear Equations and Tables of Values (A) WORKSHEET
Suitable for Grades: 8th Grade, Algebra I
CCSS: 8.F.B.4, HSF.LE.A.2
CCSS Description: Construct a function to model a linear relationship between two quantities. Determine the rate of change and initial value of the function from a description of a relationship or from two (x, y) values, including reading these from a table or from a graph. Interpret the rate of change and initial value of a linear function in terms of the situation it models, and in terms of its graph or a table of values.
Construct linear and exponential functions, including arithmetic and geometric sequences, given a graph, a description of a relationship, or two input‑output pairs (include reading these from a table).
Construct linear and exponential functions, including arithmetic and geometric sequences, given a graph, a description of a relationship, or two input‑output pairs (include reading these from a table).
Linear Equations and Tables of Values (A) WORKSHEET DESCRIPTION
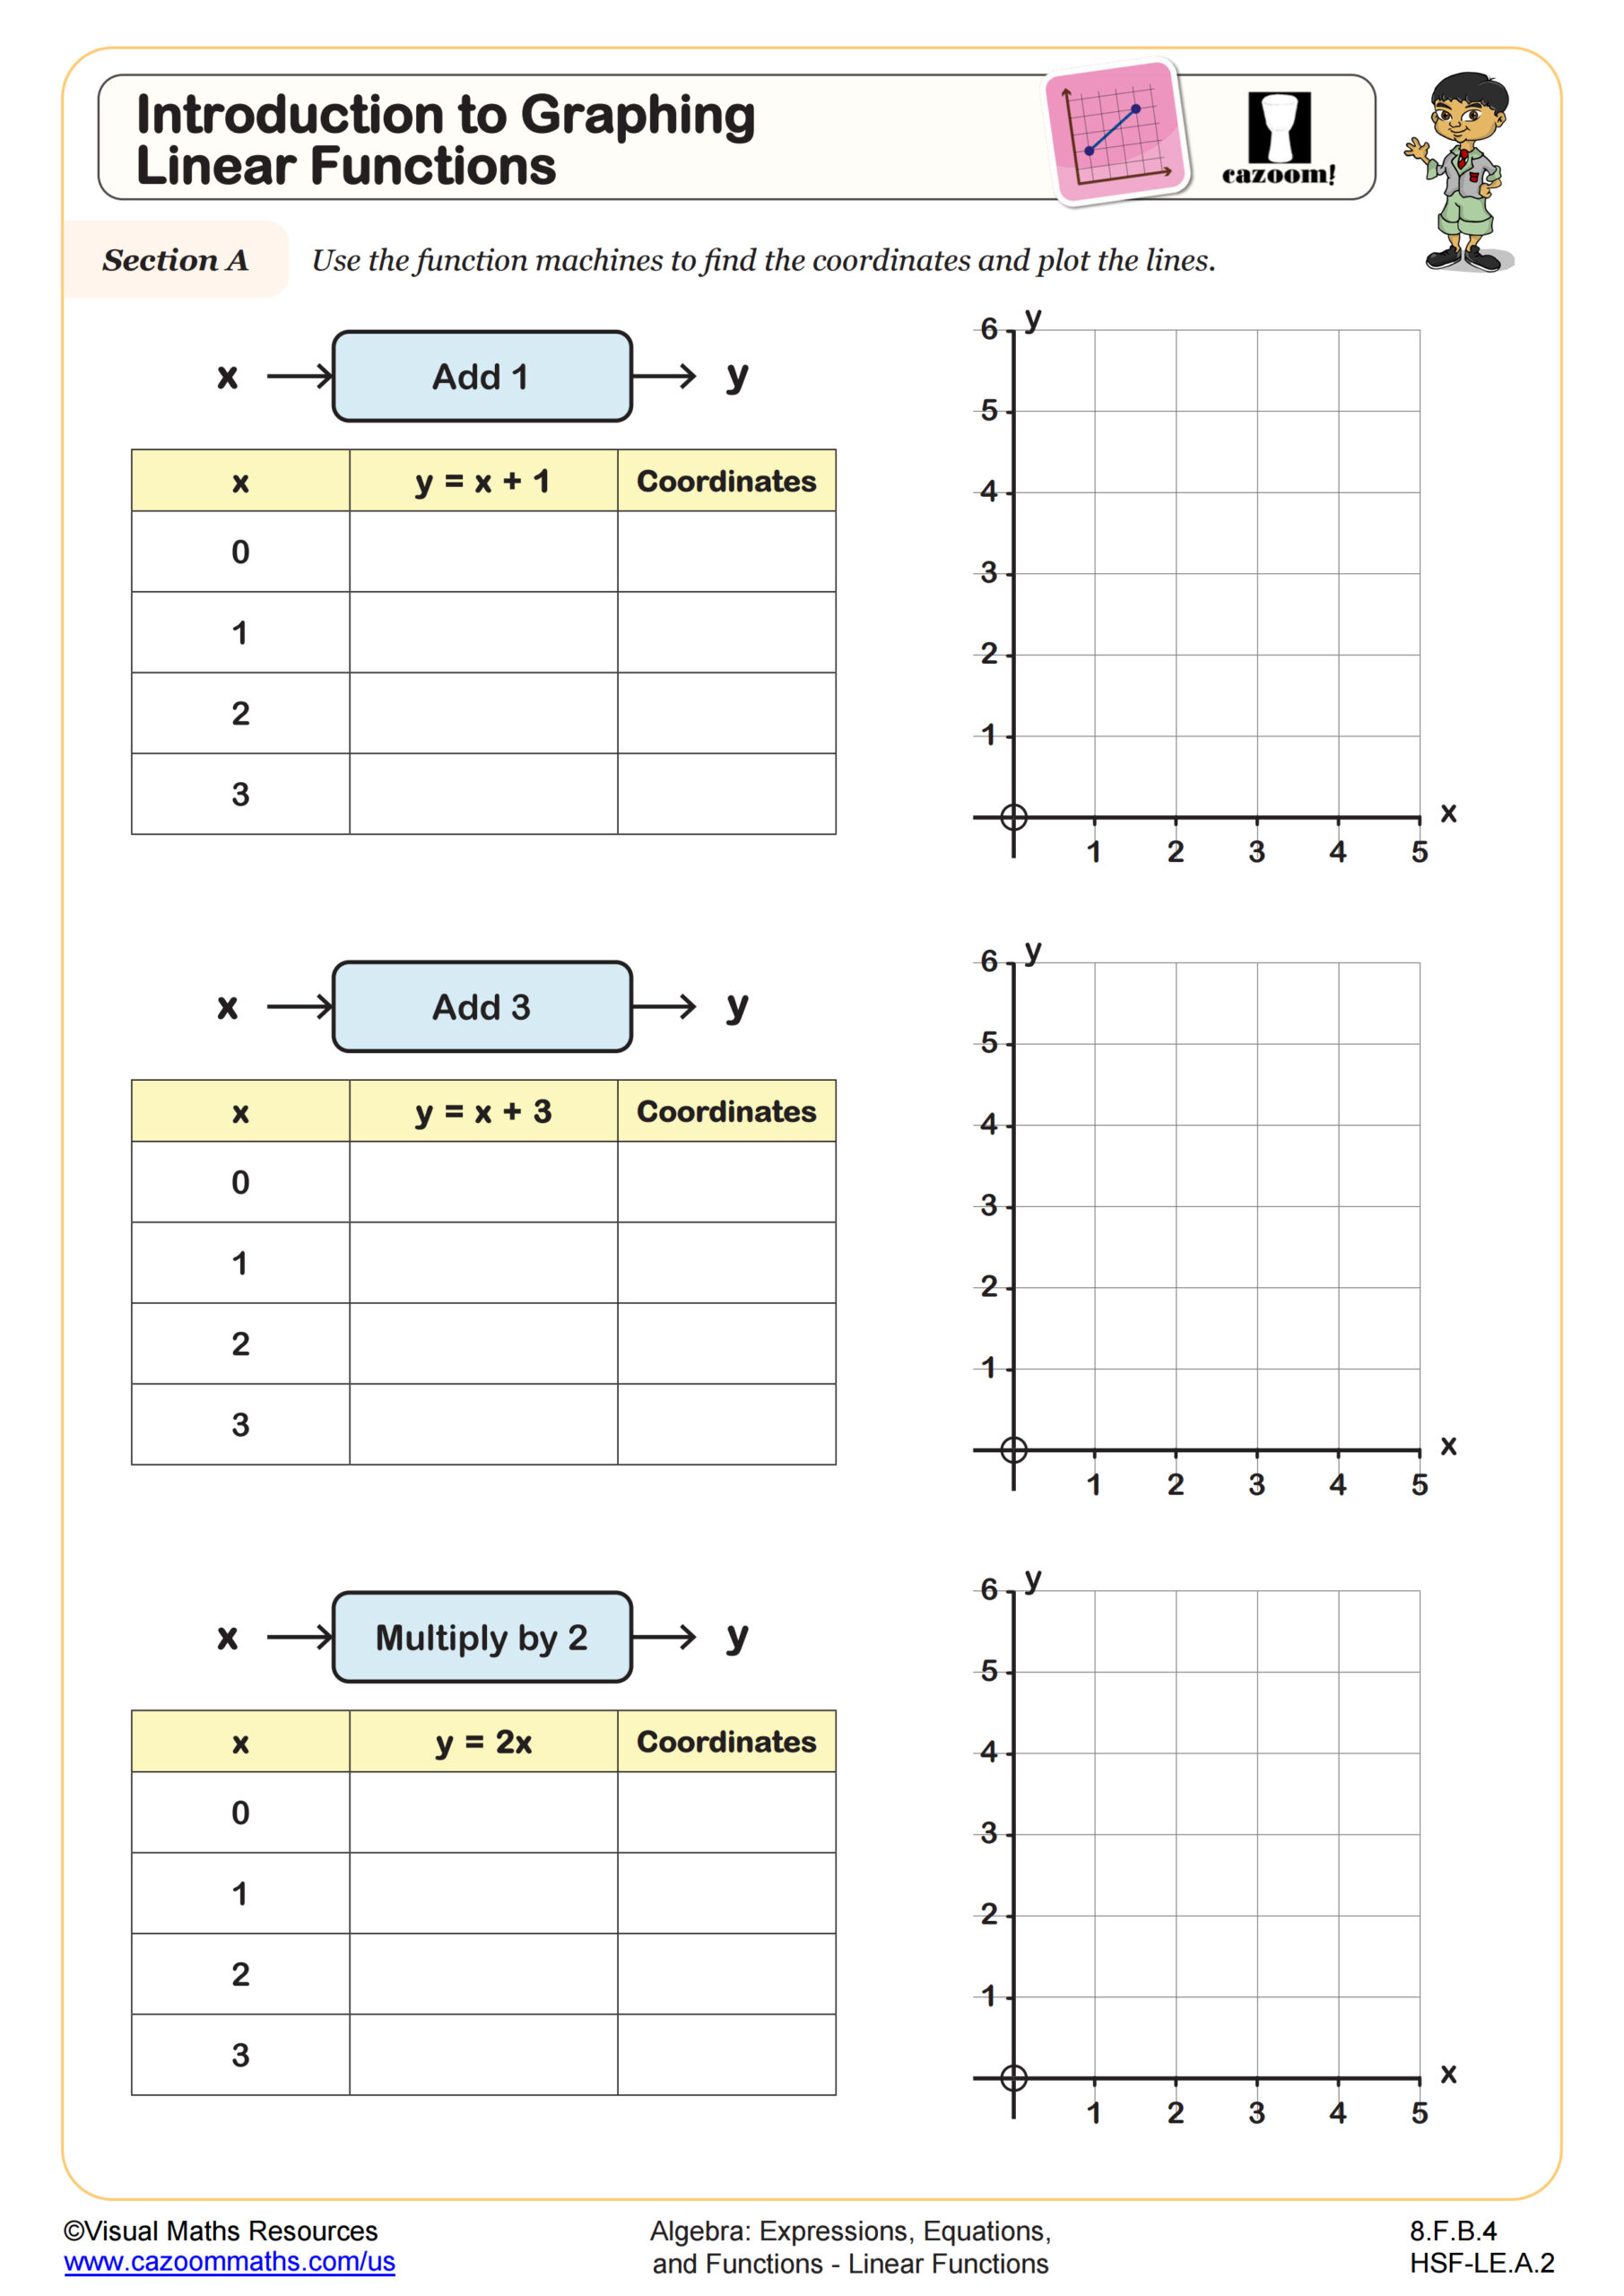
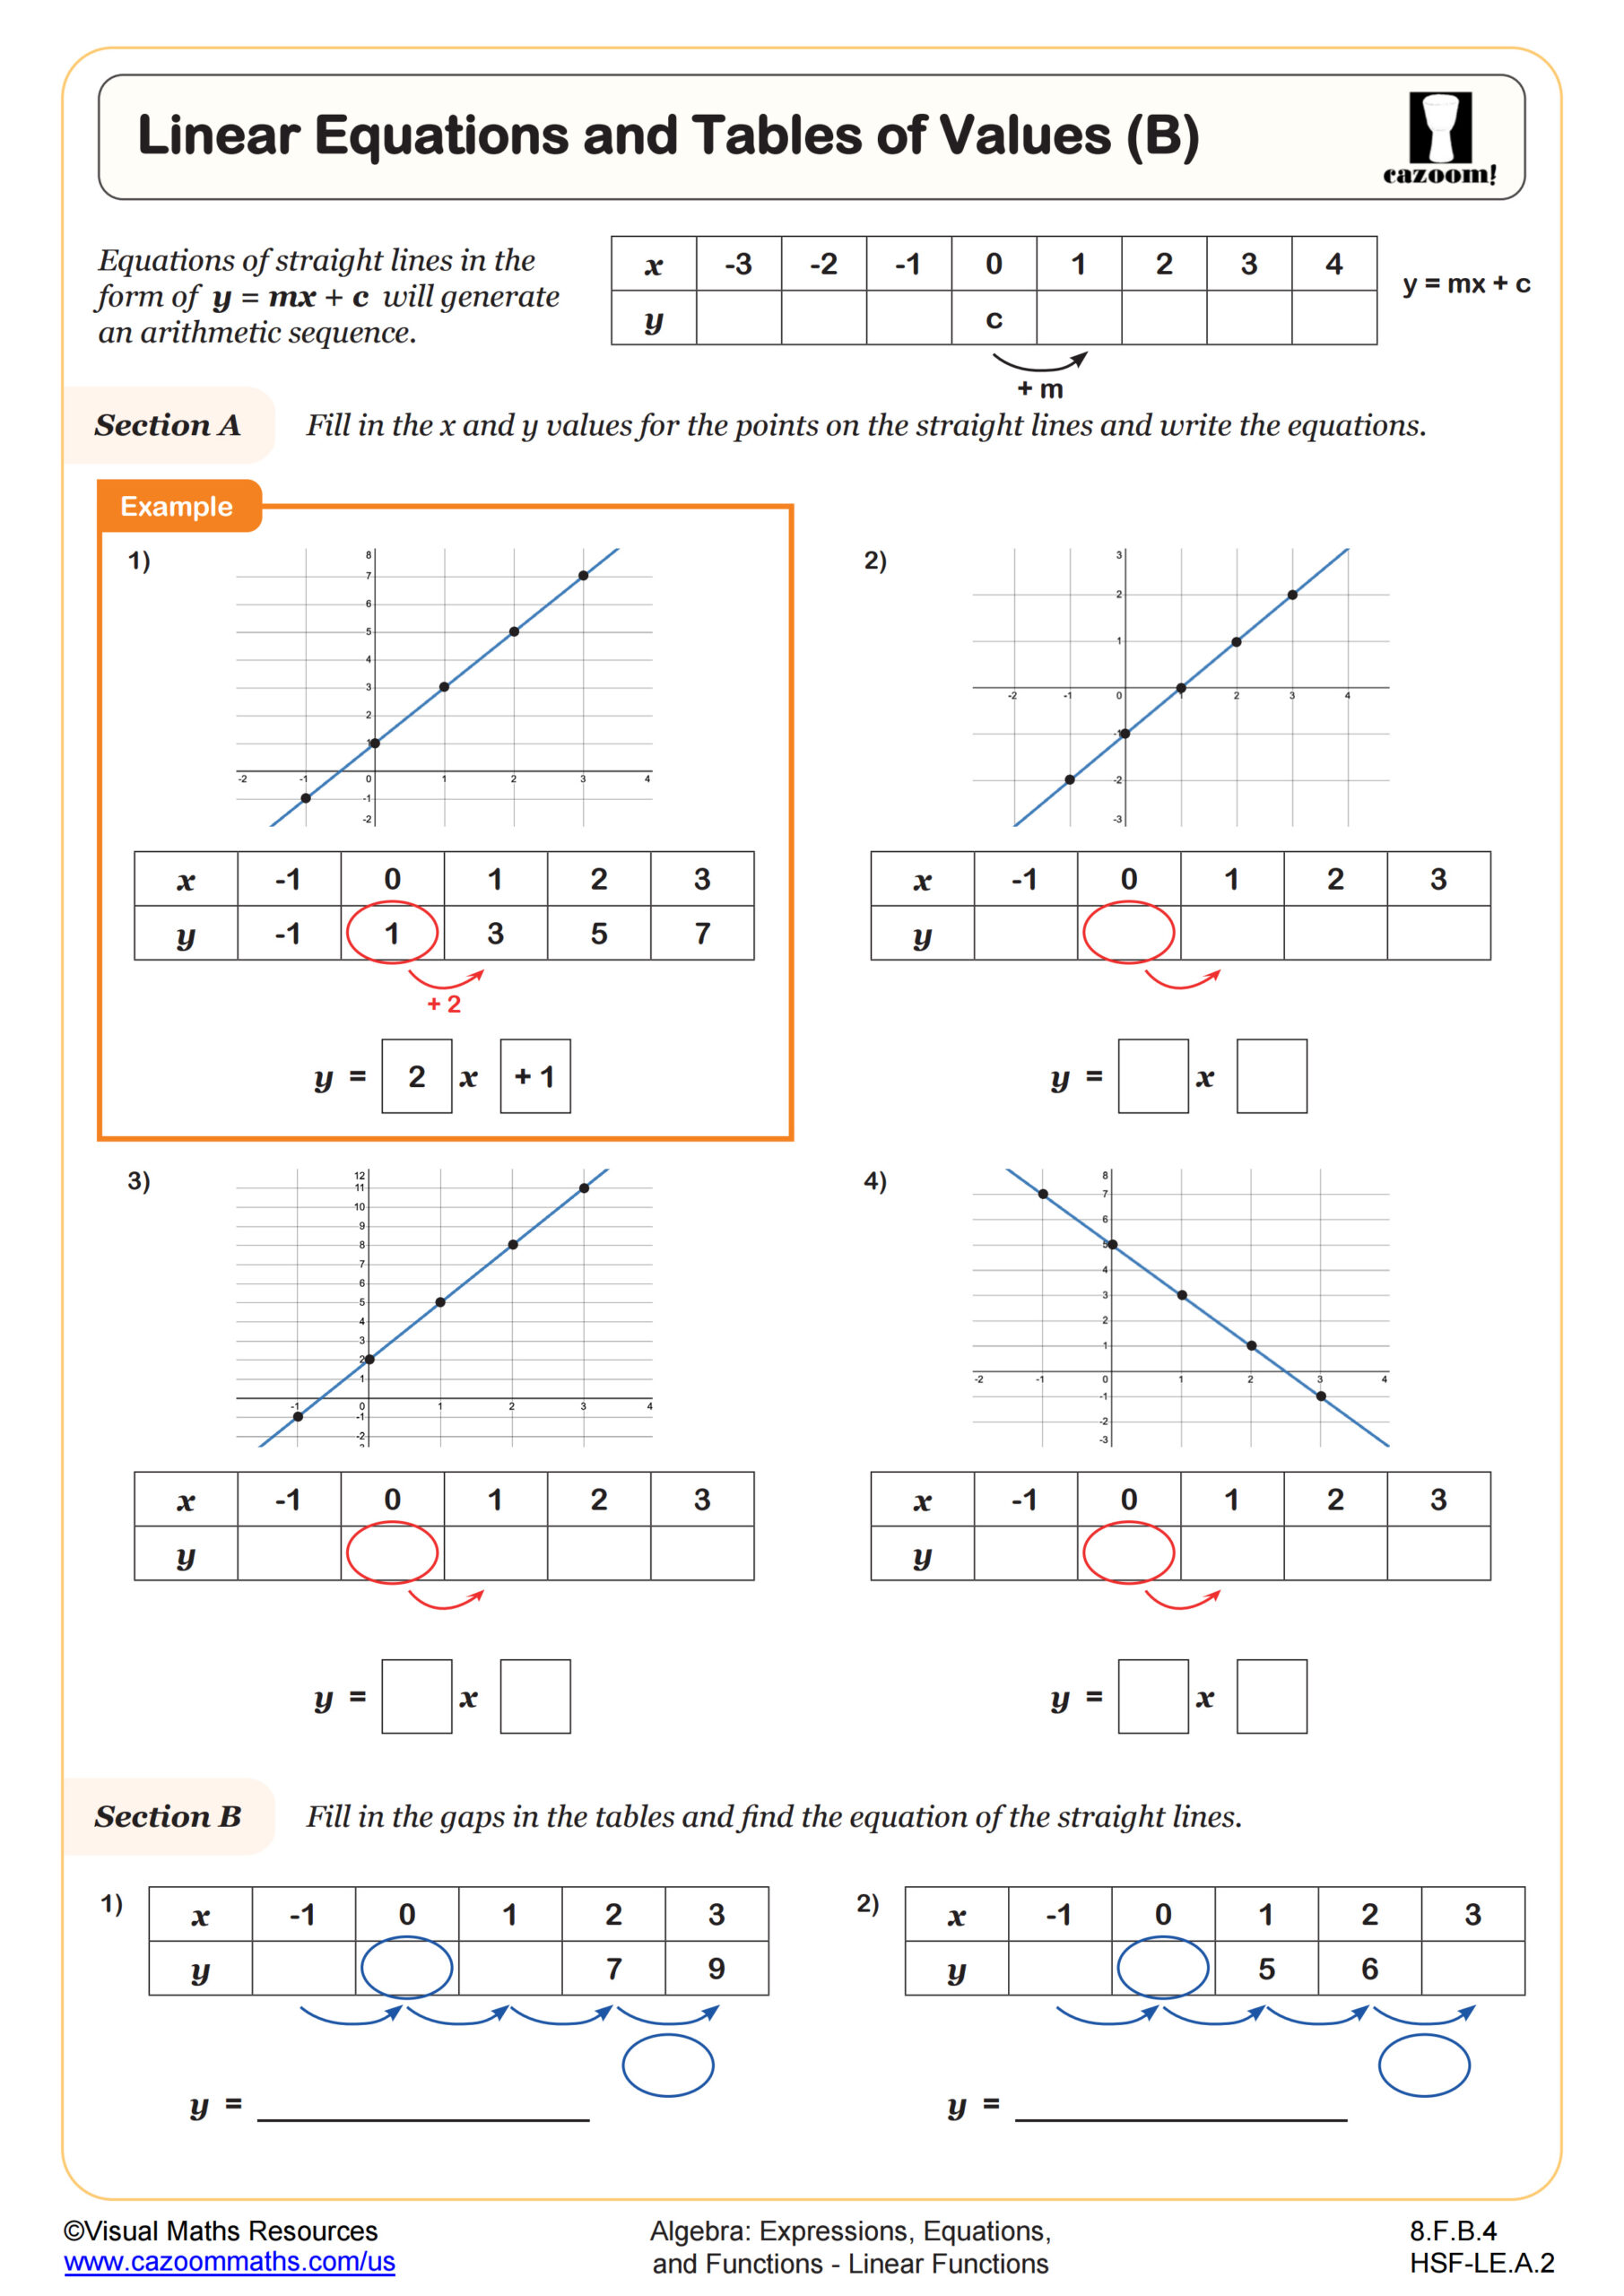
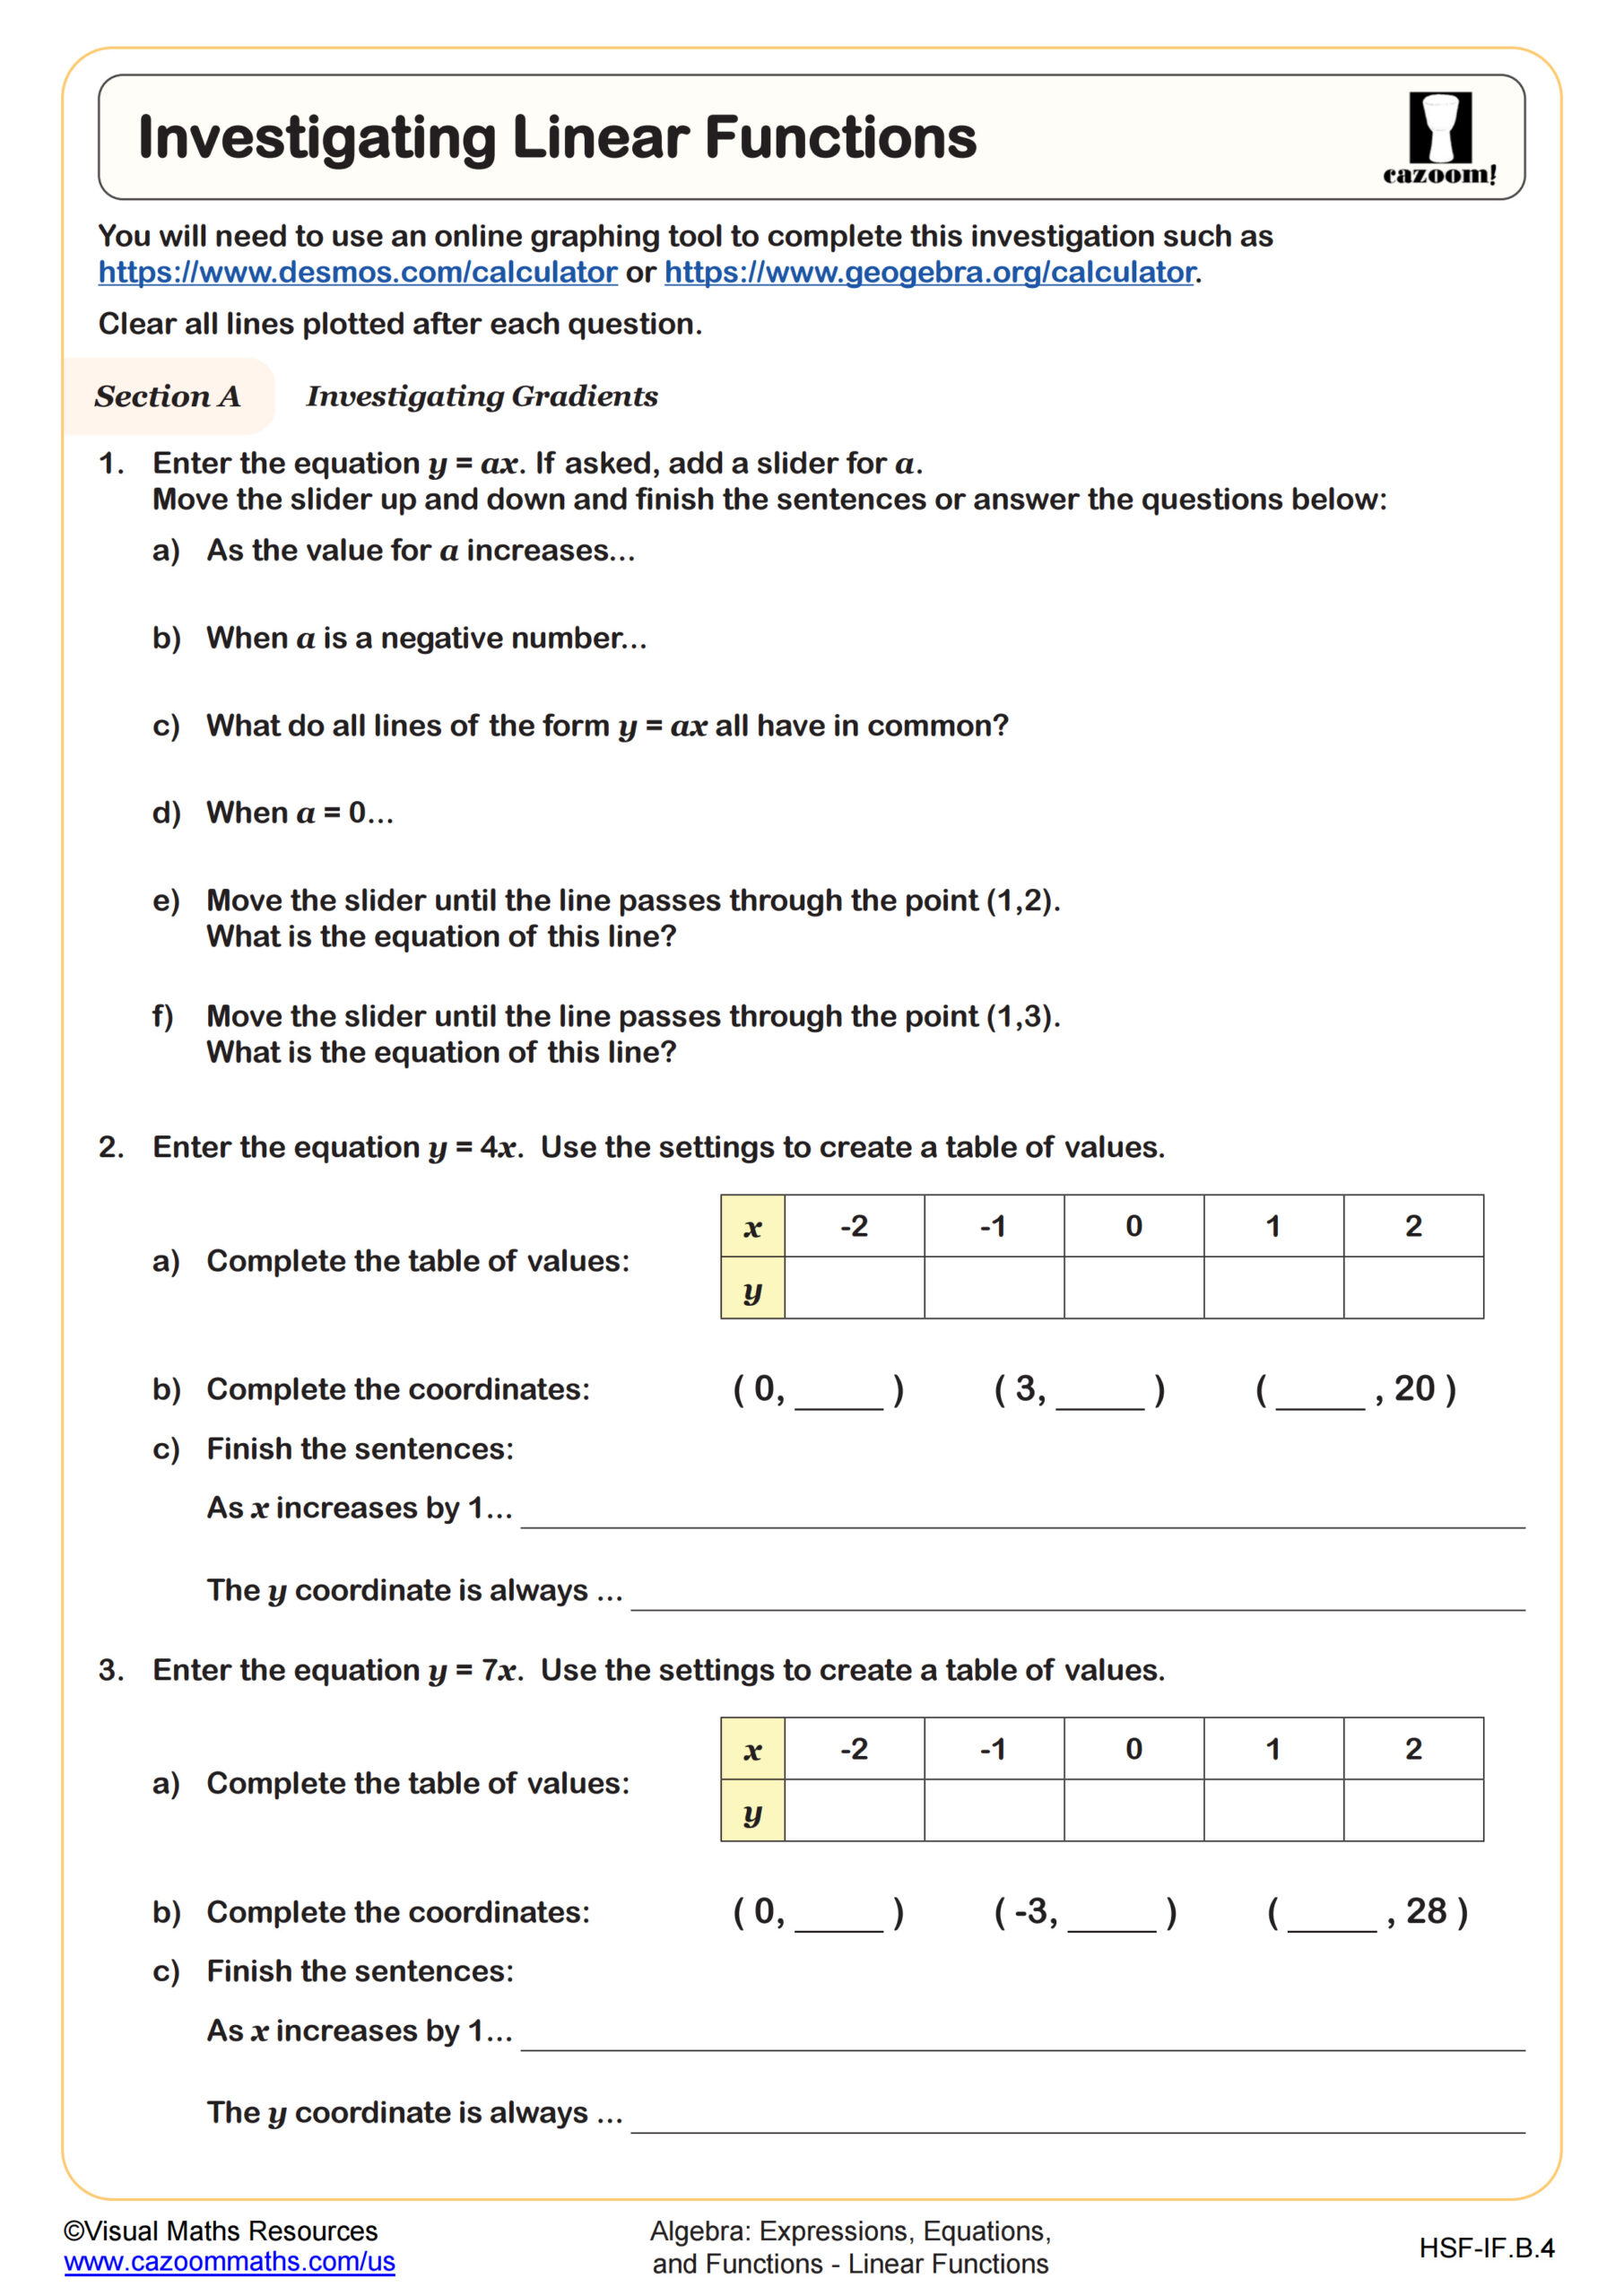
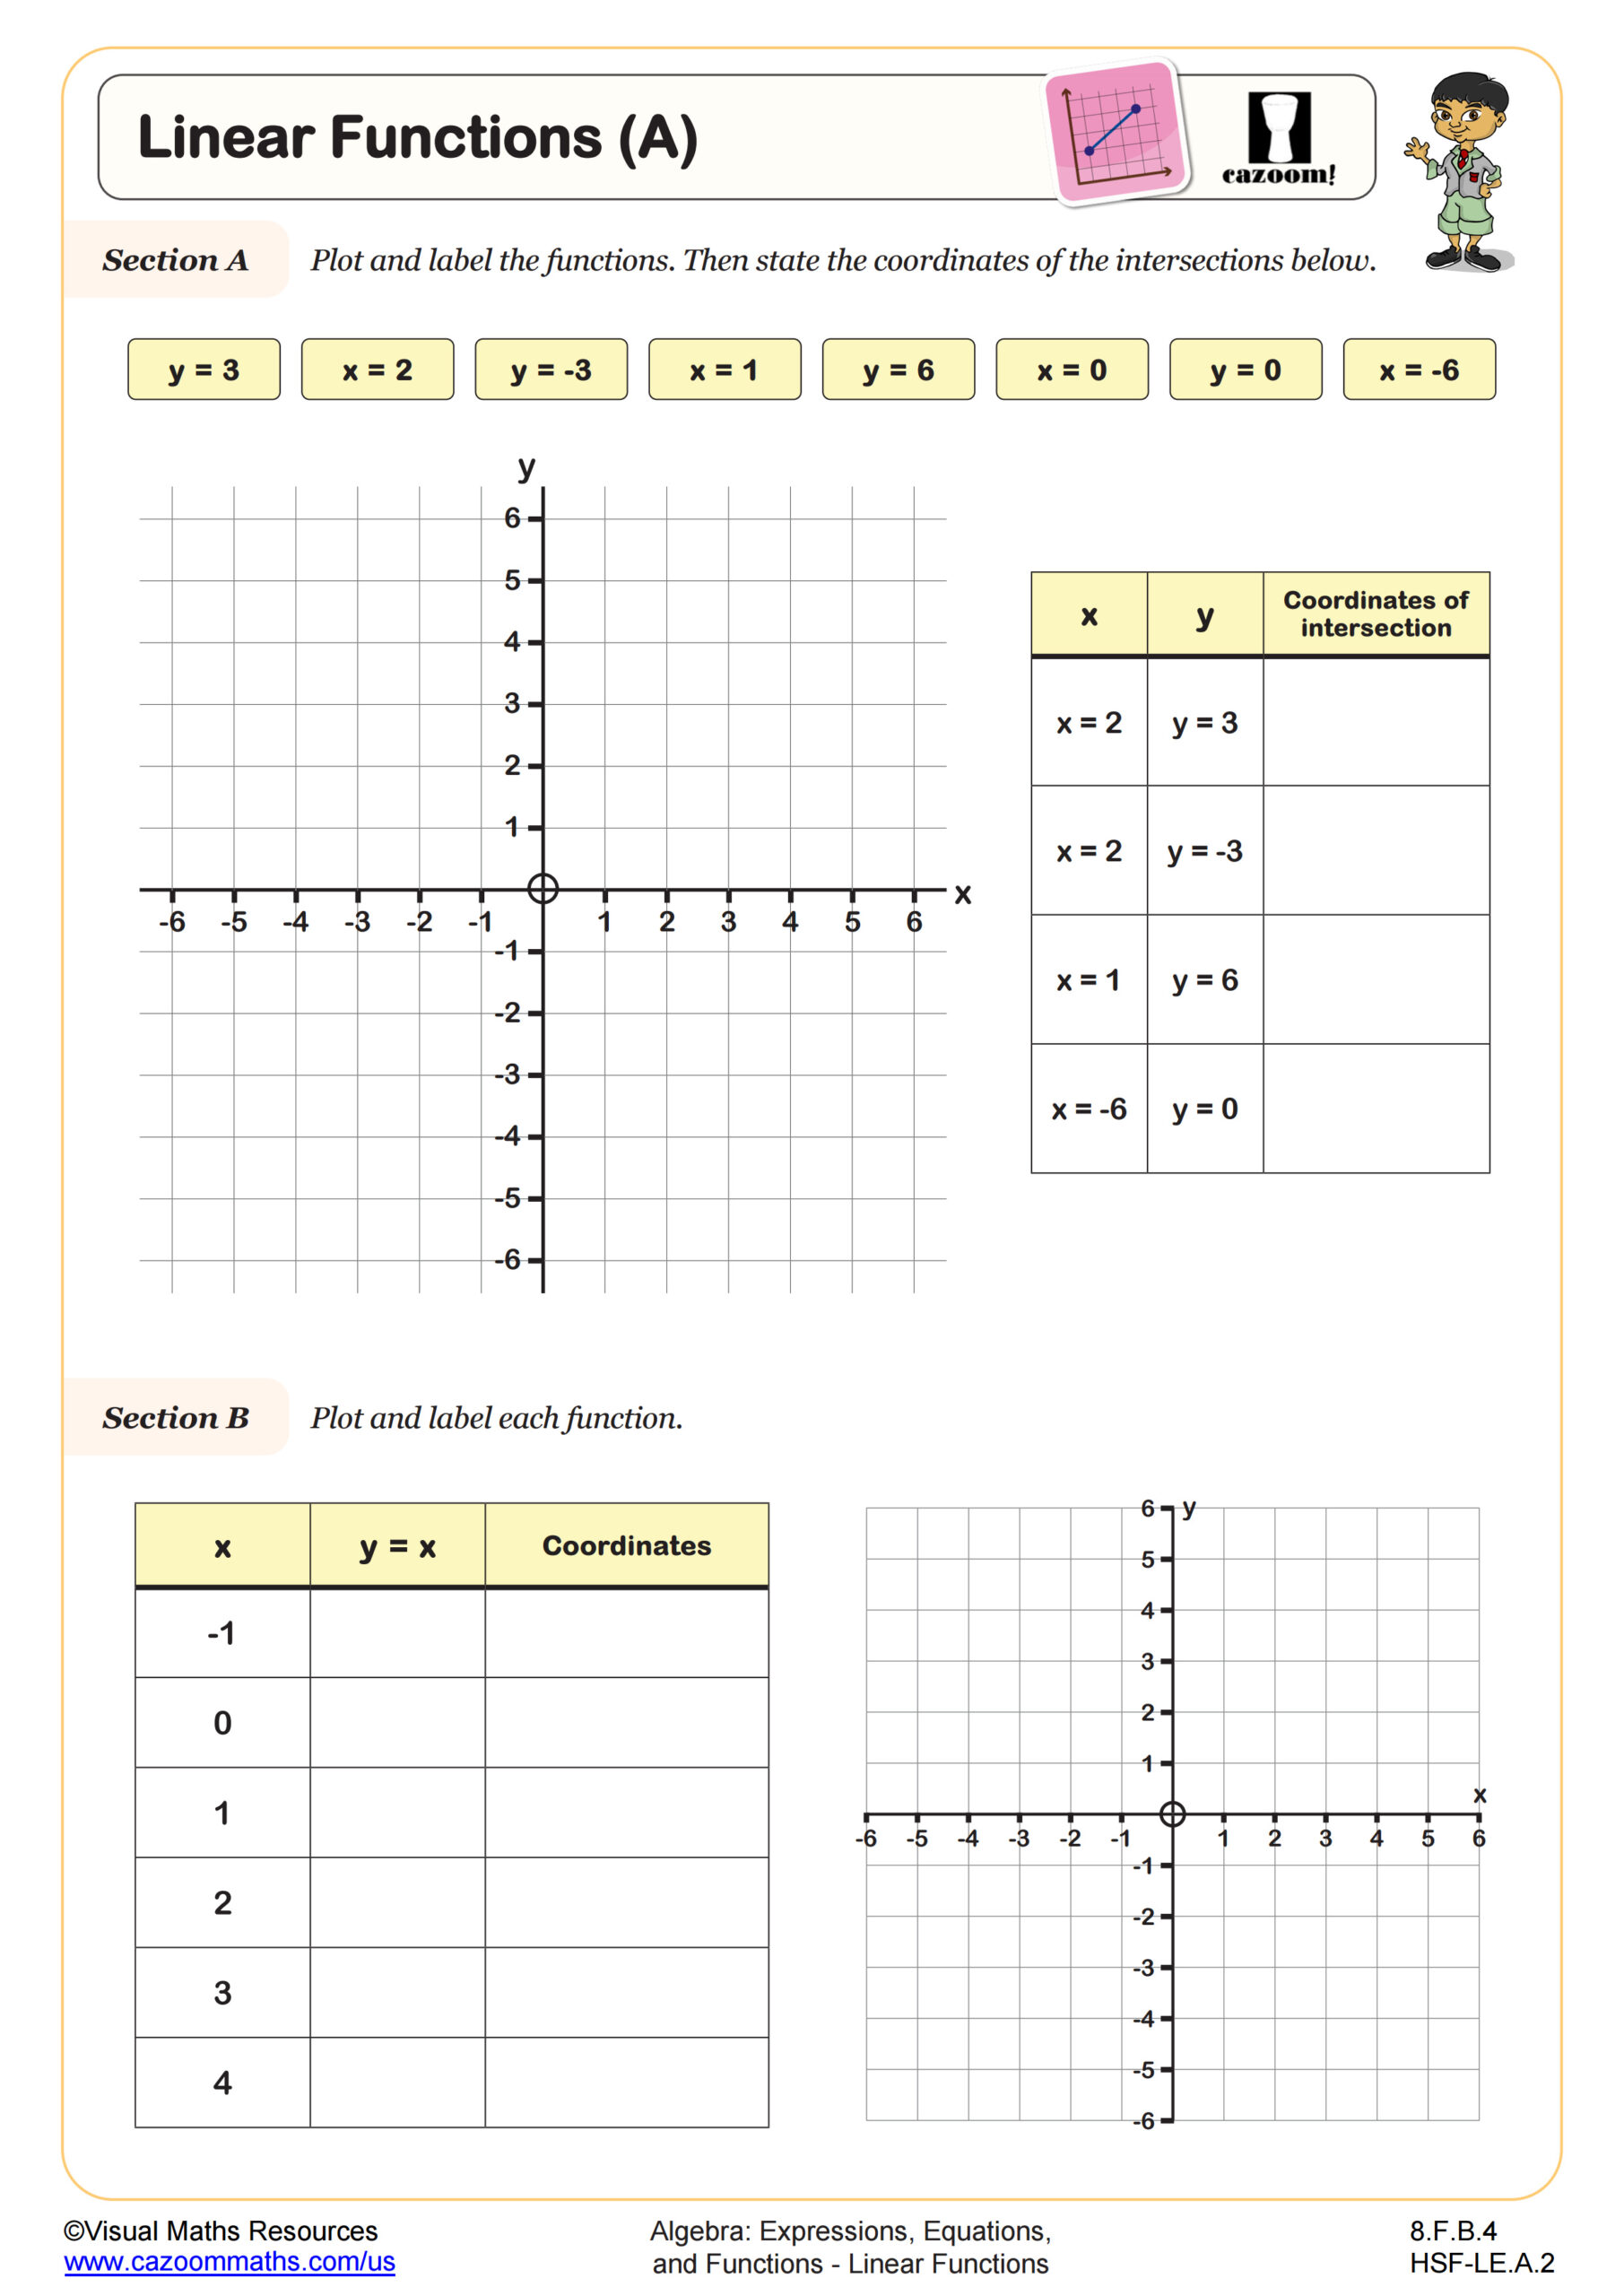
This worksheet gives a alternative view of straight line graphs equations in the form y=mx+b and their corresponding tables of values. Section A asks learners to complete xy-tables for given straight line equations but highlights the fact that the intercept, b, will be below x=0, and the slope, m, will be the common difference of the y-values generated. Section B then asks learners to work backwards and use the facts from section A to write the equations of the lines from their xy-tables.
All worksheets are created by the team of experienced teachers at Cazoom Math.
")
RELATED TO Linear Equations and Tables of Values (A) WORKSHEET
Frequently Asked Questions
This linear equations and tables of values (a) worksheet is designed for students in 8th Grade and Algebra I and aligns with Common Core State Standards.