Linear Equations and Tables of Values (B) WORKSHEET
Construct linear and exponential functions, including arithmetic and geometric sequences, given a graph, a description of a relationship, or two input‑output pairs (include reading these from a table).
Linear Equations and Tables of Values (B) WORKSHEET DESCRIPTION
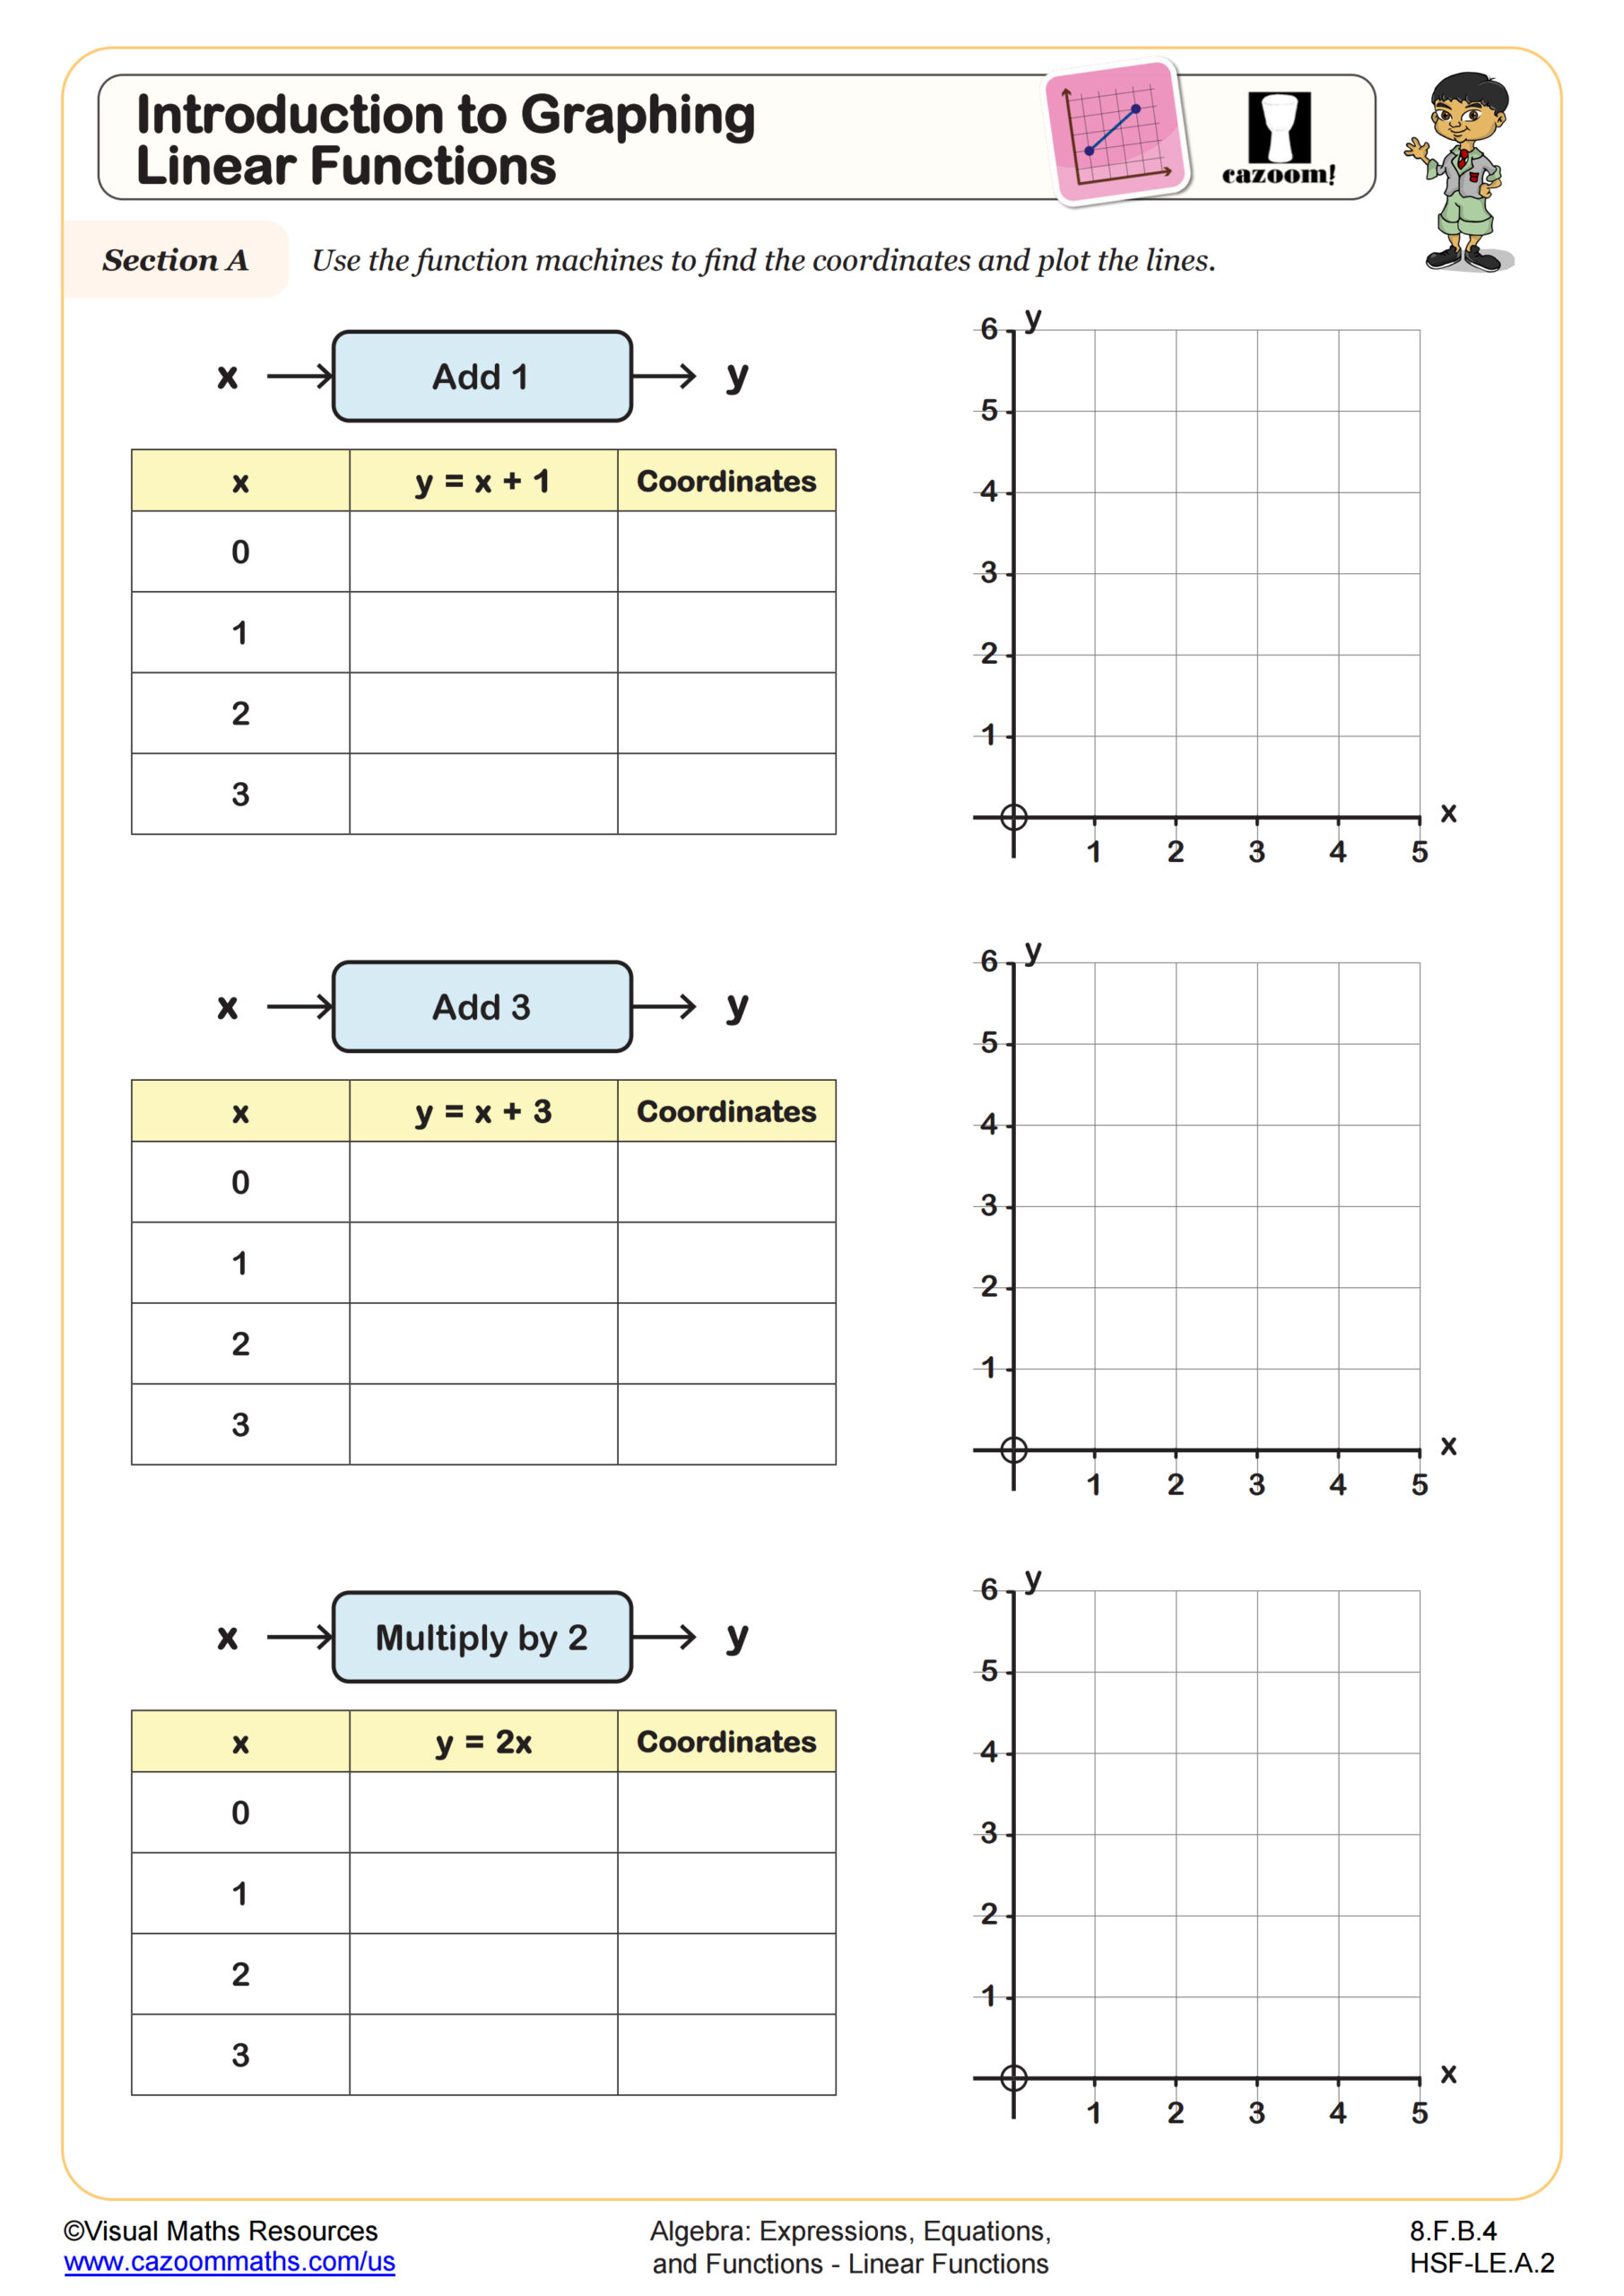
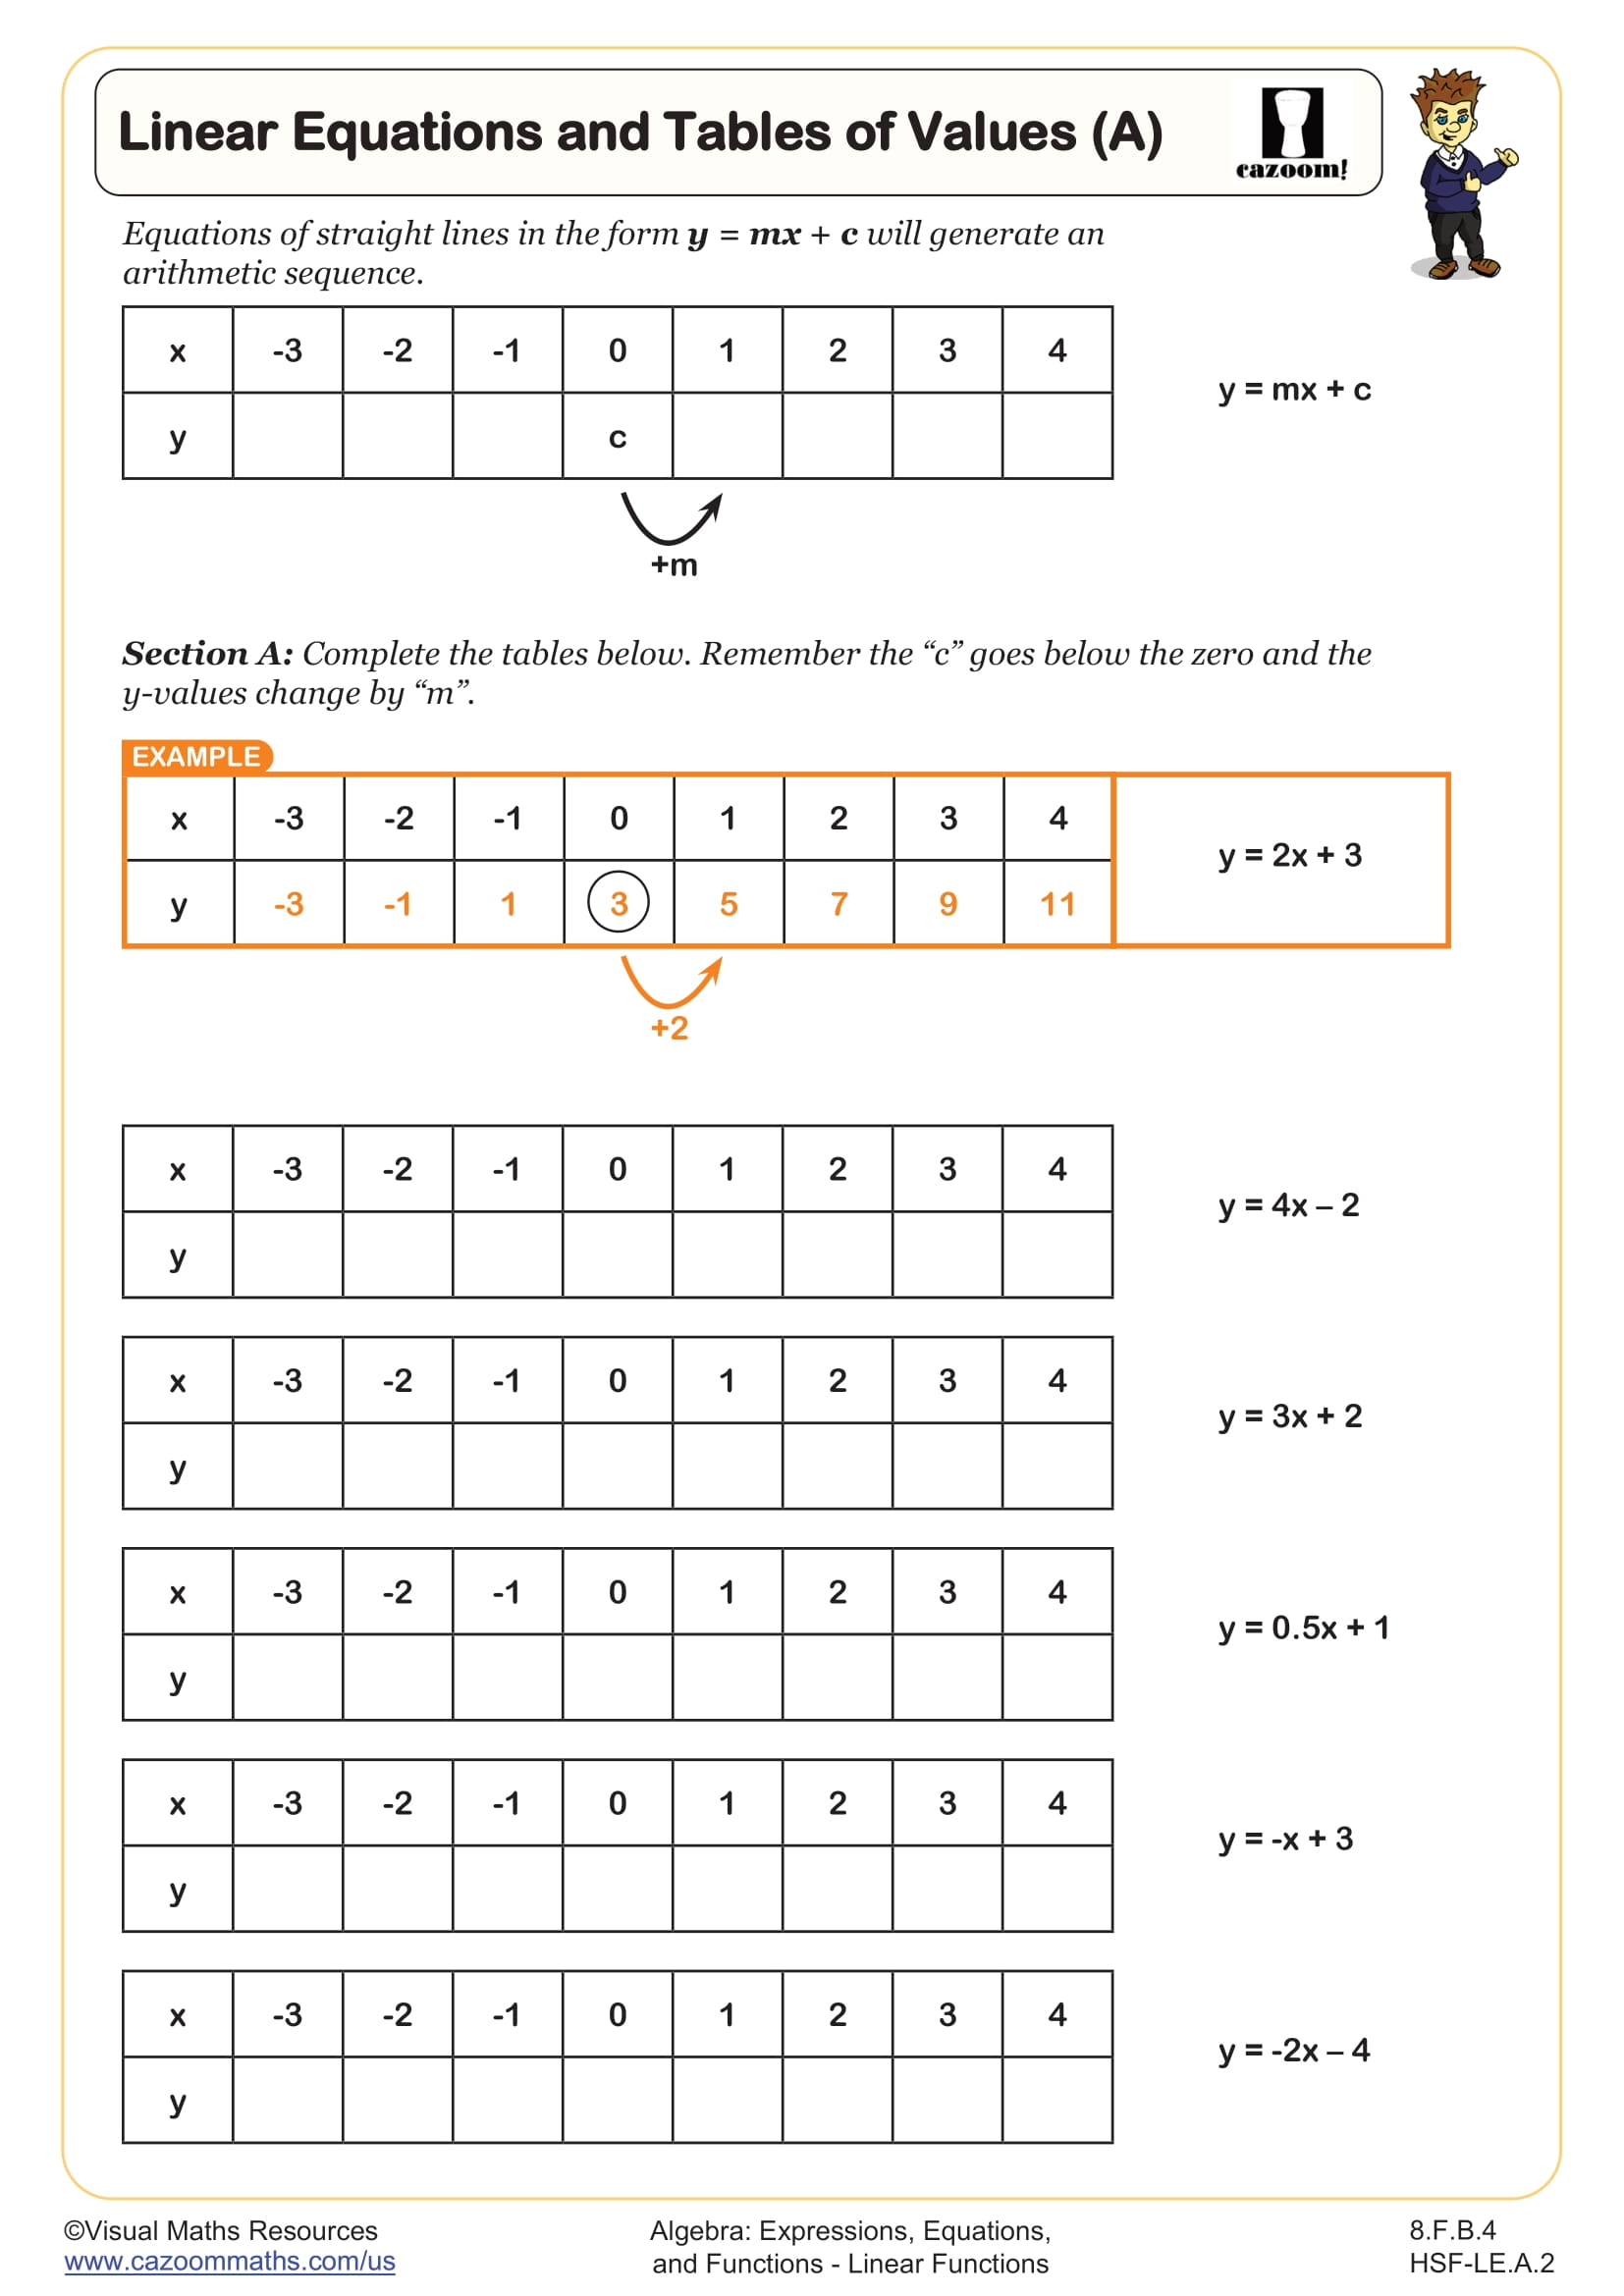
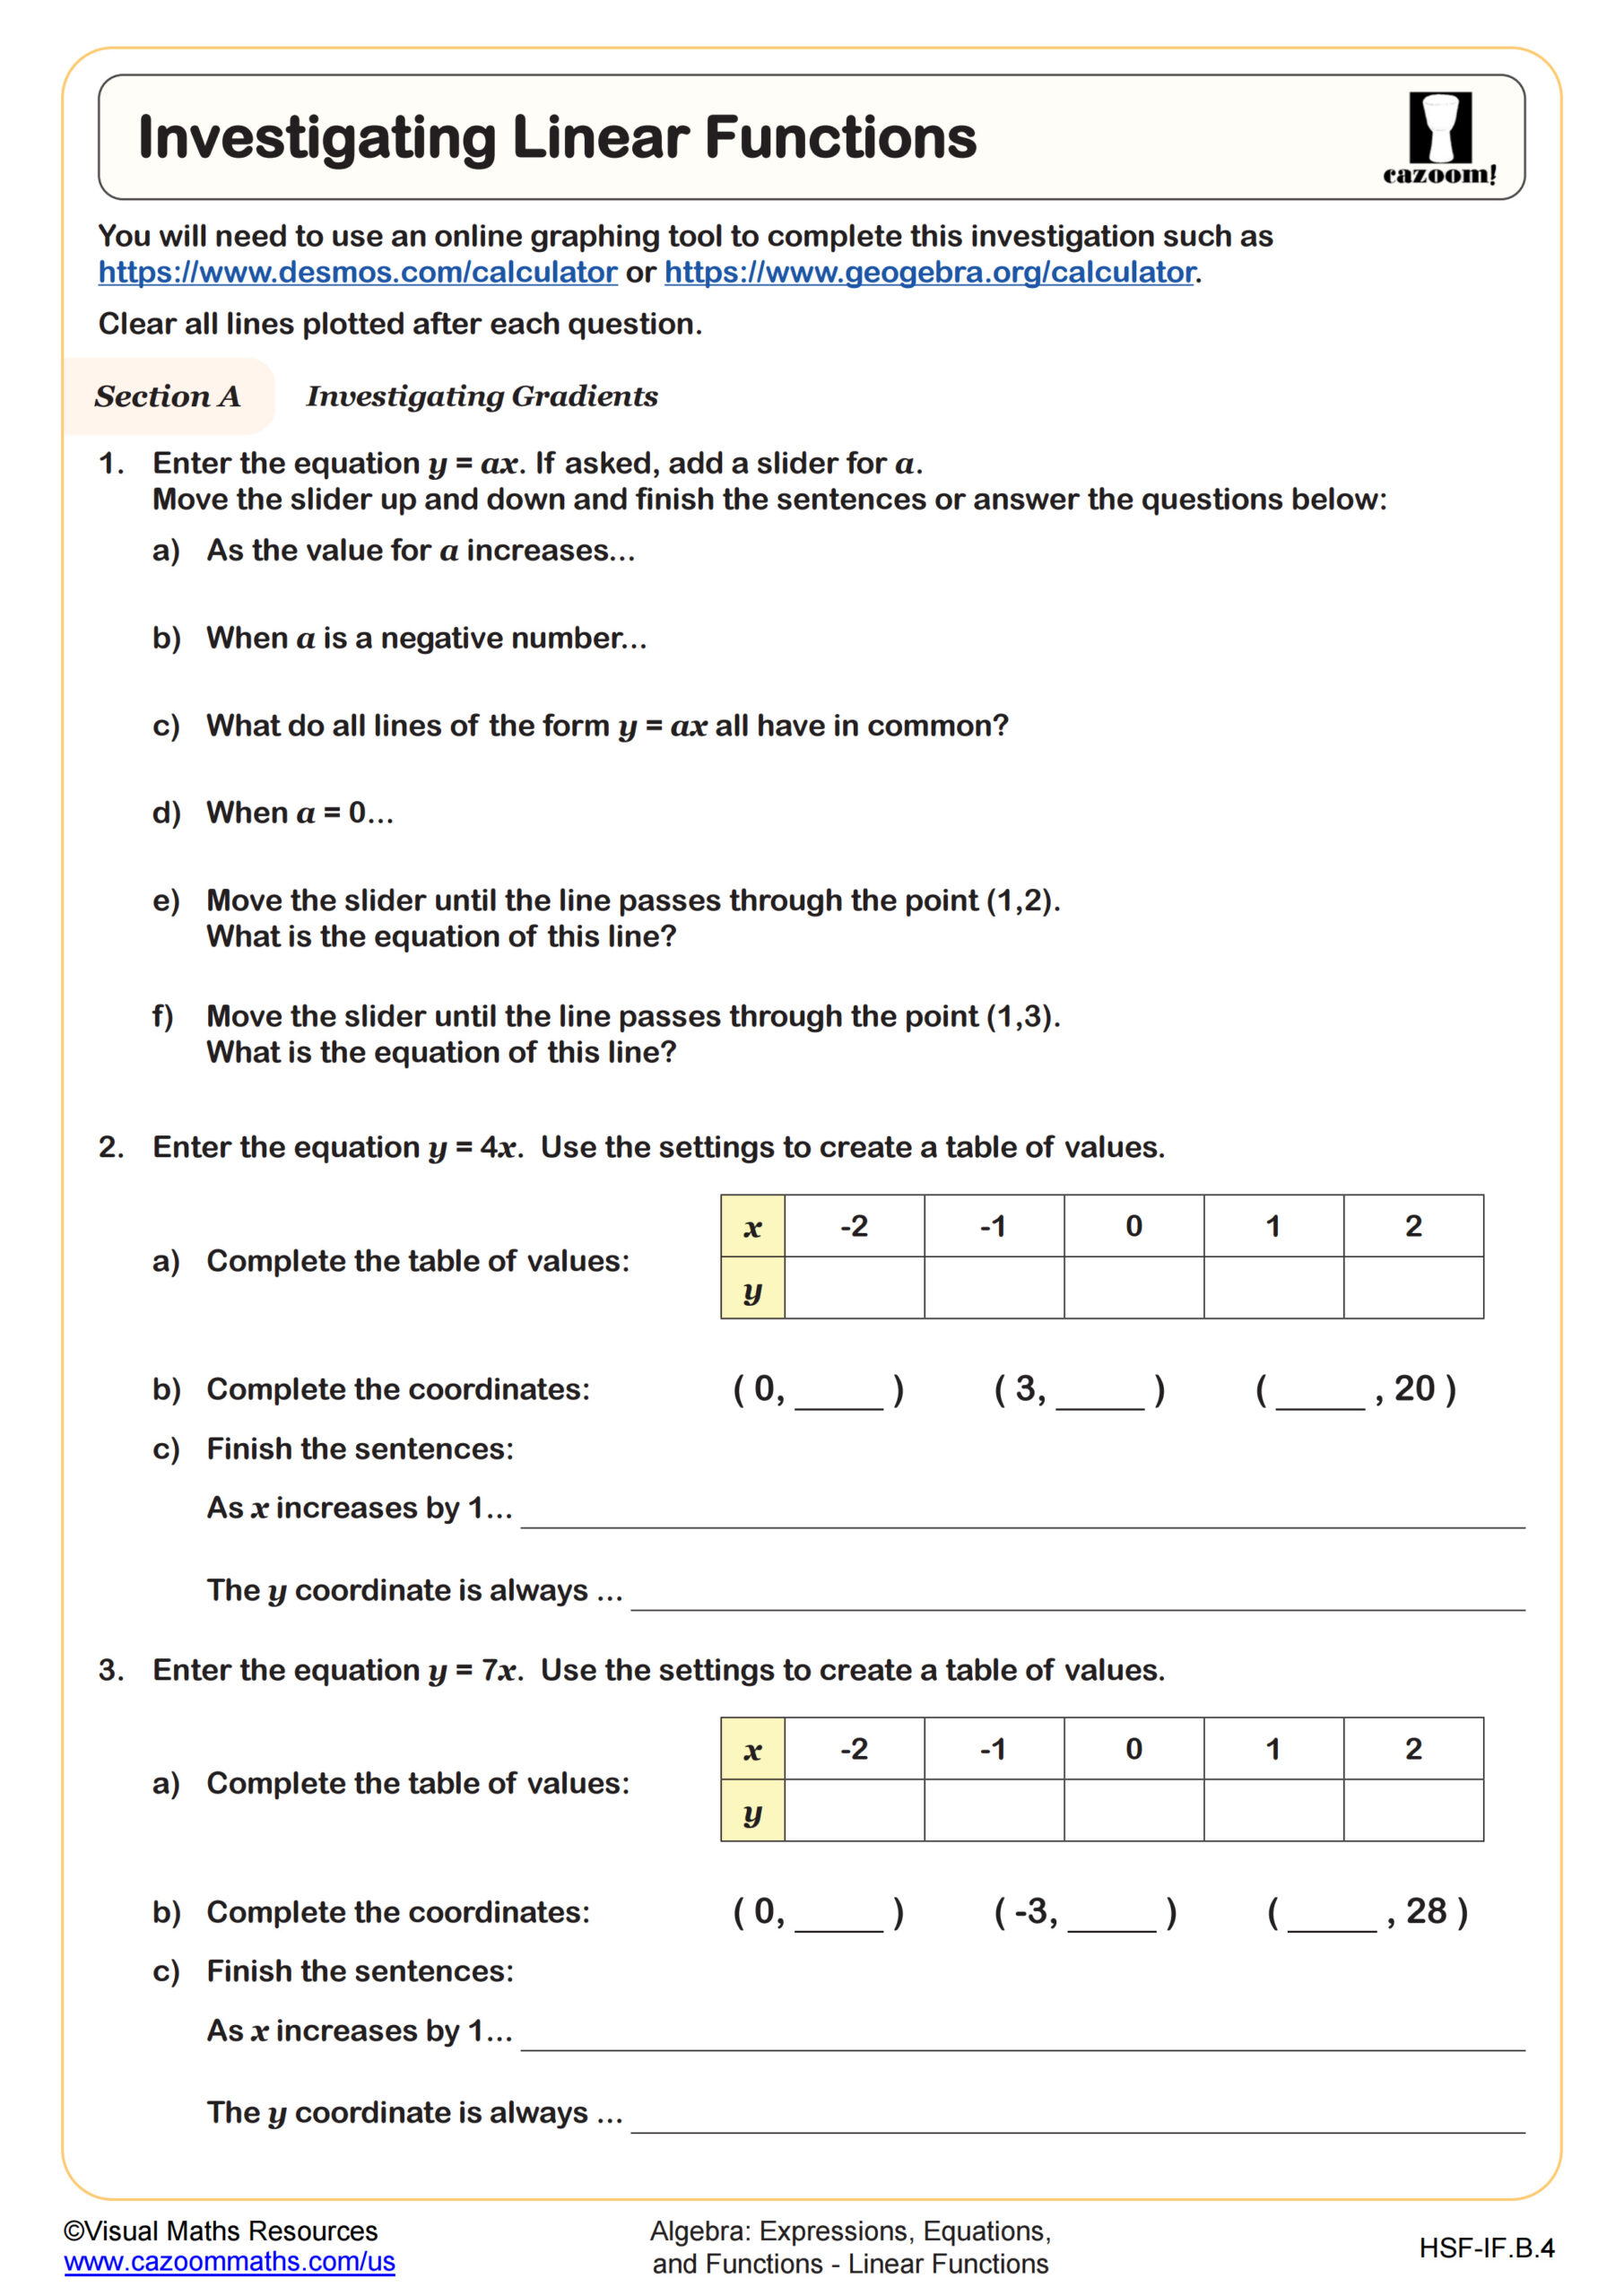
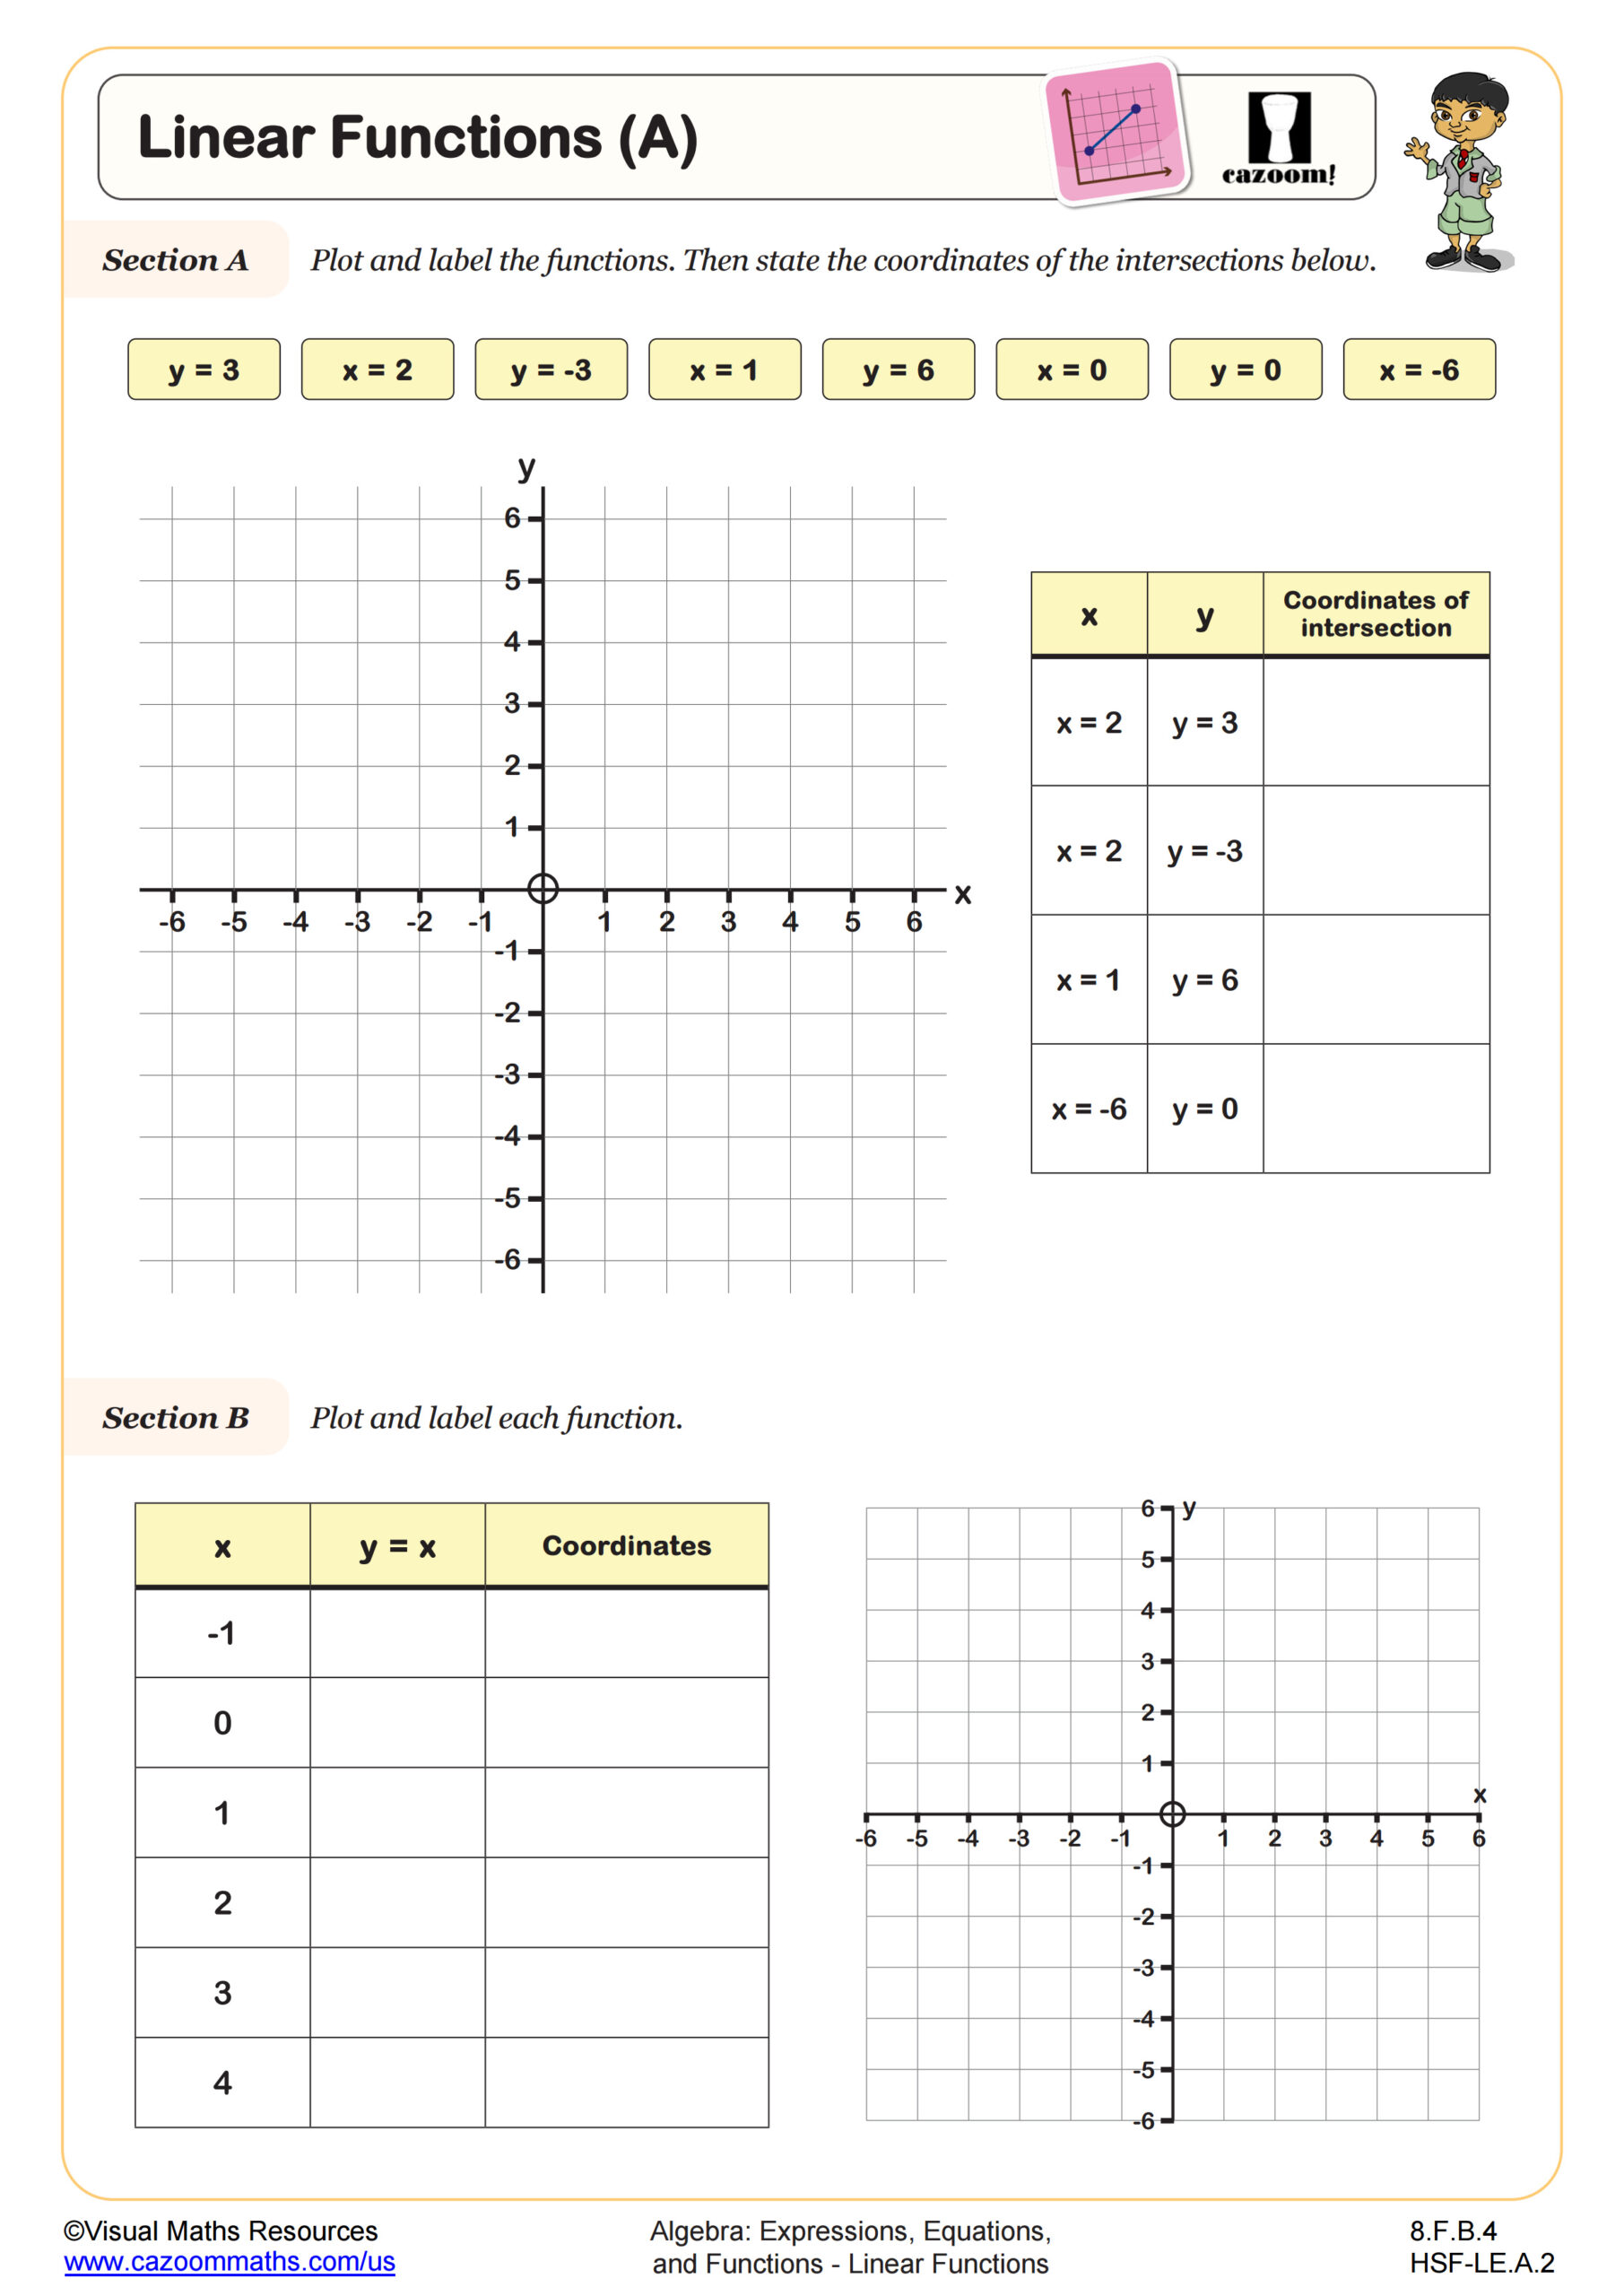
This worksheet follows on from Linear Equations and Tables of Values (A) by using the tables of values to help derive the equations of straight line graphs. Section A provides some plotted graphs and asks learners to fill in the tables of values and then find the equation using the scaffolding provided. Section B then gives some incomplete xy-tables for learners the find the sequence, complete the table, and hence, find the equation. Section C then gives two coordinates and blank xy-tables for learners to fill in the given points, find the common difference for the sequence of y-values, and then state the equation.
All worksheets are created by the team of experienced teachers at Cazoom Math.
 Worksheet")
RELATED TO Linear Equations and Tables of Values (B) WORKSHEET
Frequently Asked Questions
This linear equations and tables of values (b) worksheet is designed for students in 8th Grade and Algebra I and aligns with Common Core State Standards.