Linear Functions (A) WORKSHEET
Construct linear and exponential functions, including arithmetic and geometric sequences, given a graph, a description of a relationship, or two input‑output pairs (include reading these from a table).
Linear Functions (A) WORKSHEET DESCRIPTION
This worksheet will review lines parallel to the x and y axis, as well as introduce straight lines in the form y = mx + b.
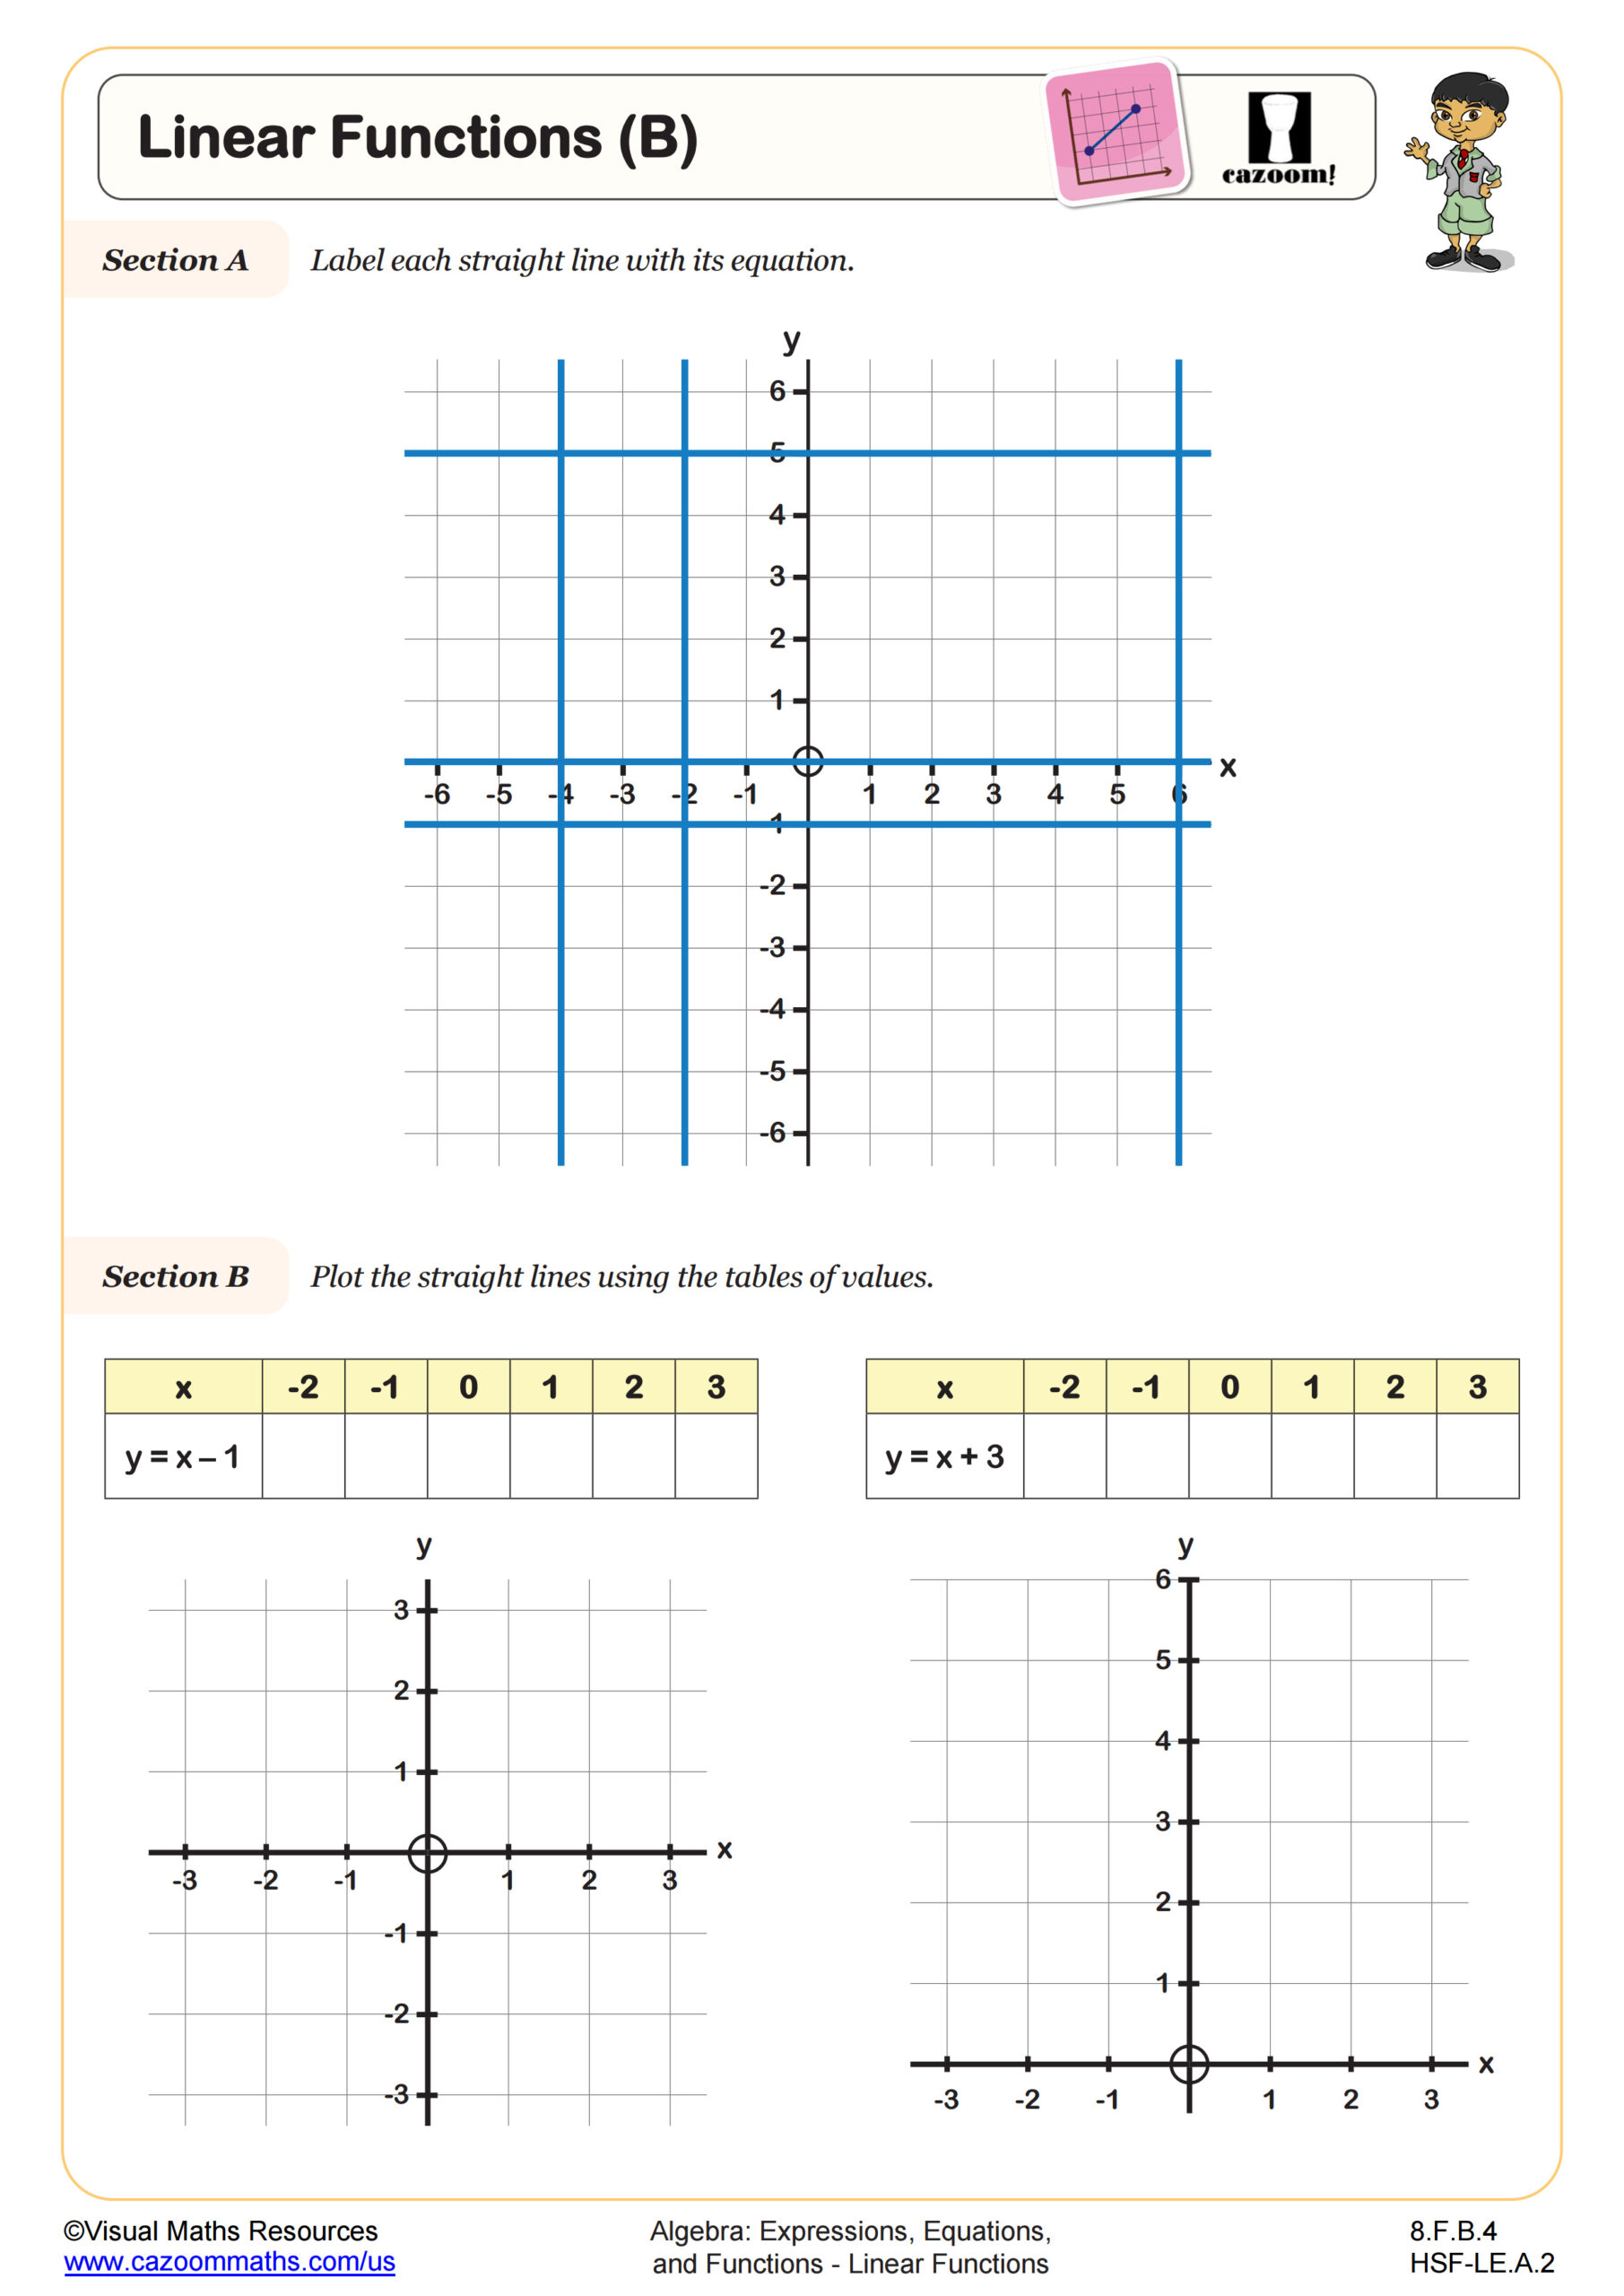
Section A kicks off with eight equations of lines in the form x = a and y = b, which students will plot on the same set of axes before considering the intersections of pairs of these lines.
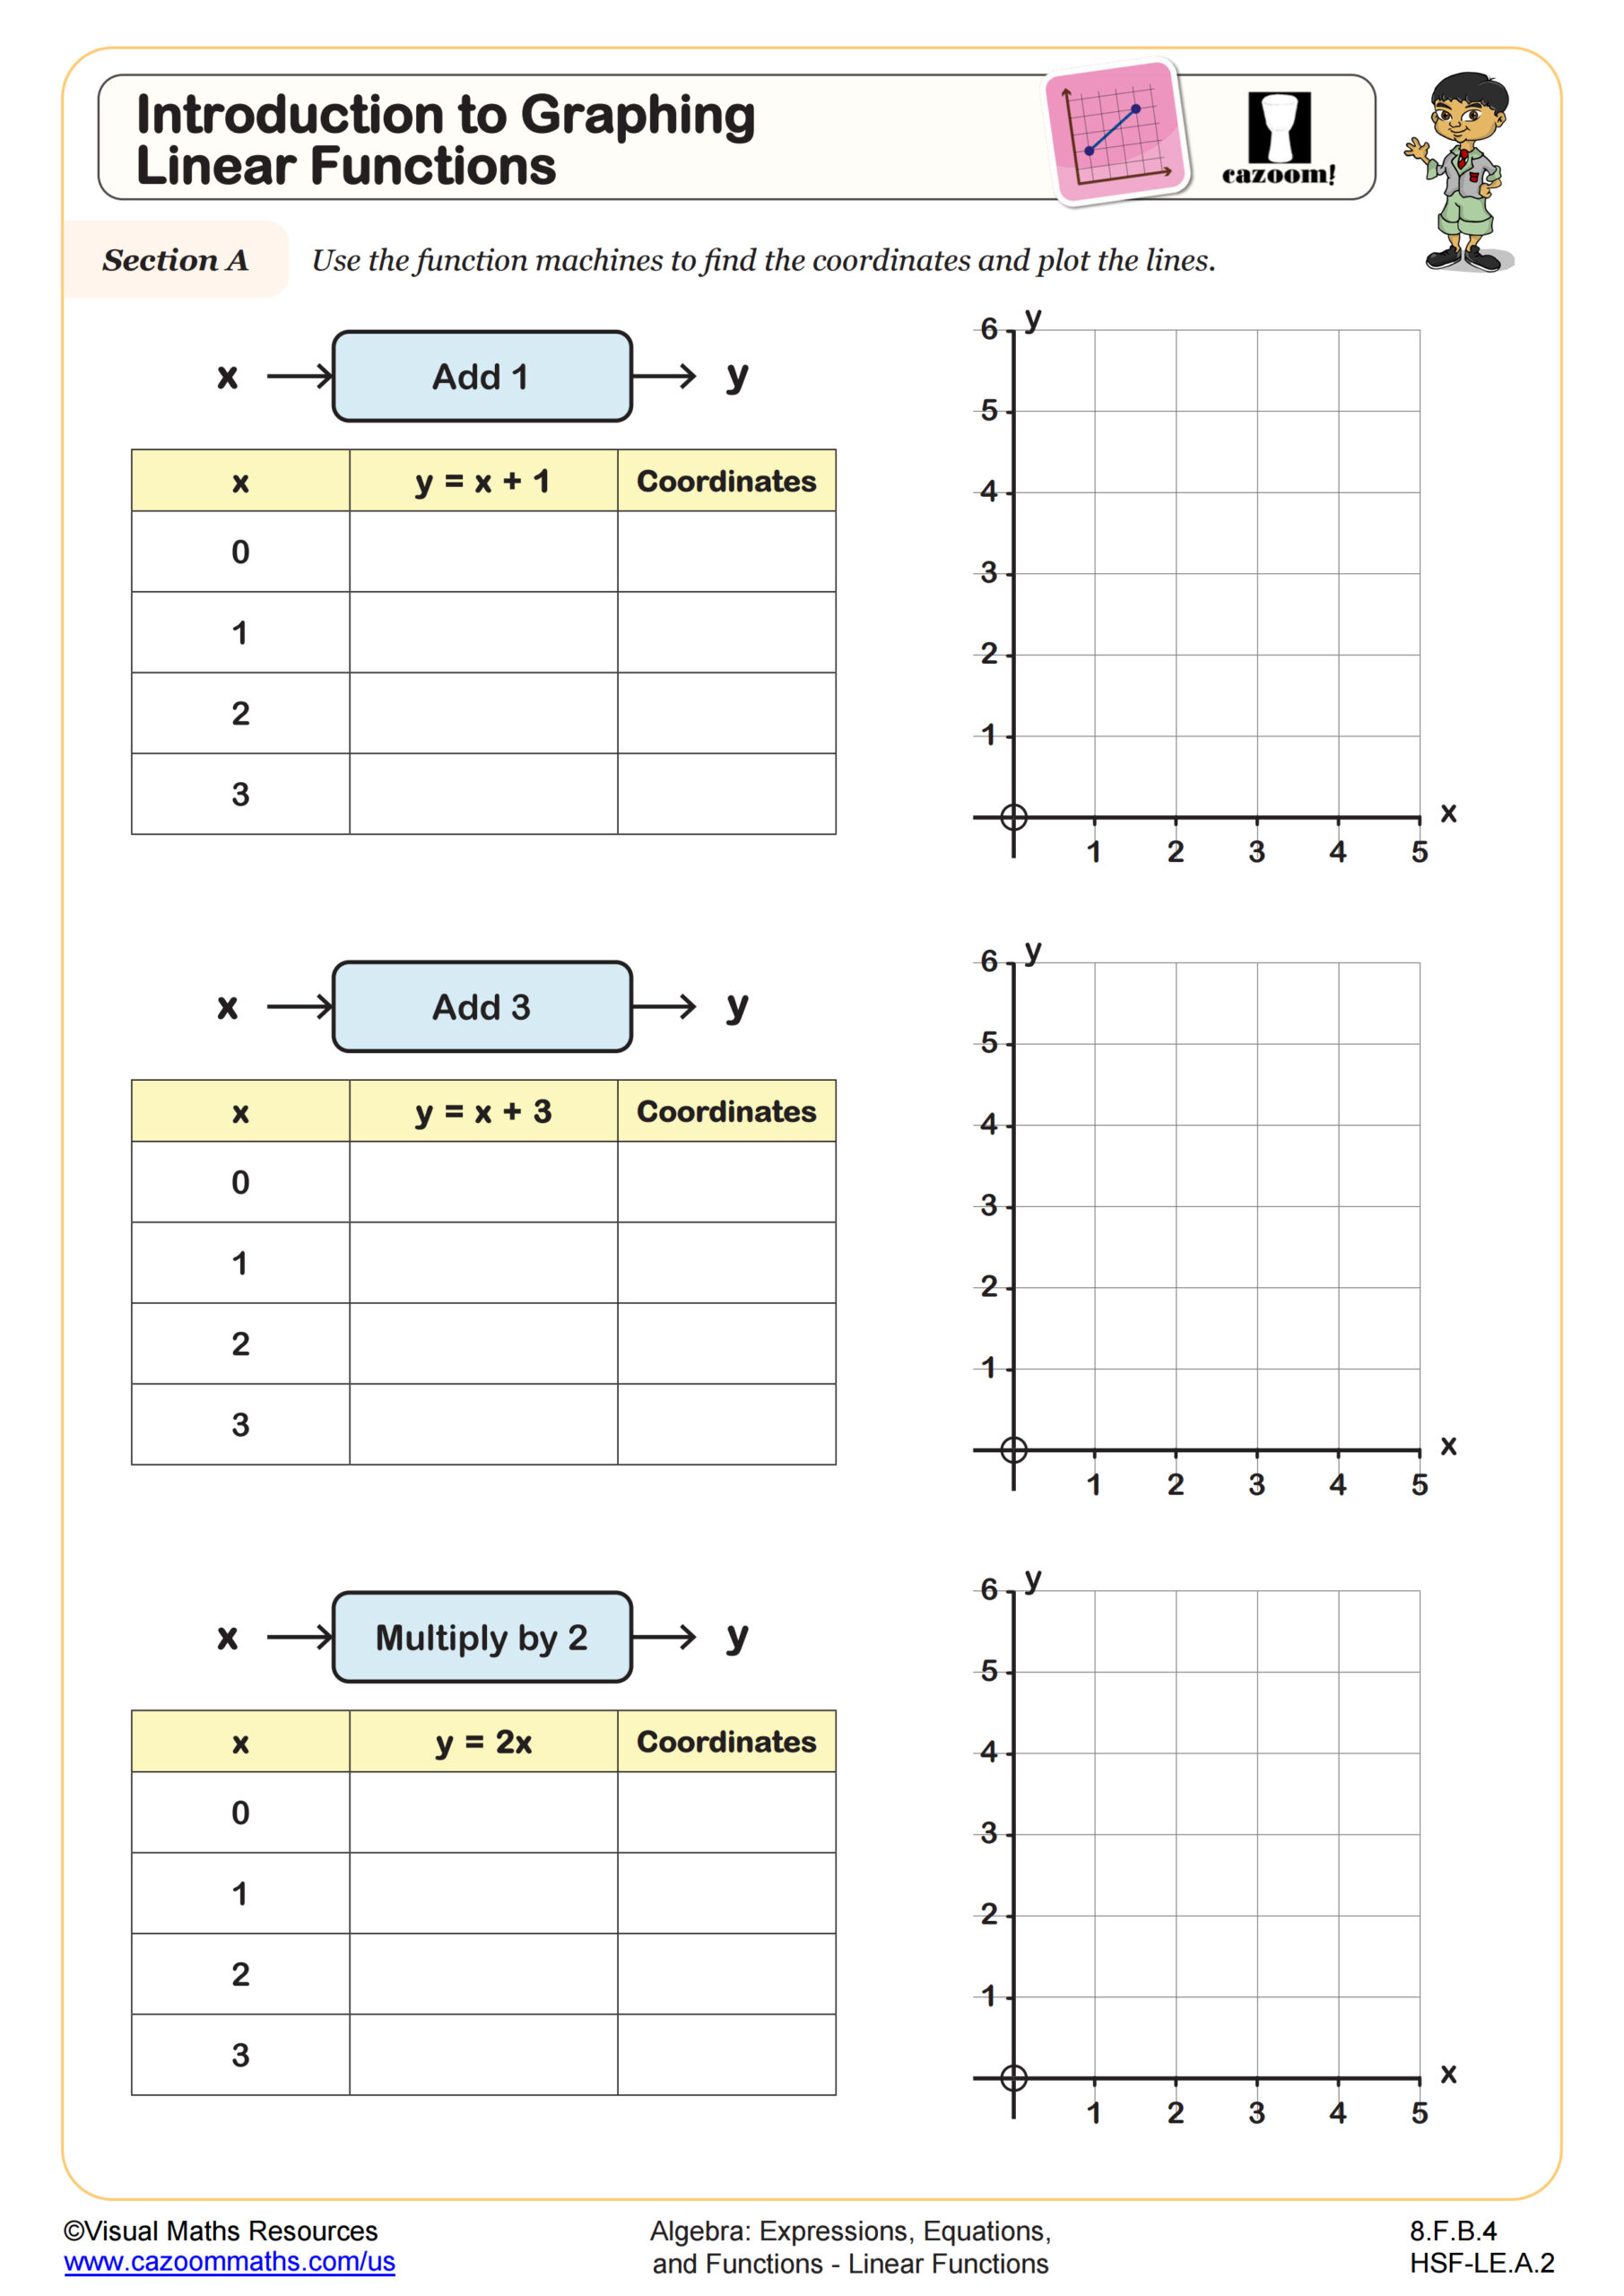
In section B, students will plot five functions on their own coordinate grids. The functions are y = x, y = 2x, y = x - 3, y = x + 4 and y = 2x + 1.
A table of values is included in each case and students will plot the lines for positive and negative values of x. We encourage students to write their values for x and y as coordinate pairs before plotting them.
Ensure students are equipped with a pencil and ruler before they start drawing their straight lines.
All worksheets are created by the team of experienced teachers at Cazoom Math.
 Worksheet")
RELATED TO Linear Functions (A) WORKSHEET
Frequently Asked Questions
This linear functions (a) worksheet is designed for students in 8th Grade and Algebra I and aligns with Common Core State Standards.