Linear Functions: y = x + c WORKSHEET
Construct a function to model a linear relationship between two quantities. Determine the rate of change and initial value of the function from a description of a relationship or from two (x, y) values, including reading these from a table or from a graph. Interpret the rate of change and initial value of a linear function in terms of the situation it models, and in terms of its graph or a table of values.
Linear Functions: y = x + c WORKSHEET DESCRIPTION
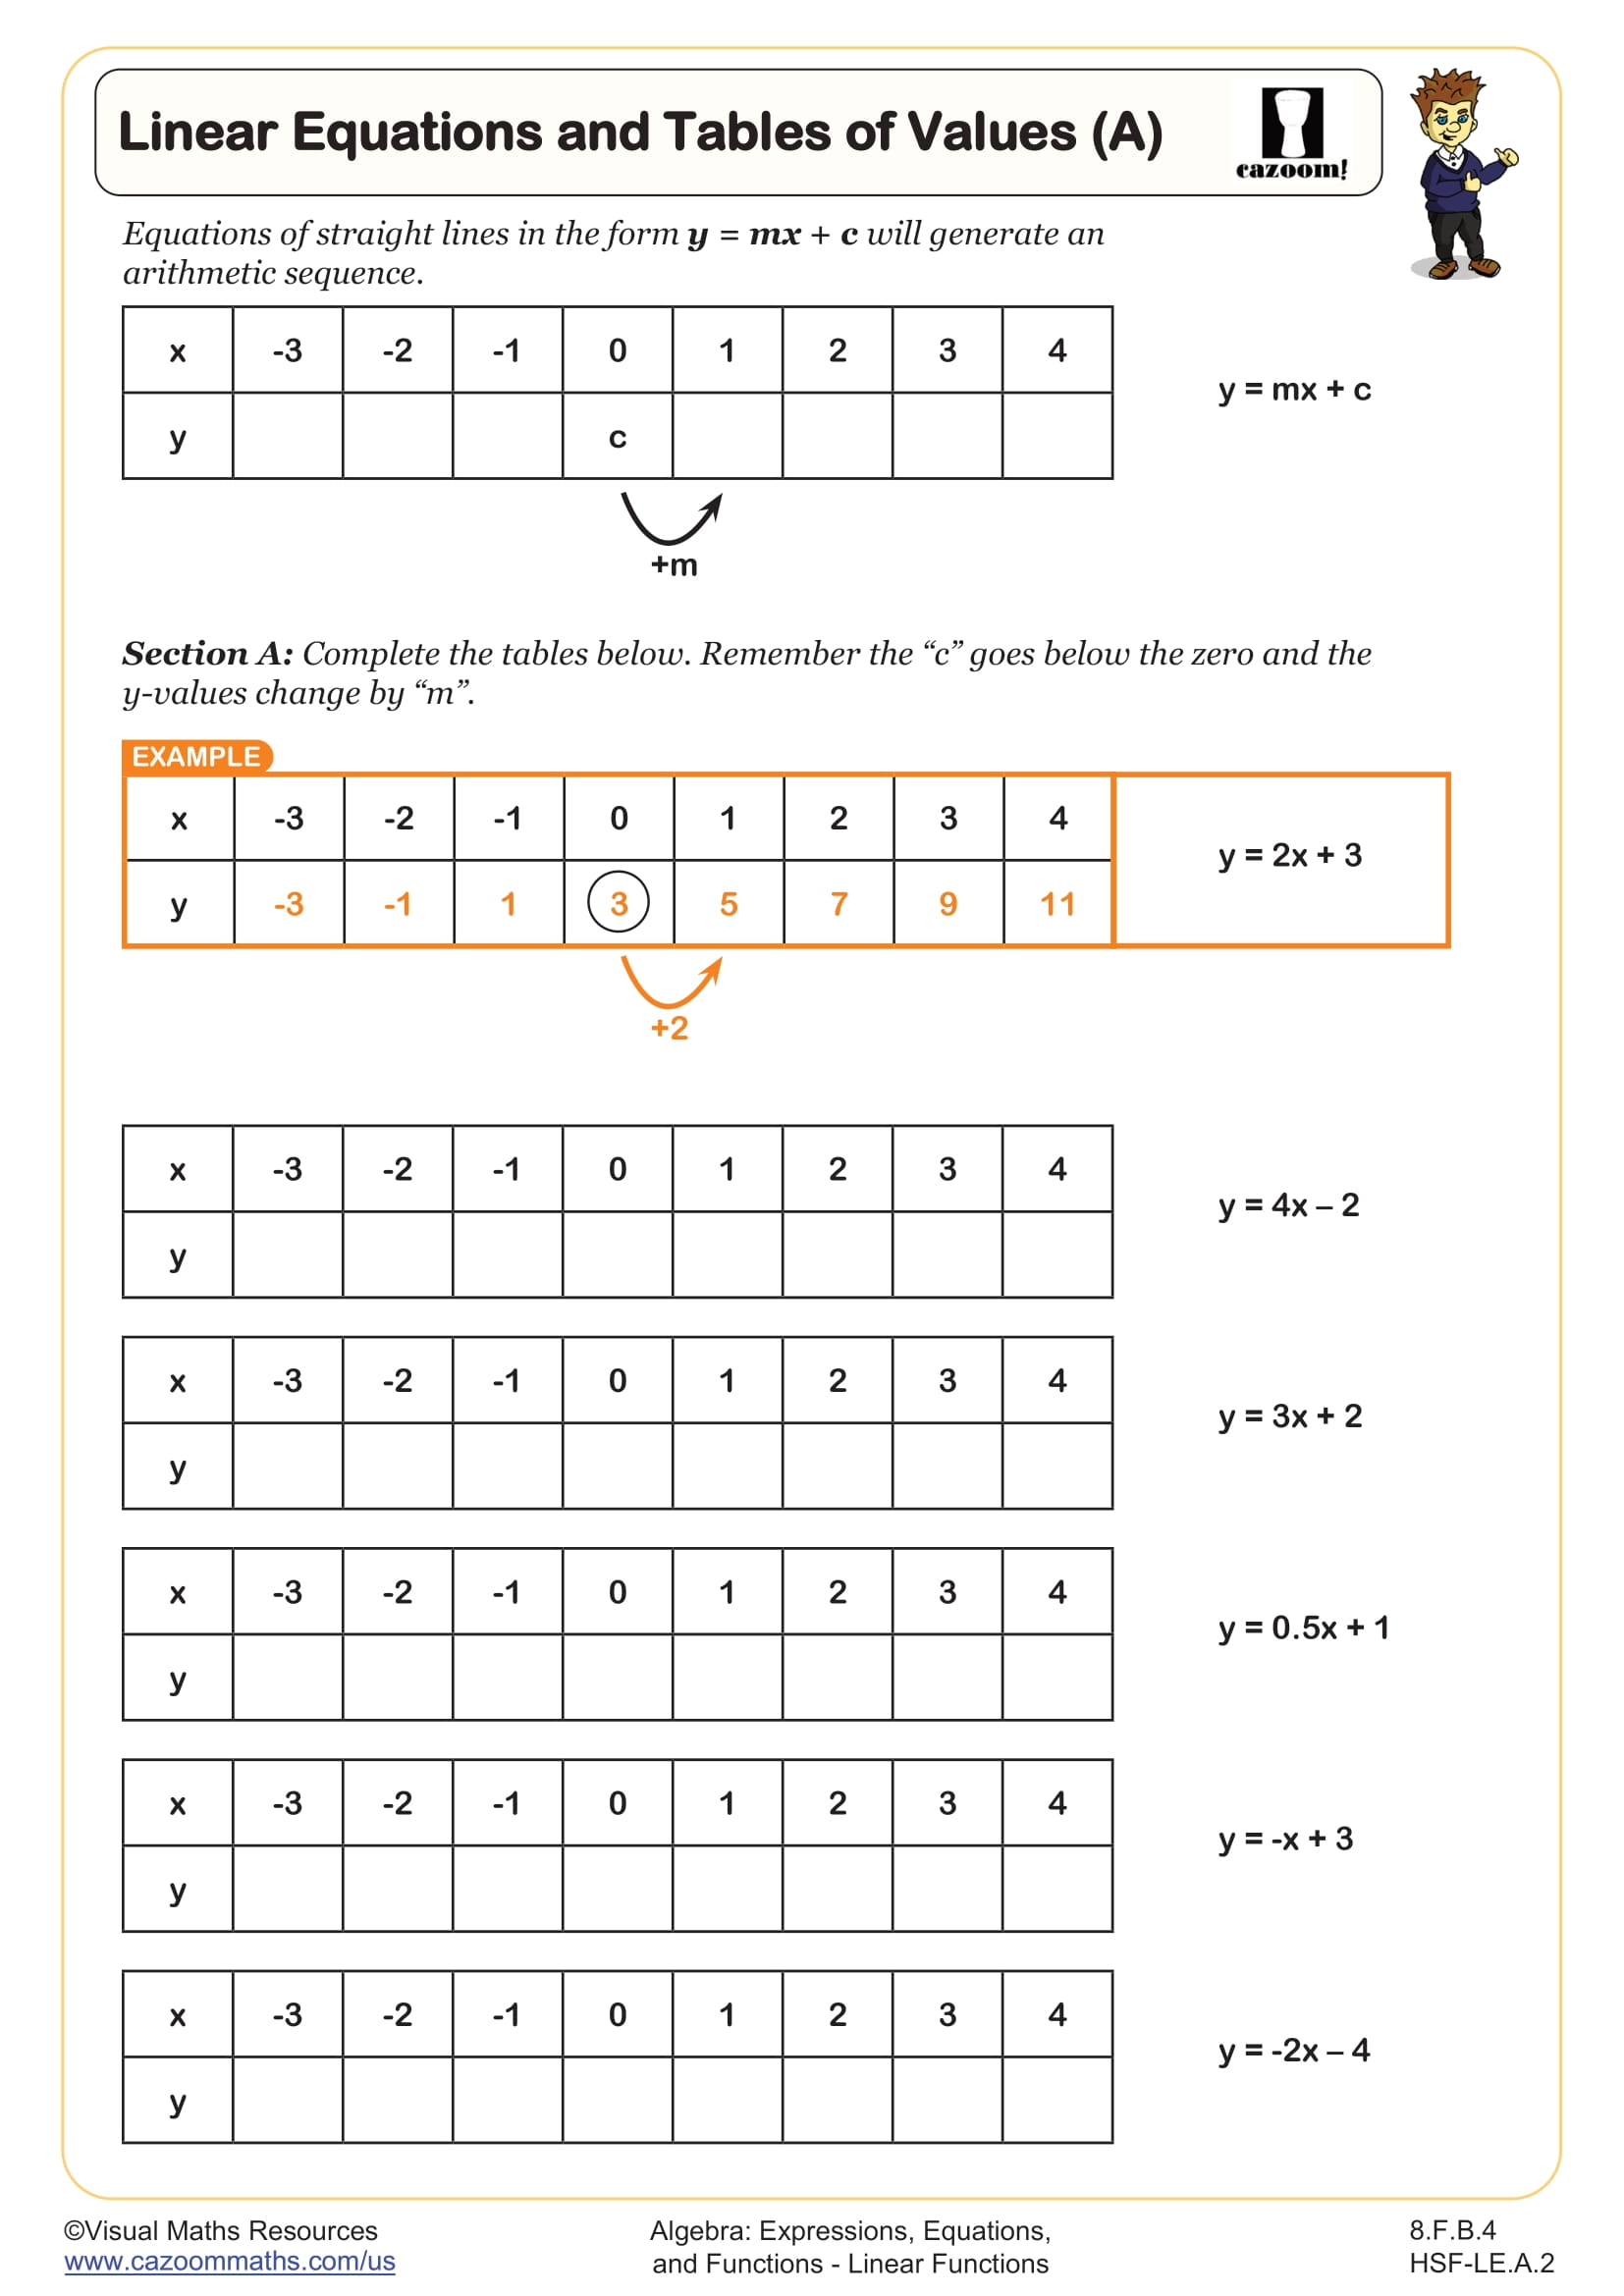
This worksheet on linear functions provides an exploration of graphing and interpreting straight lines in the form y = x + c.
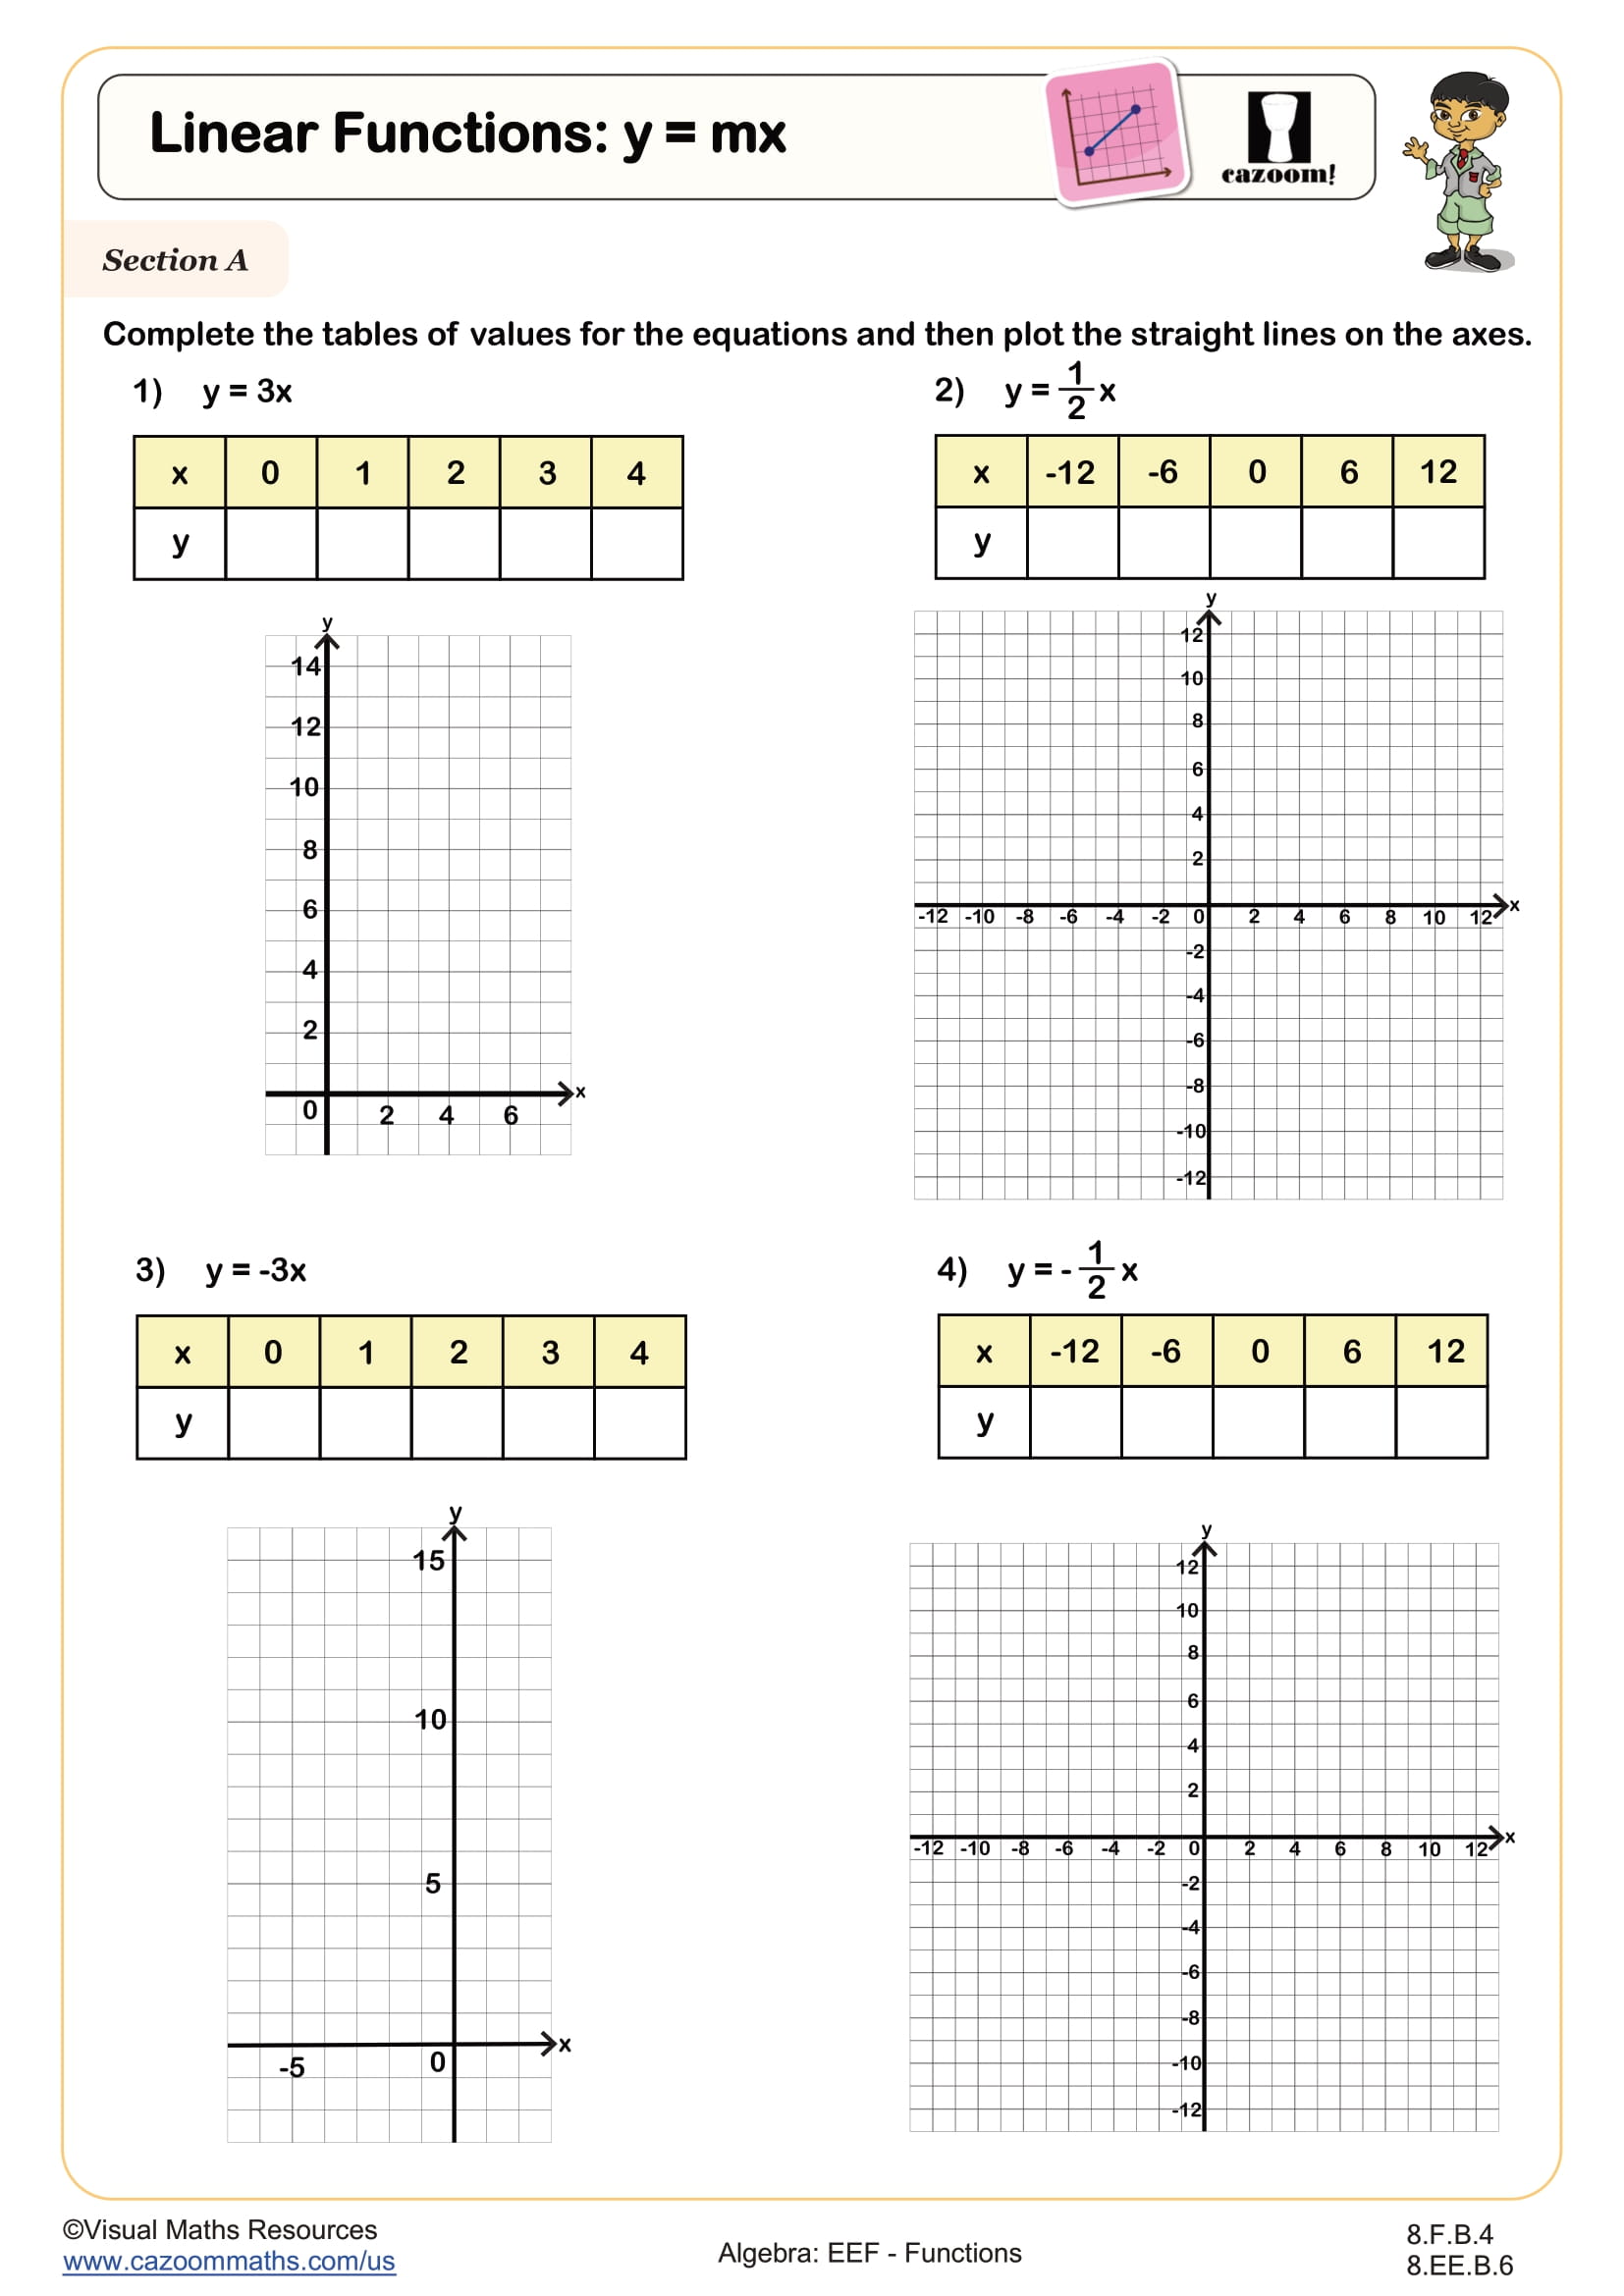
In Section A, learners will complete tables of values for linear equations and plot them on graphs.
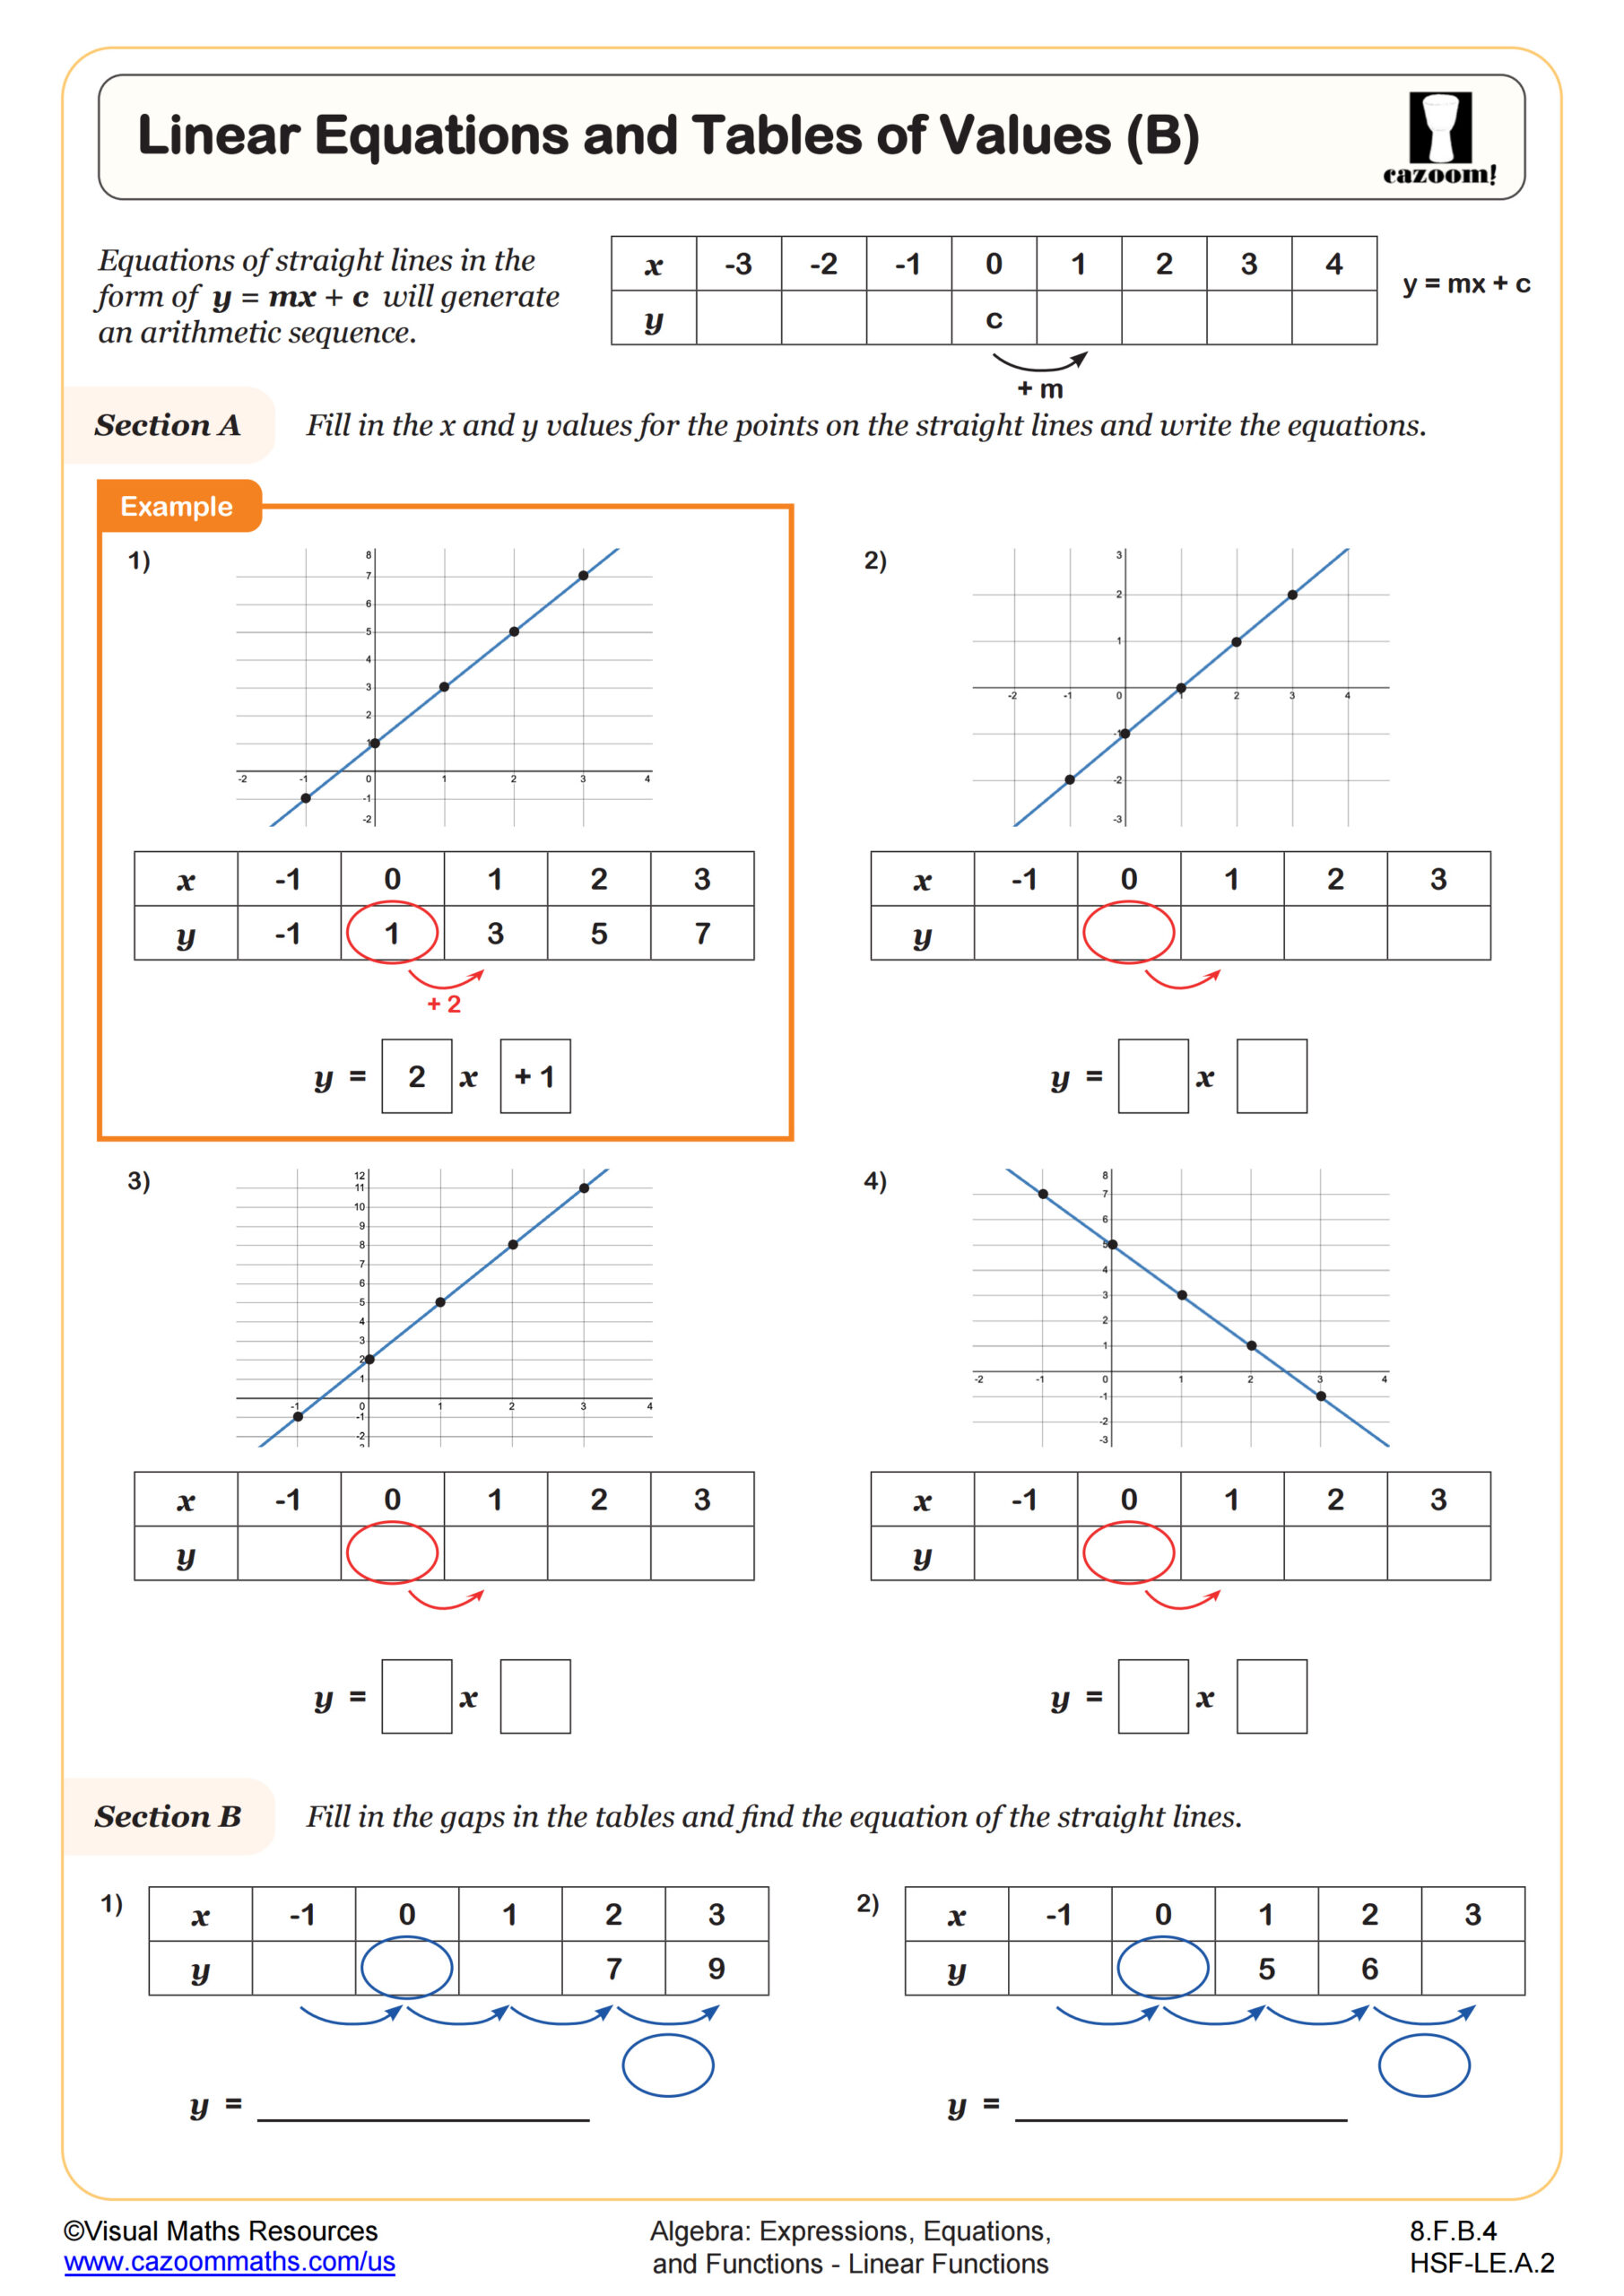
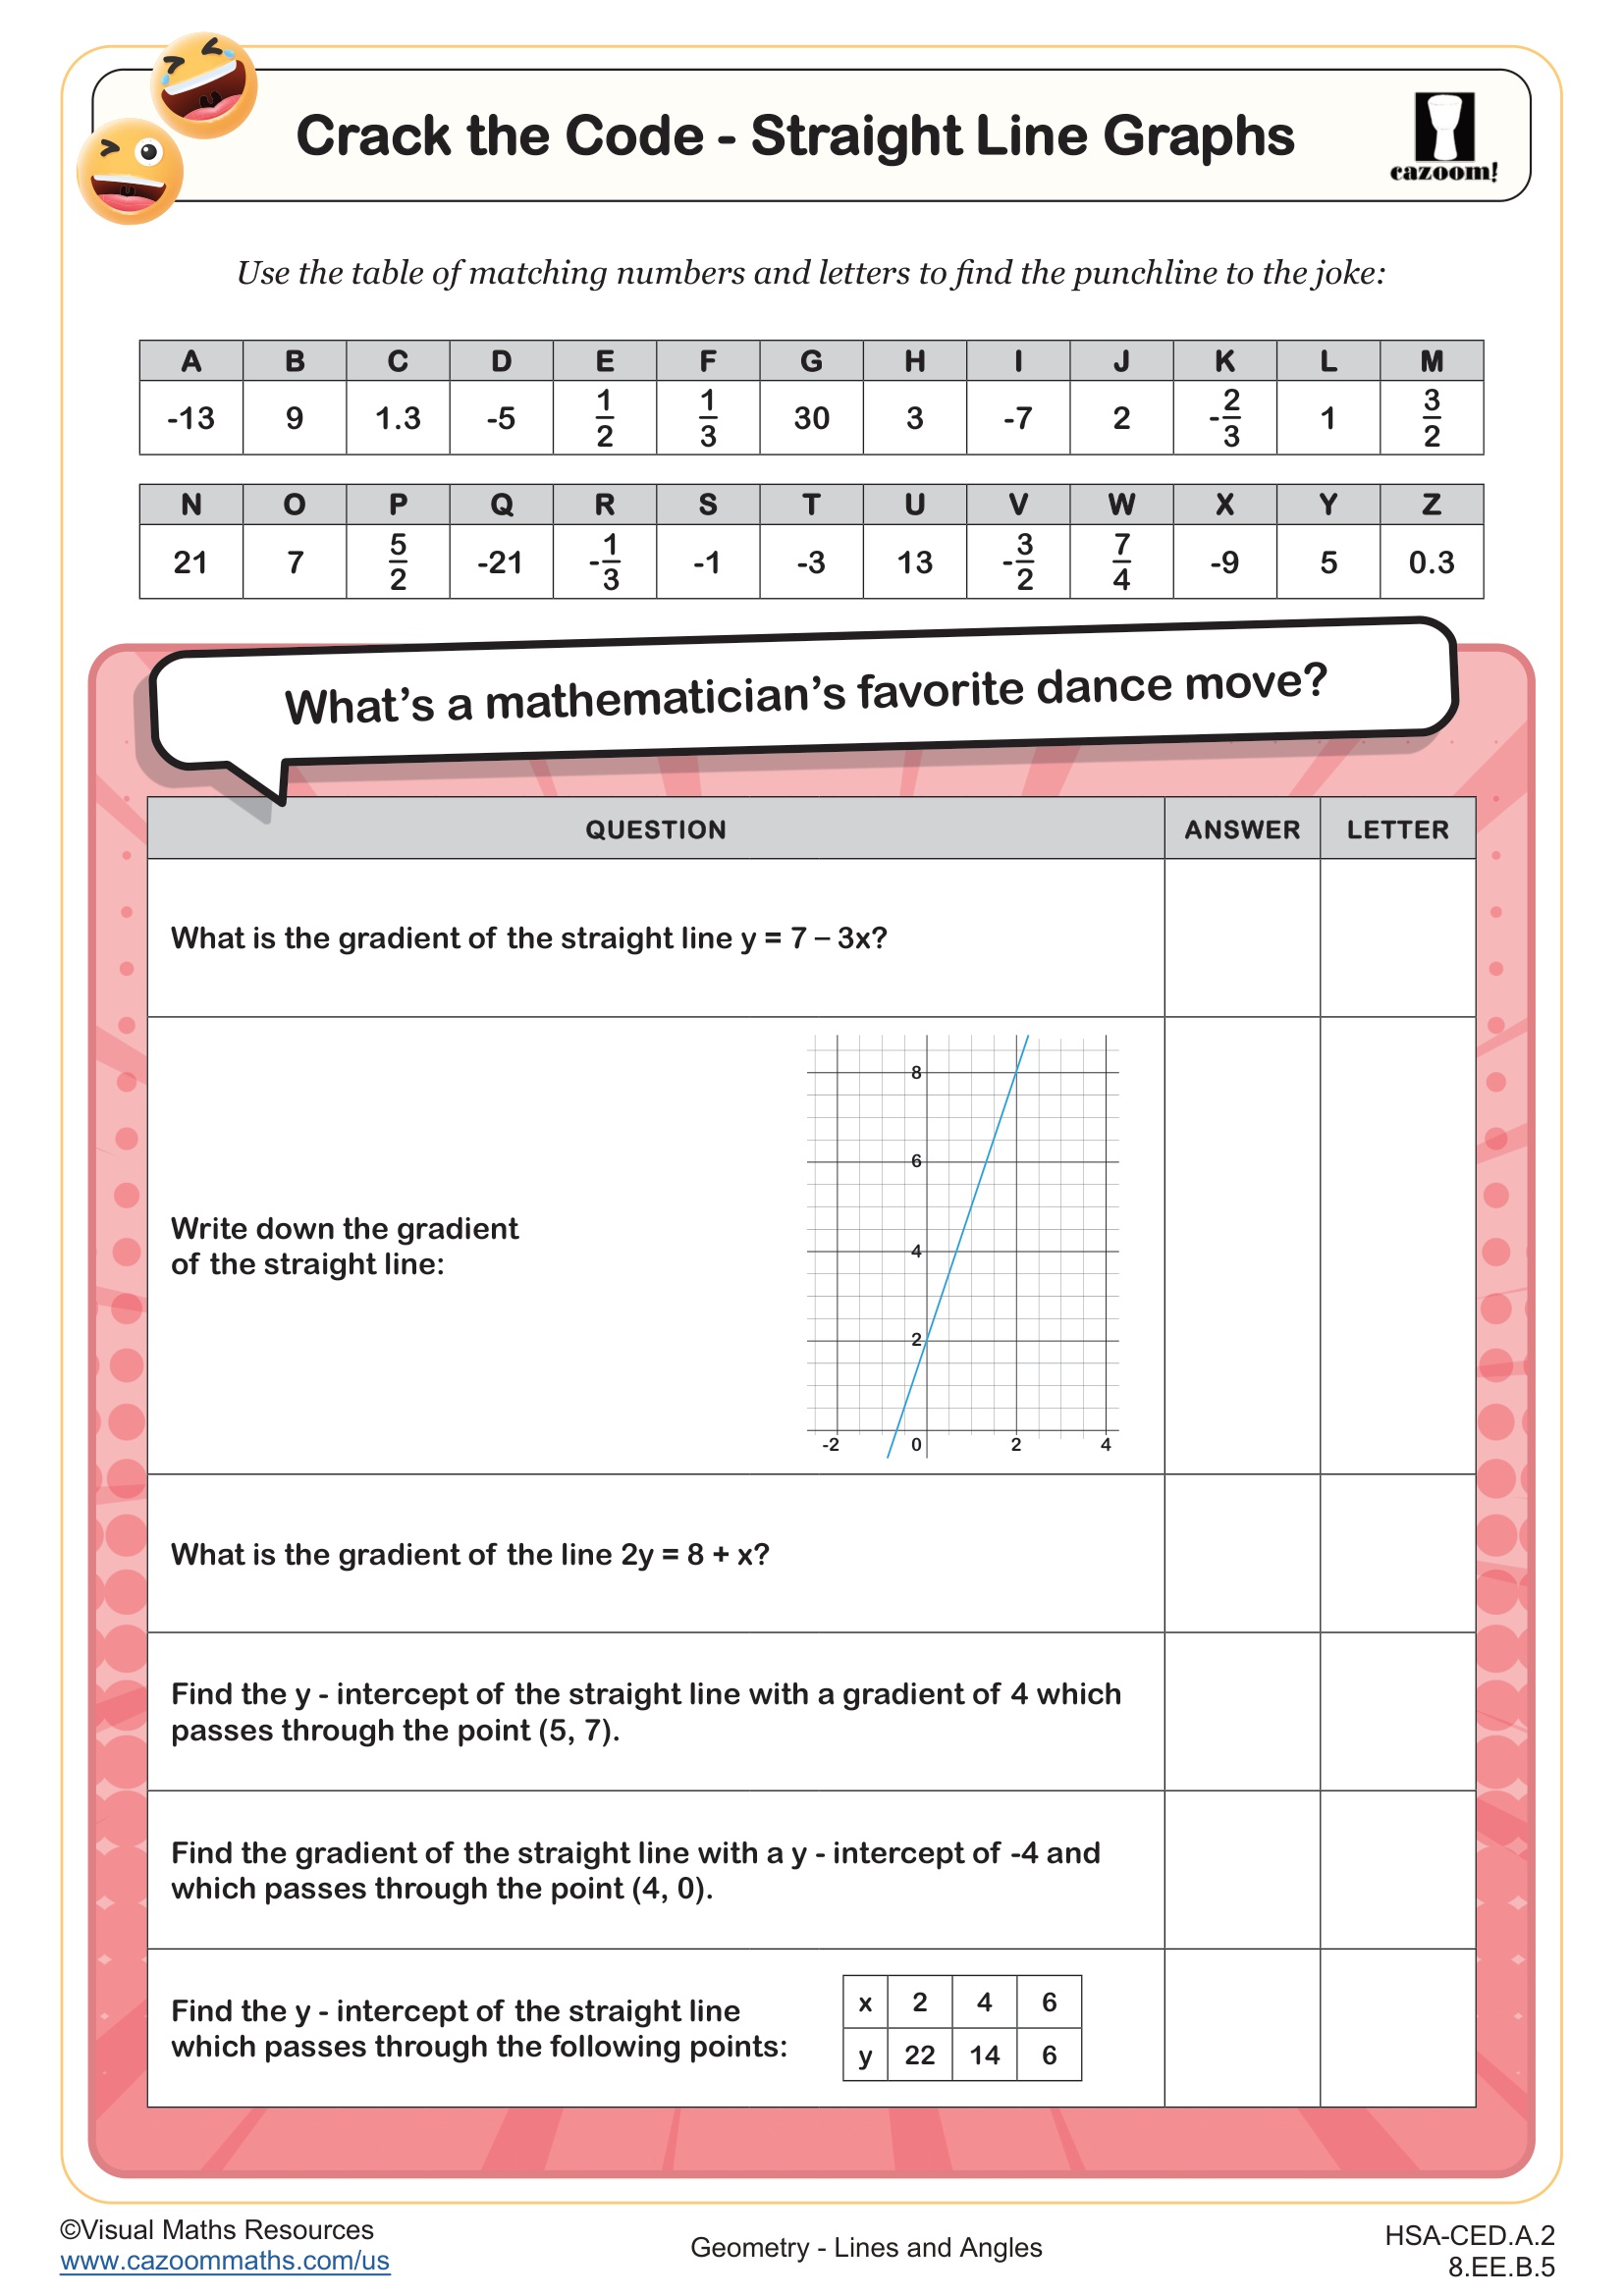
Section B challenges students to identify y-intercepts and write the corresponding linear equations, reinforcing their understanding of how changes in equations affect graphs. Section C builds on this by having students use tables of values to derive equations.
Finally, Section D pushes students further, asking them to find the equations of lines passing through three pairs of points, encouraging problem-solving and application of key concepts.
All worksheets are created by the team of experienced teachers at Cazoom Math.

RELATED TO Linear Functions: y = x + c WORKSHEET
Frequently Asked Questions
This linear functions: y = x + c worksheet is designed for students in 8th Grade and aligns with Common Core State Standards.