Percentages of Amounts - Using a Tape Diagram (B) WORKSHEET
Percentages of Amounts - Using a Tape Diagram (B) WORKSHEET DESCRIPTION
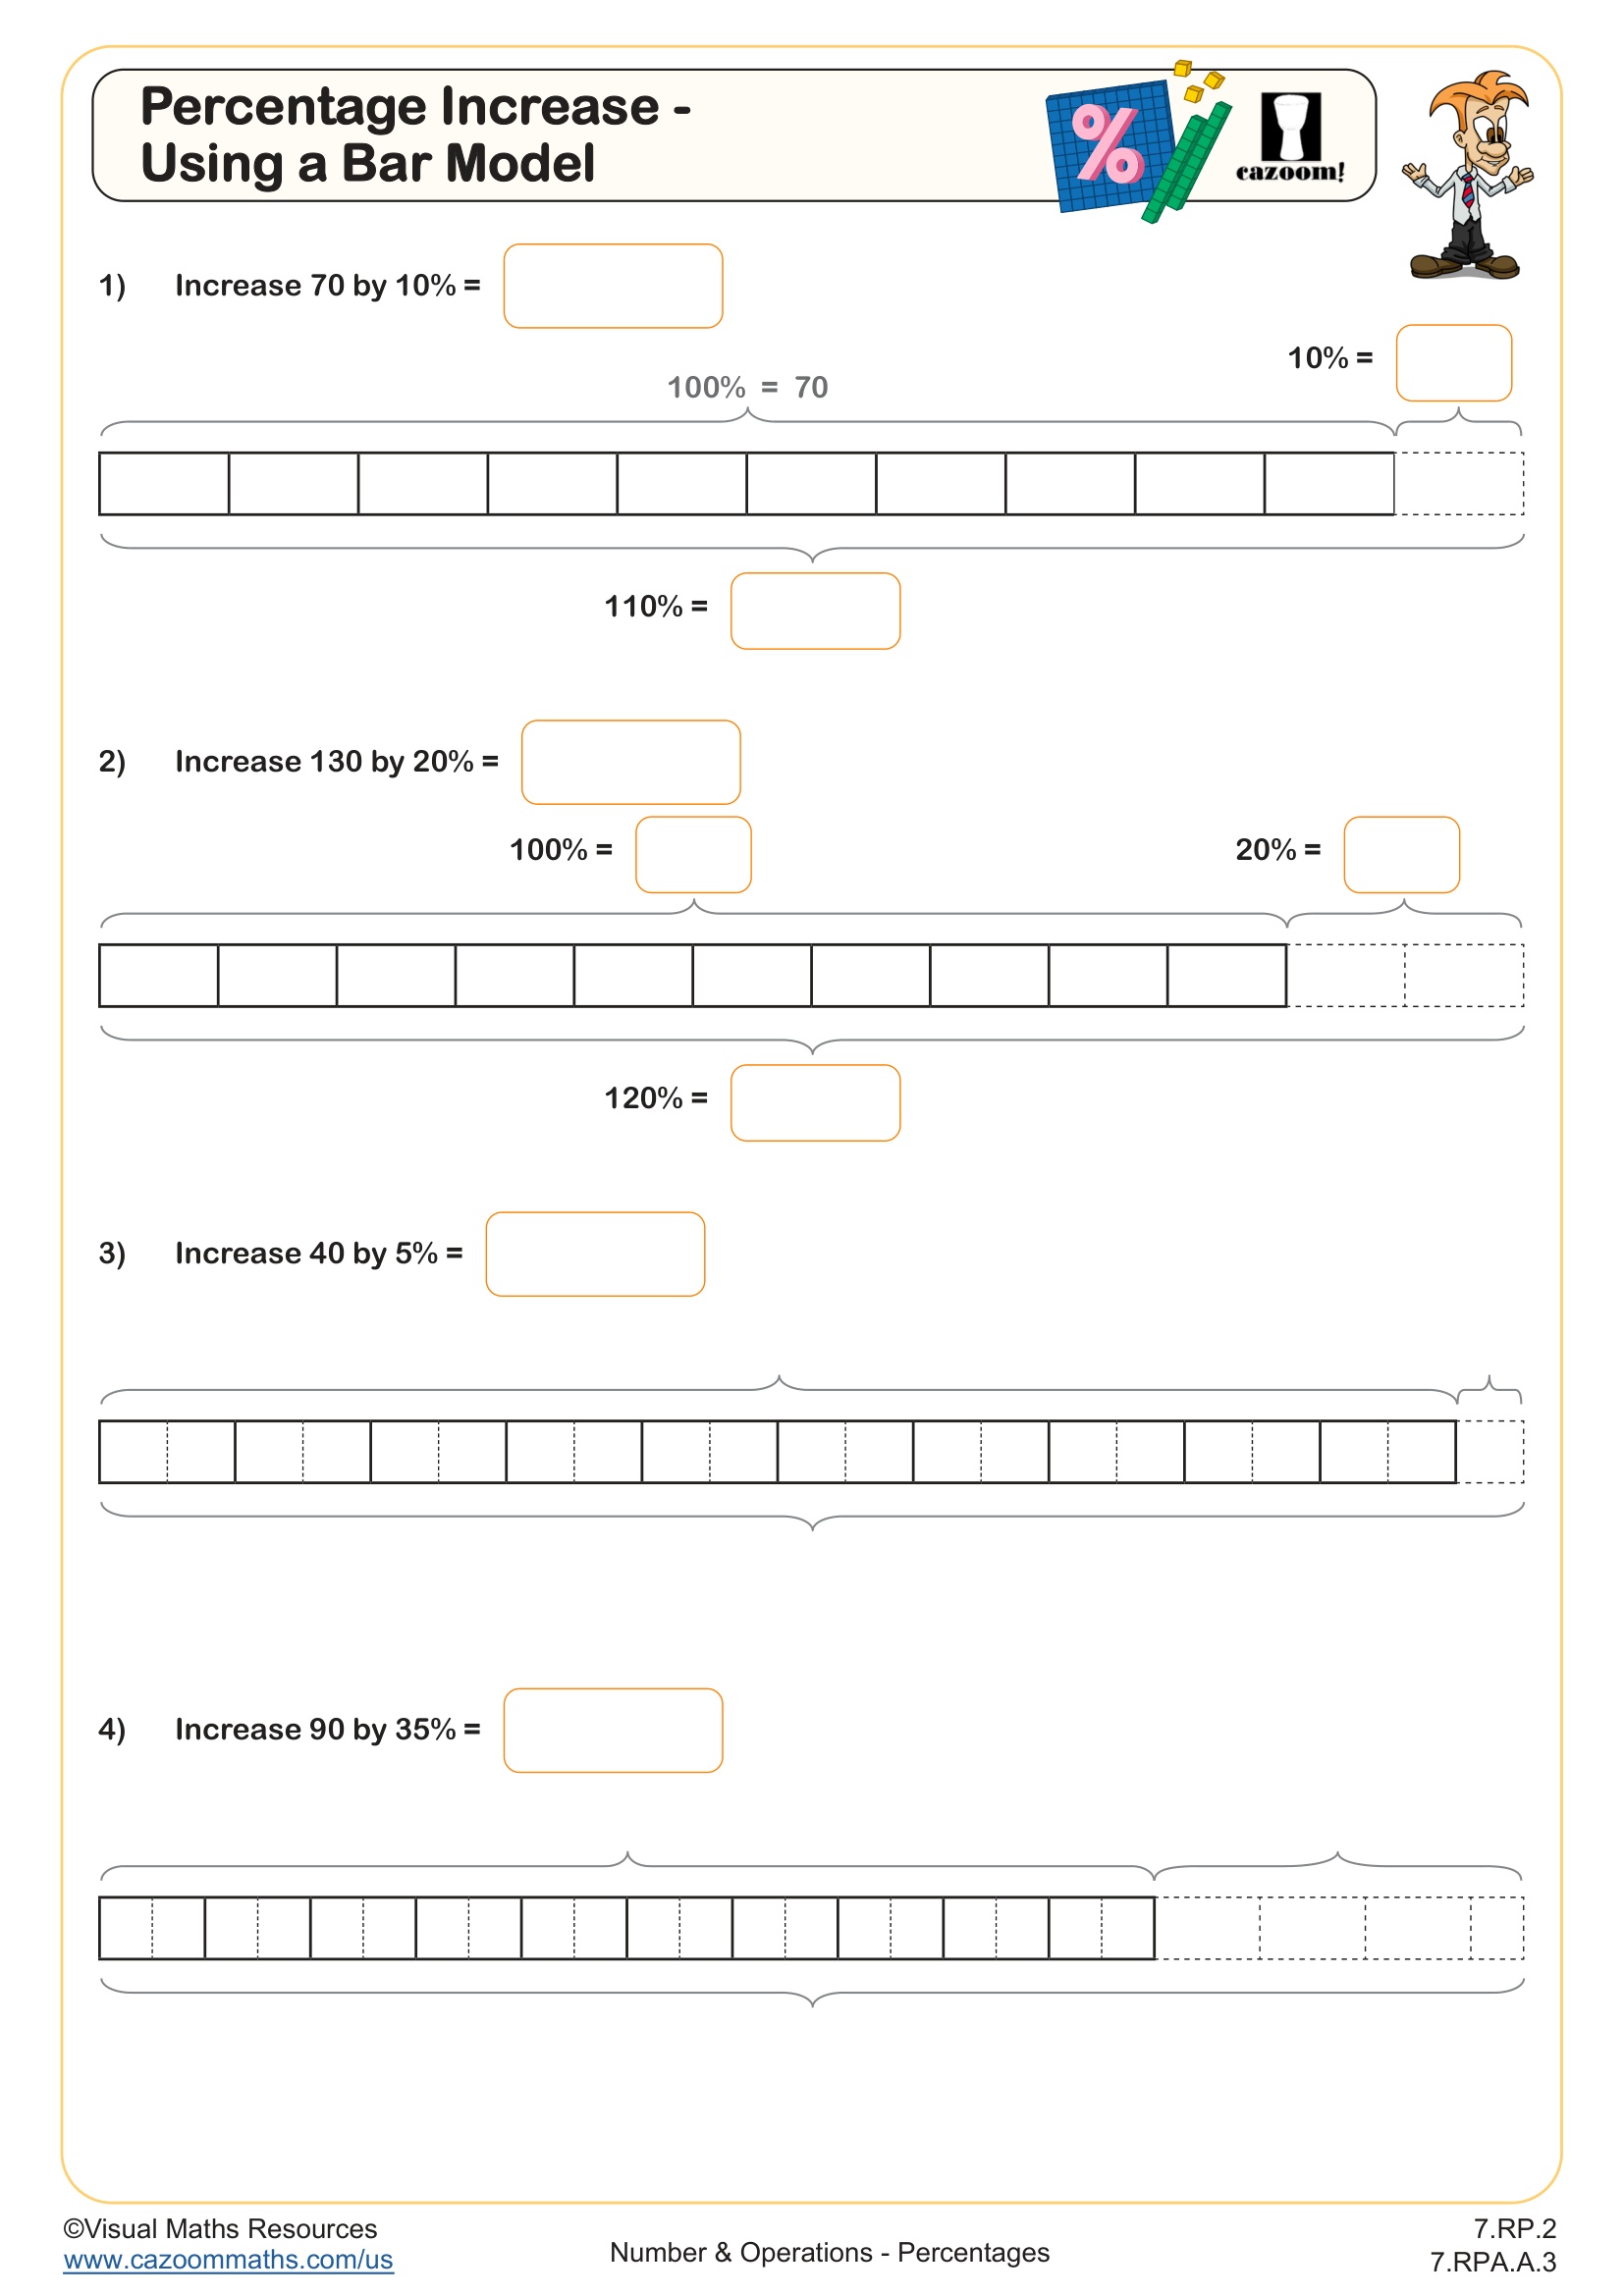
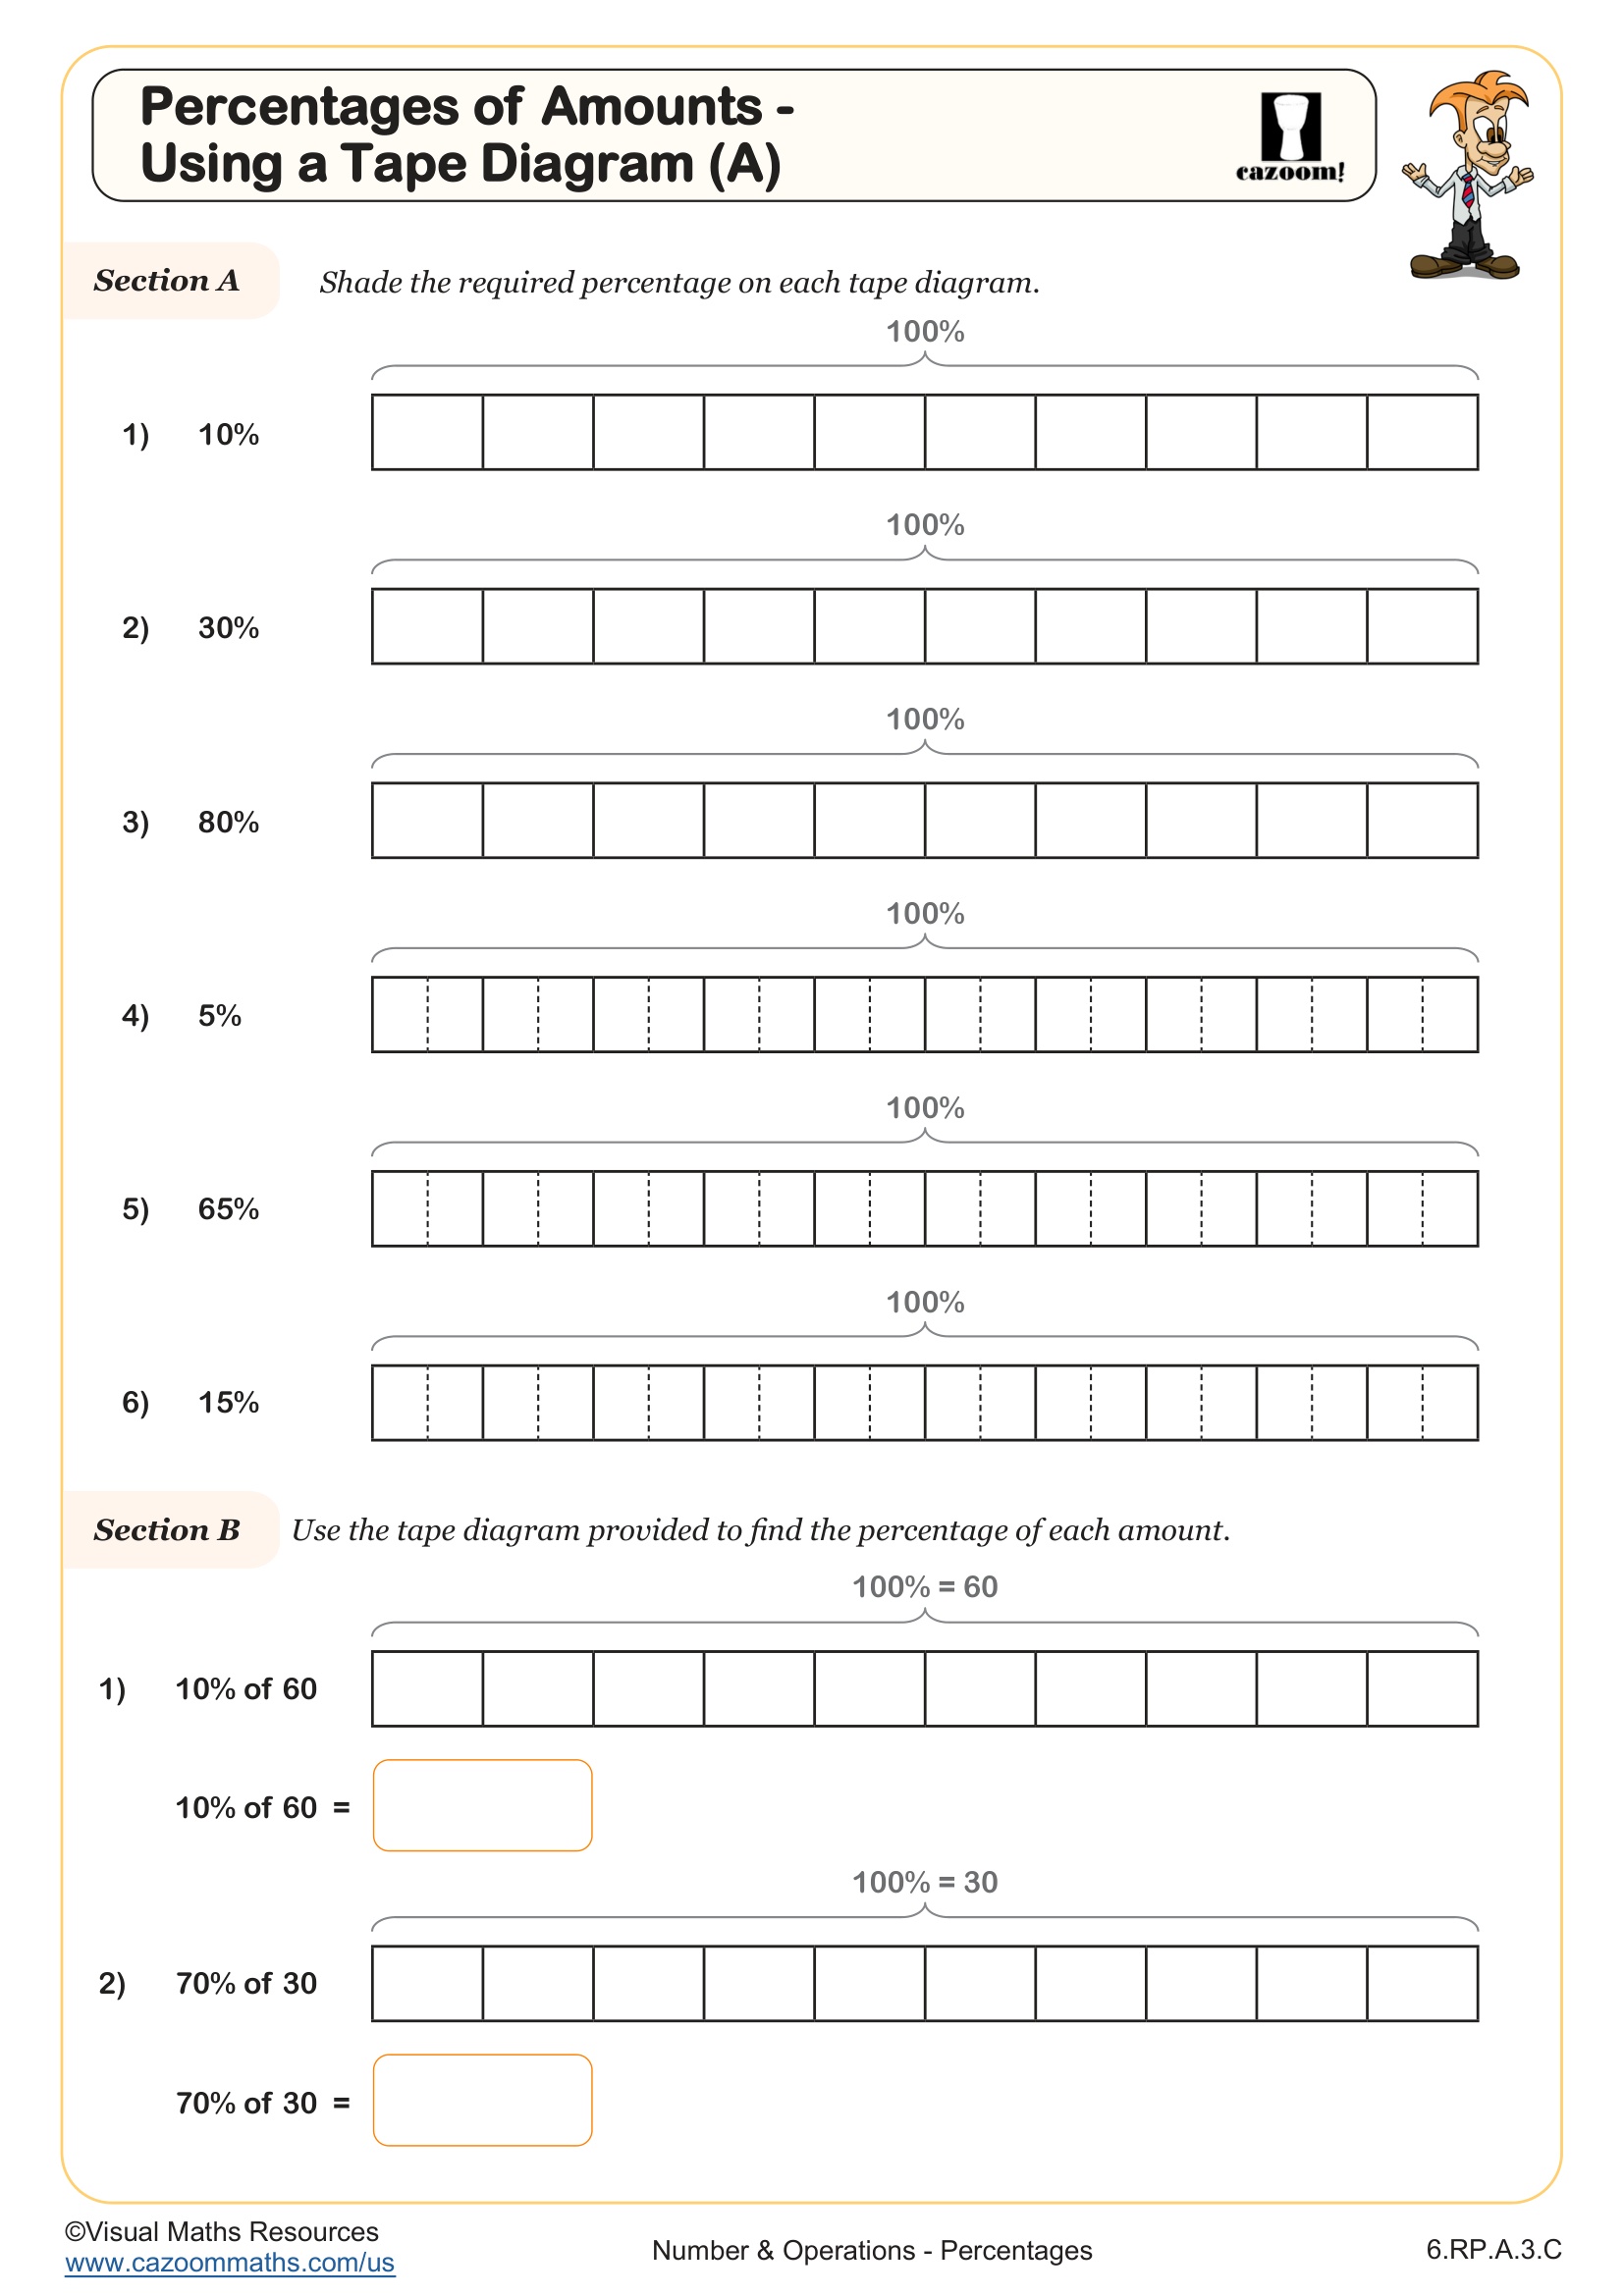
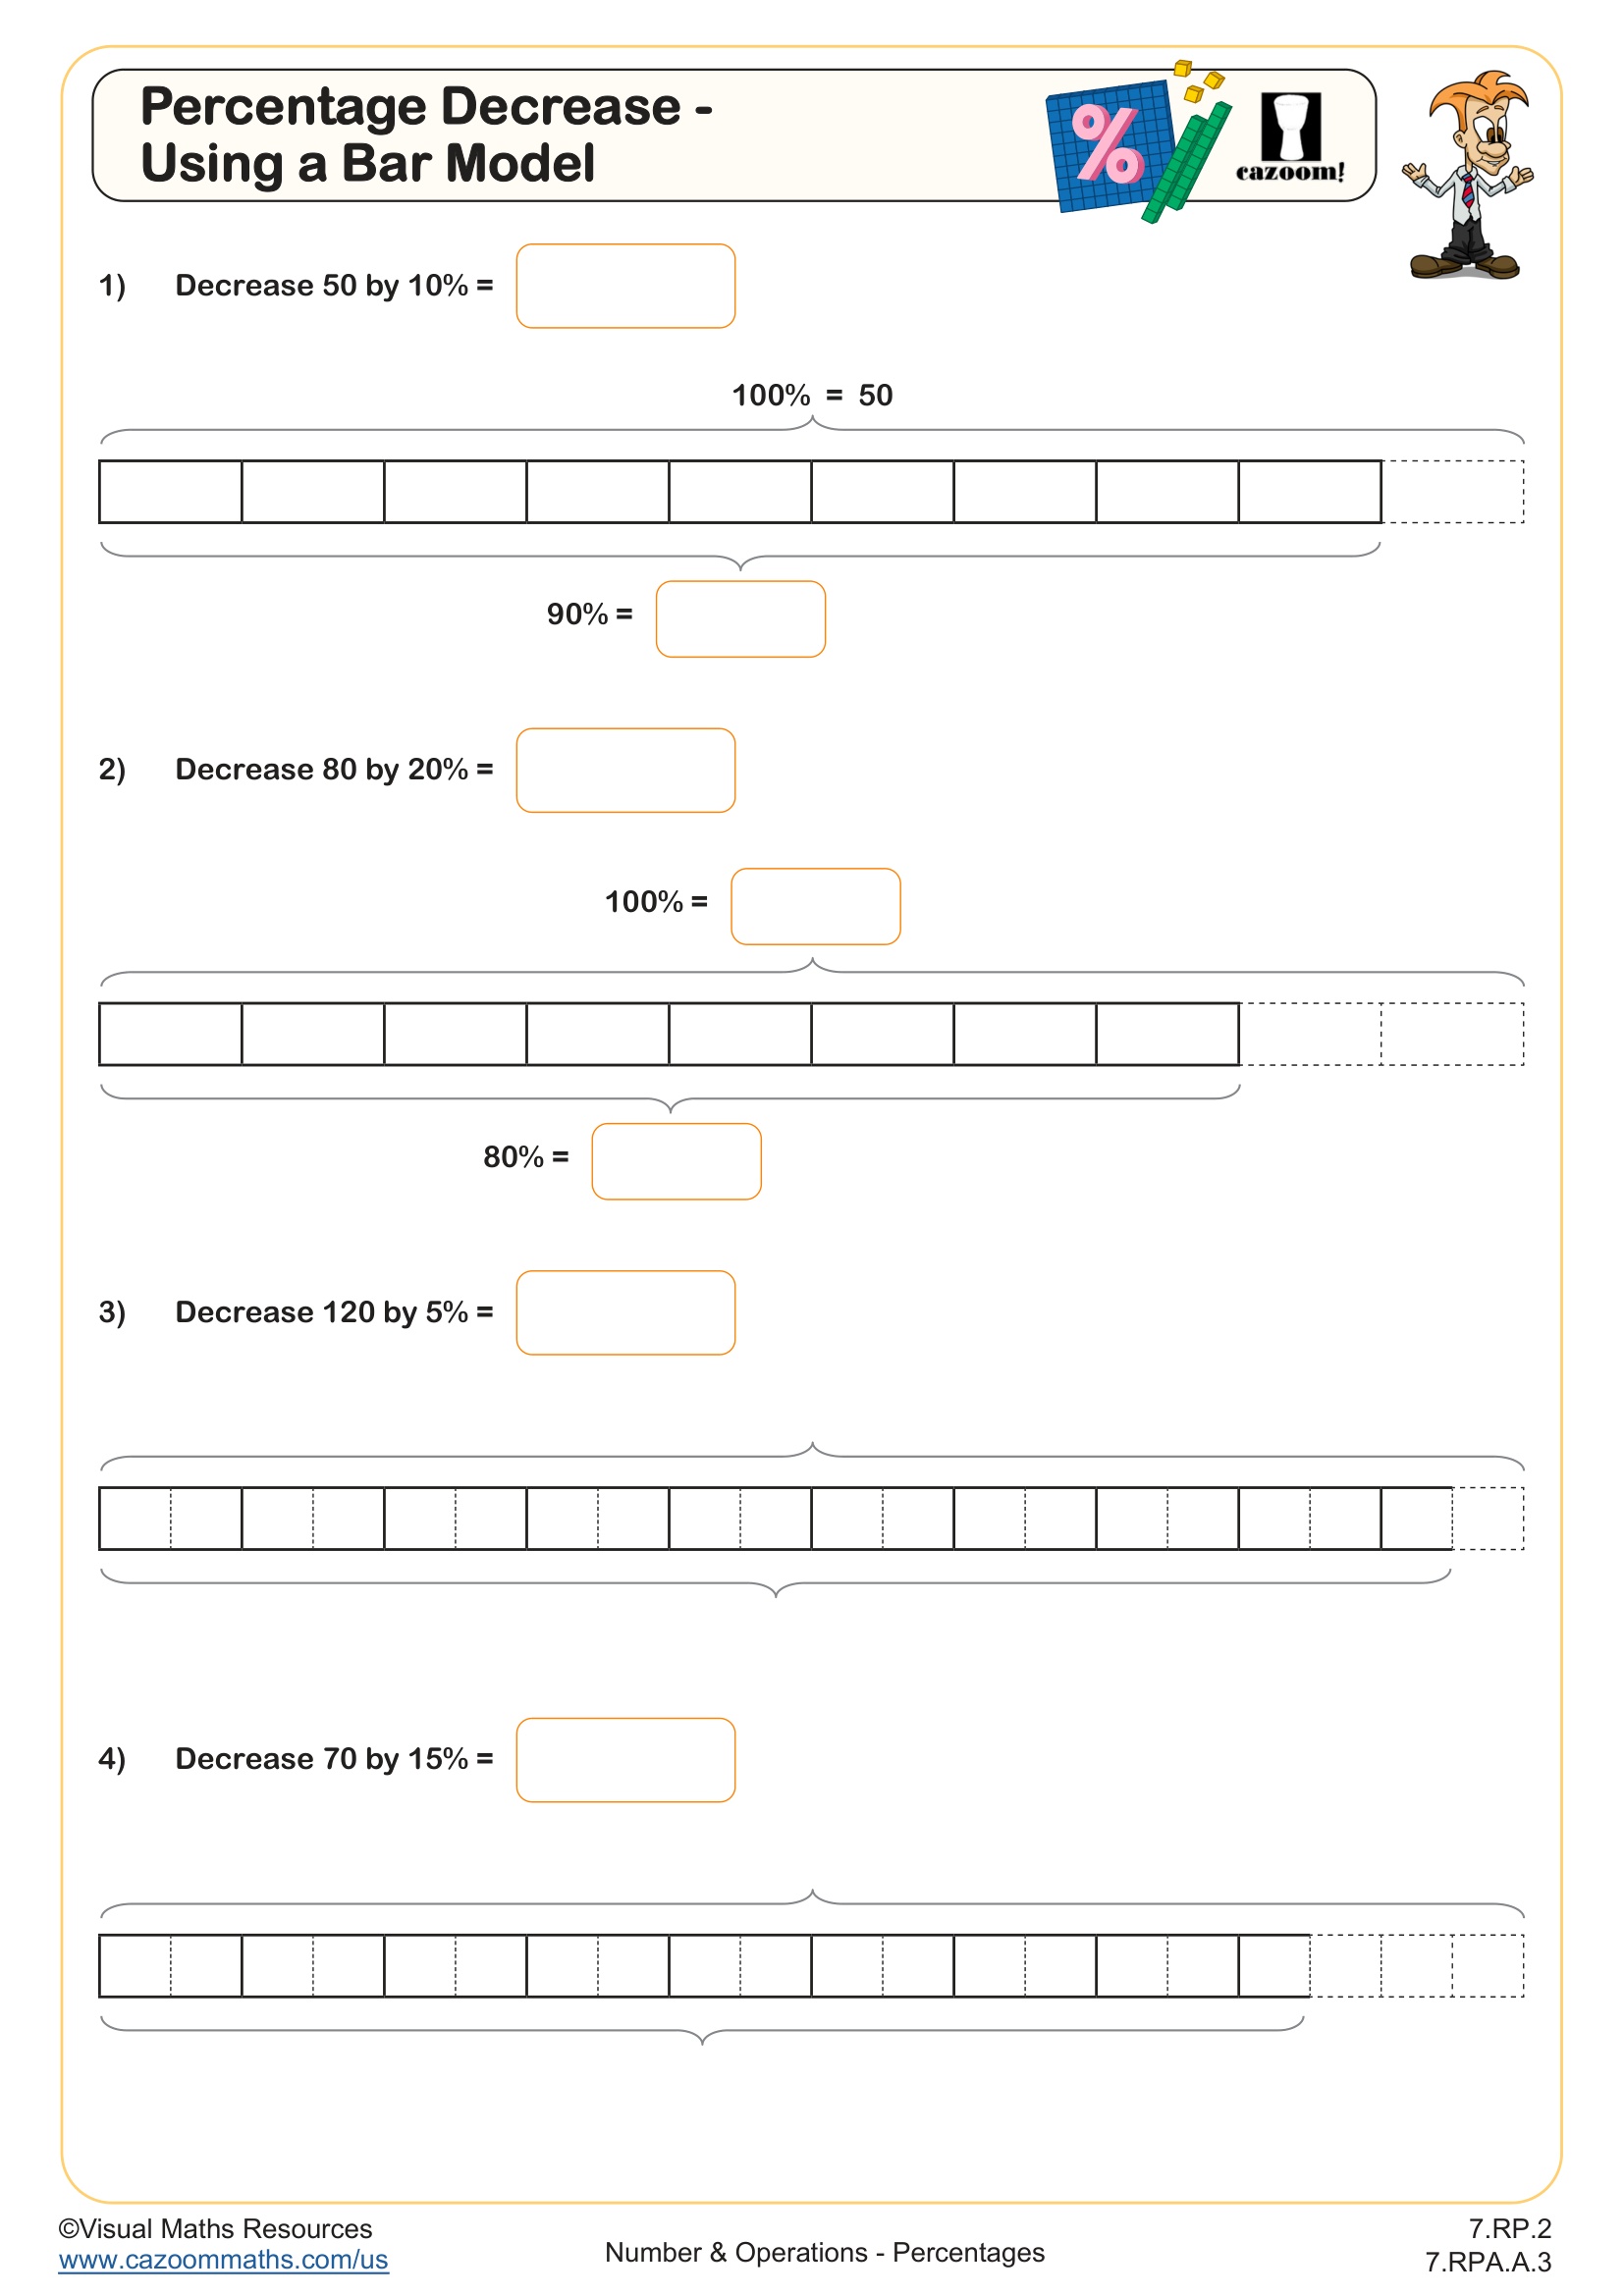
Bar models provide an excellent visual tool for understanding percentages and help bridge the gap between concrete, pictorial, and abstract concepts. This worksheet will see your learners calculating any integer percentage of an amount.
In Section A, students are asked to explain how a bar model can be used to show and calculate 1% before shading given percentages on three different bar models. This is an important step as it leads to learners understanding where different percentages of amounts come from in bar models. Then in Section B, learners will find 13%, 36%, 47% and 88% using pre drawn bar models.
All worksheets are created by the team of experienced teachers at Cazoom Math.

RELATED TO Percentages of Amounts - Using a Tape Diagram (B) WORKSHEET
Frequently Asked Questions
This percentages of amounts - using a tape diagram (b) worksheet is designed for students in 6th Grade and aligns with Common Core State Standards.