Back to:
Probability Tree Diagrams (B) WORKSHEET
Suitable for Grades: 7th Grade, Geometry
CCSS: 7.SP.C.8, HSS.CP.B.6
CCSS Description: Find probabilities of compound events using organized lists, tables, tree diagrams, and simulation. a. Understand that, just as with simple events, the probability of a compound event is the fraction of outcomes in the sample space for which the compound event occurs. b. Represent sample spaces for compound events using methods such as organized lists, tables and tree diagrams. For an event described in everyday language (e.g., “rolling double sixes”), identify the outcomes in the sample space which compose the event. c. Design and use a simulation to generate frequencies for compound events. For example, use random digits as a simulation tool to approximate the answer to the question: If 40% of donors have type A blood, what is the probability that it will take at least 4 donors to find one with type A blood?
Find the conditional probability of A given B as the fraction of B’s outcomes that also belong to A, and interpret the answer in terms of the model.
Find the conditional probability of A given B as the fraction of B’s outcomes that also belong to A, and interpret the answer in terms of the model.
Probability Tree Diagrams (B) WORKSHEET DESCRIPTION
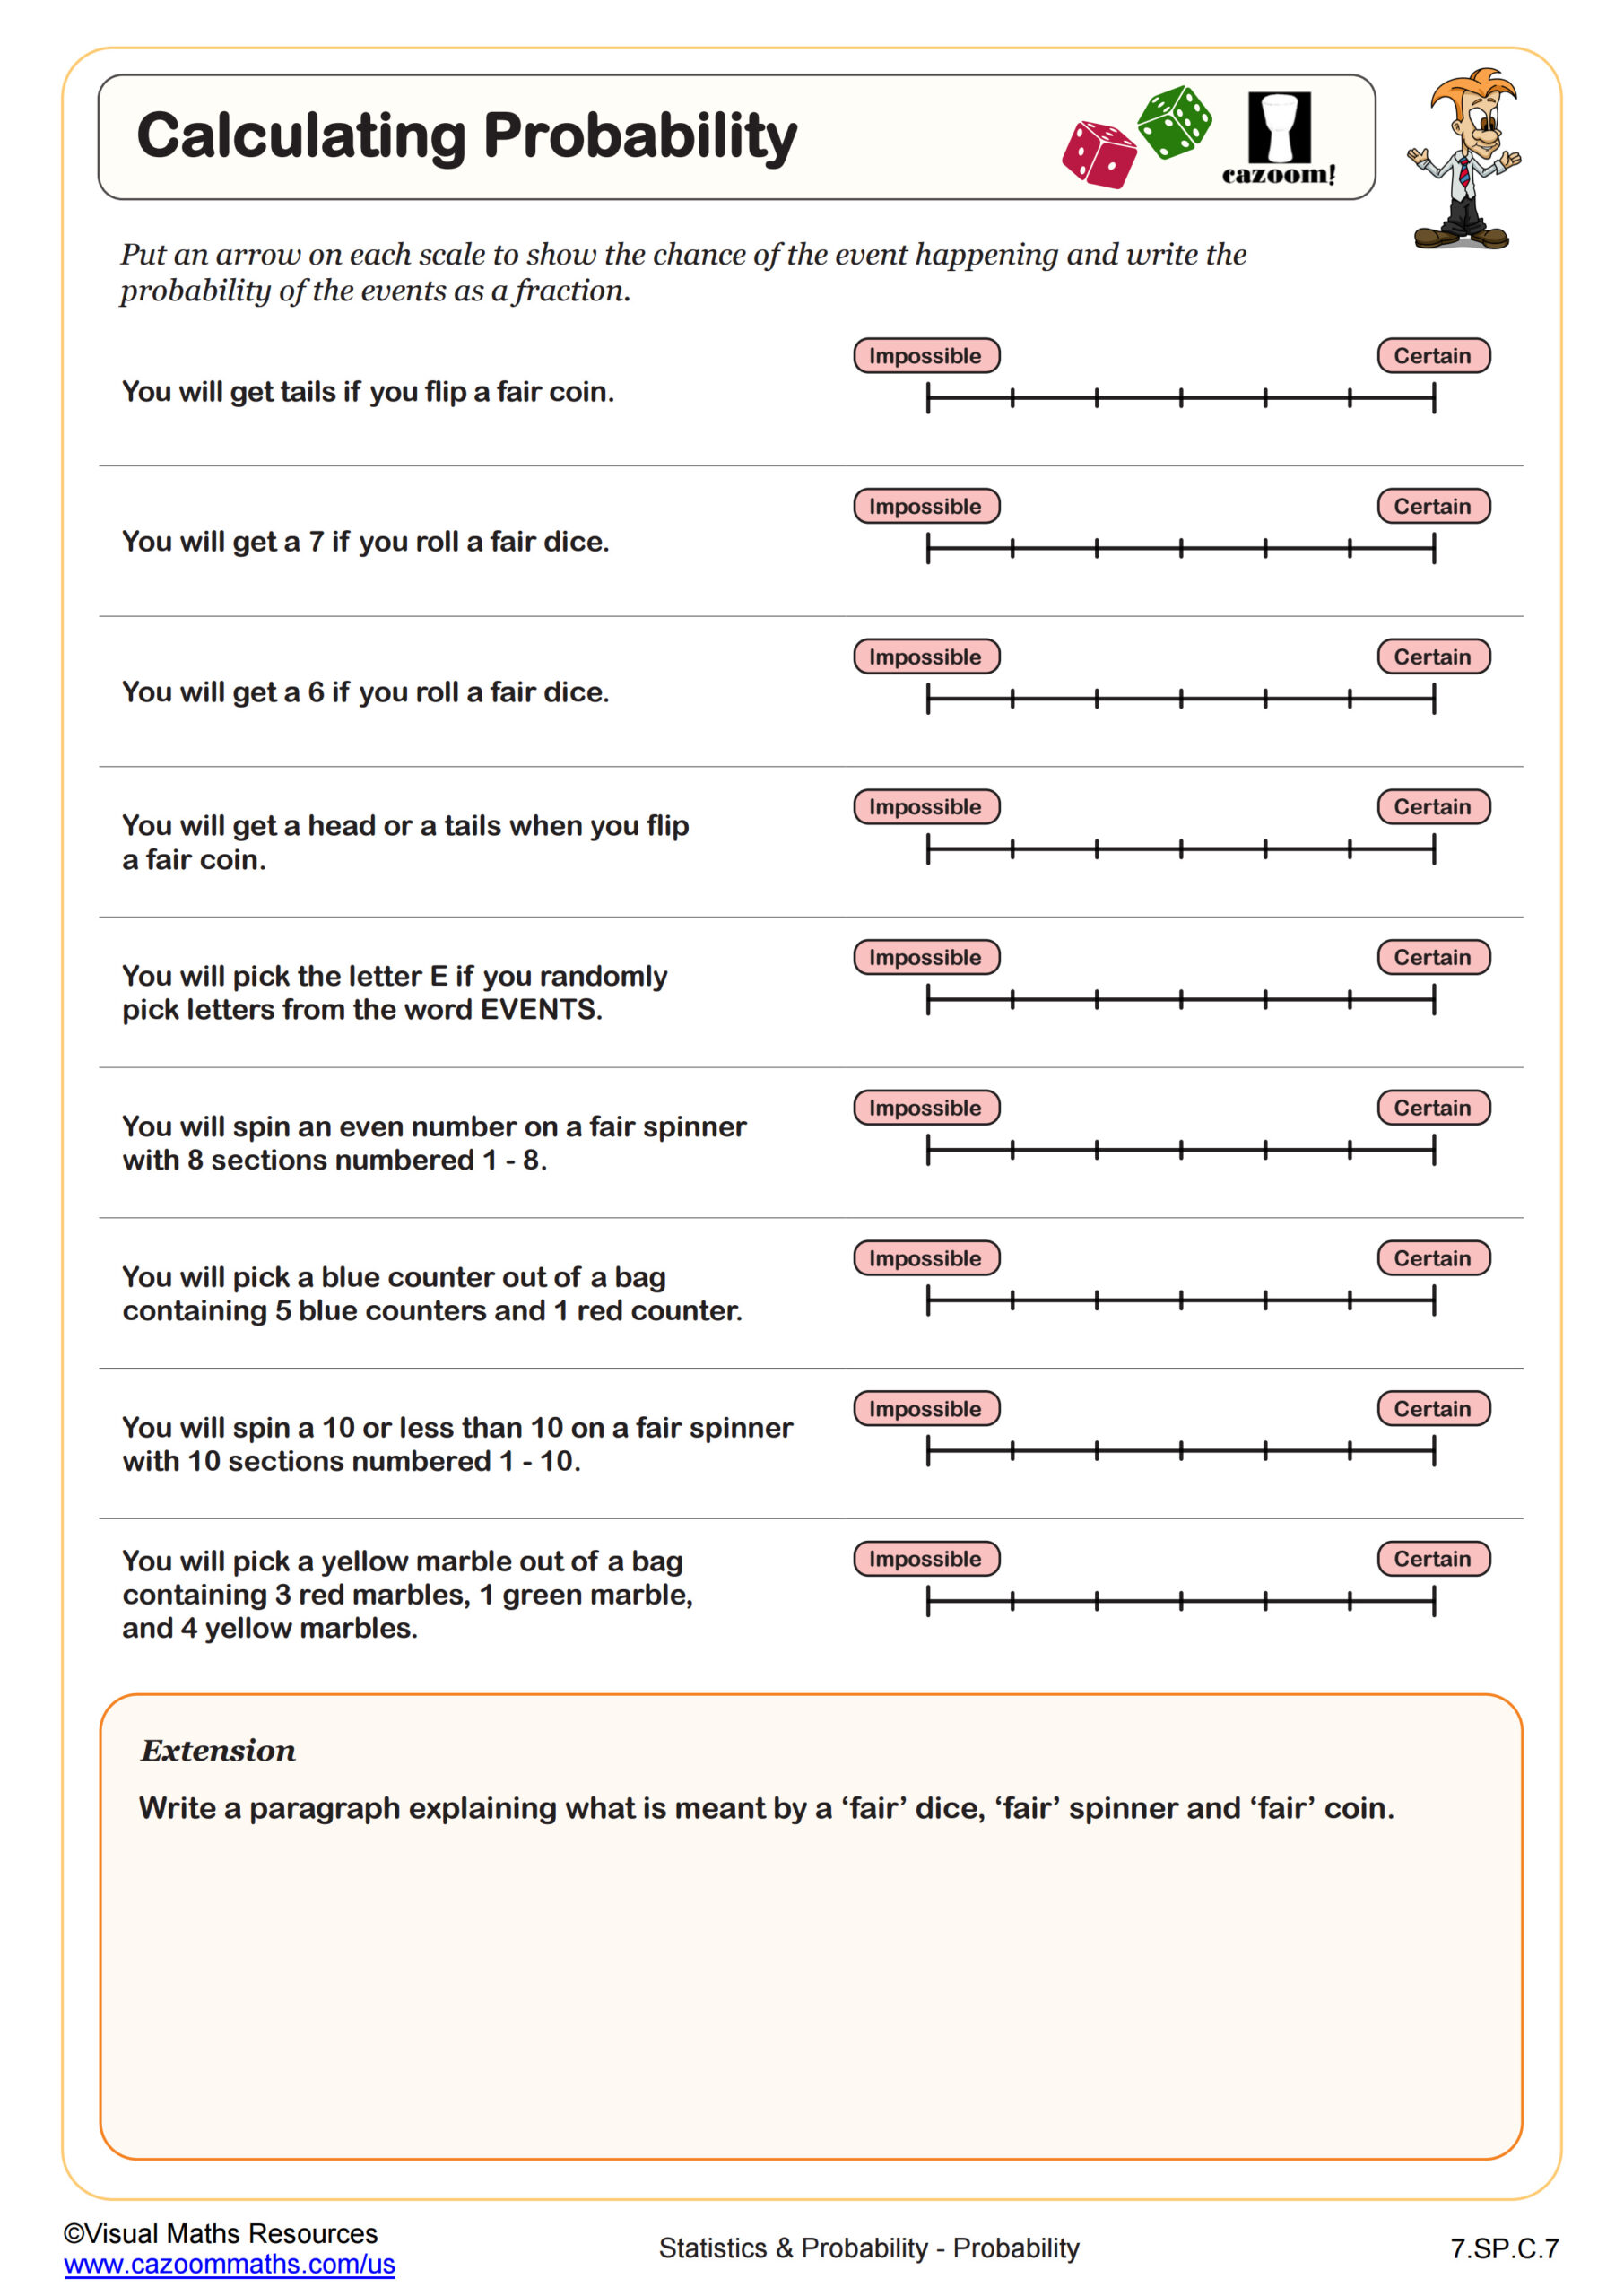
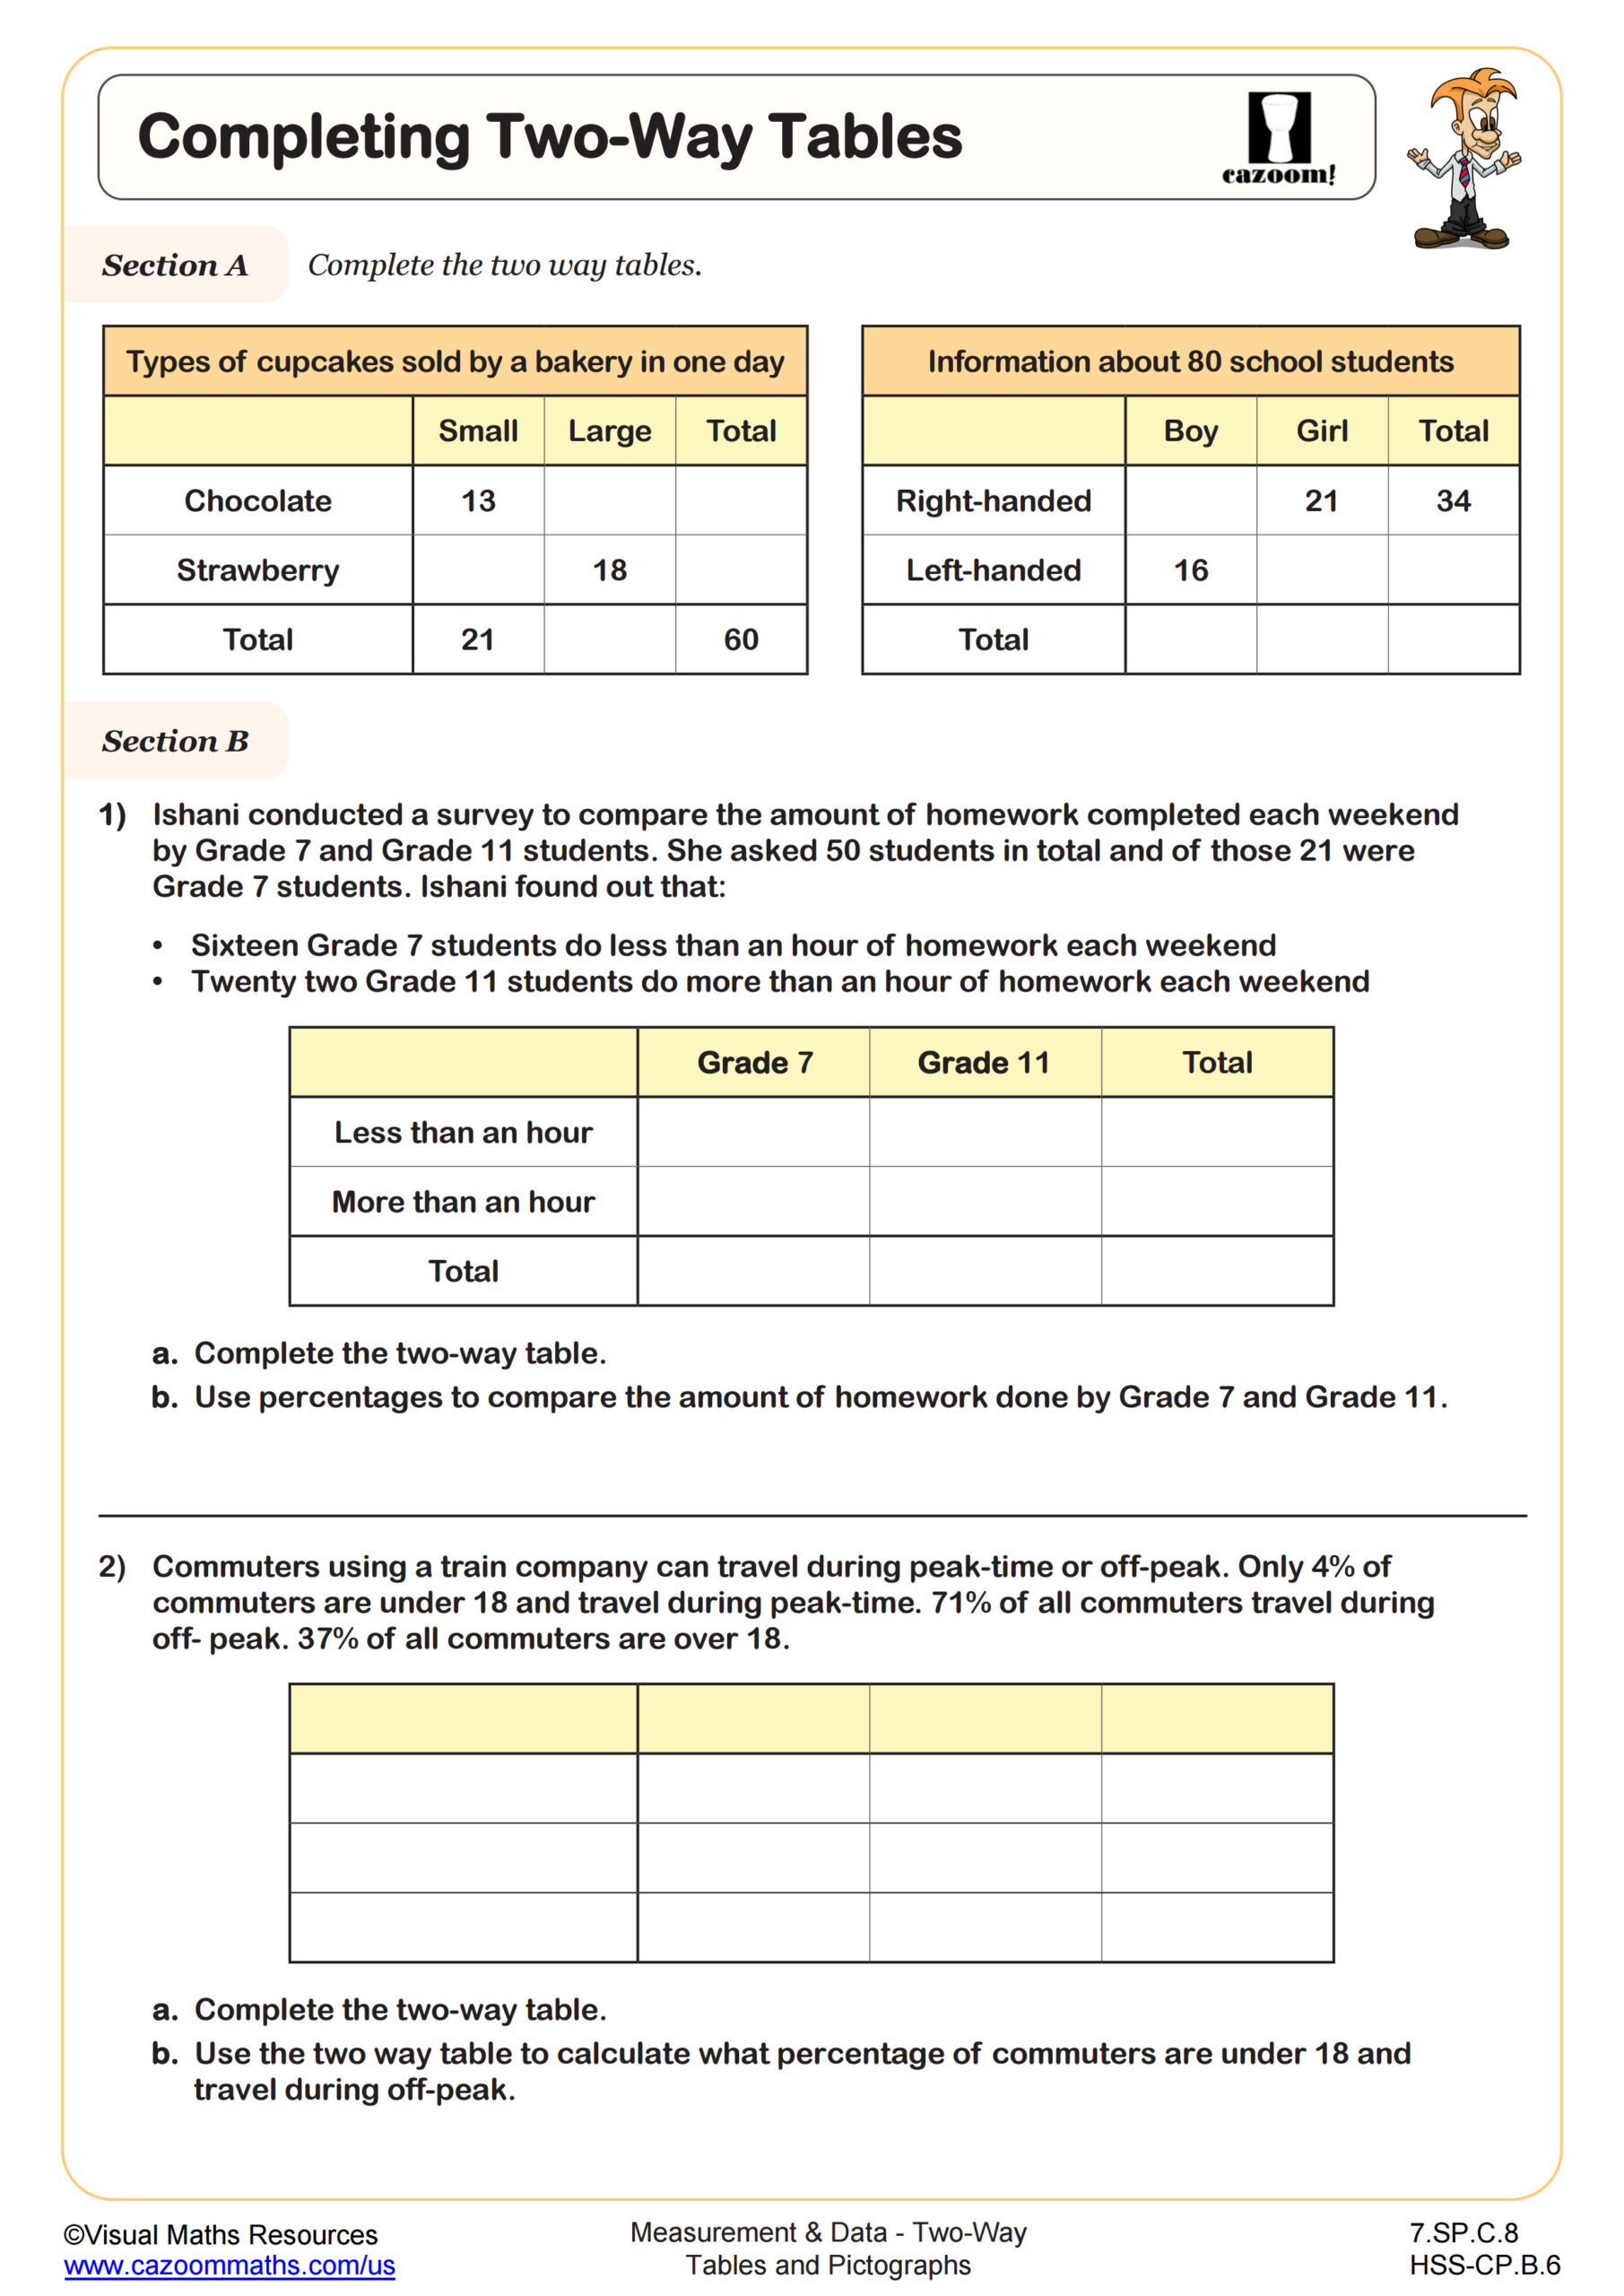
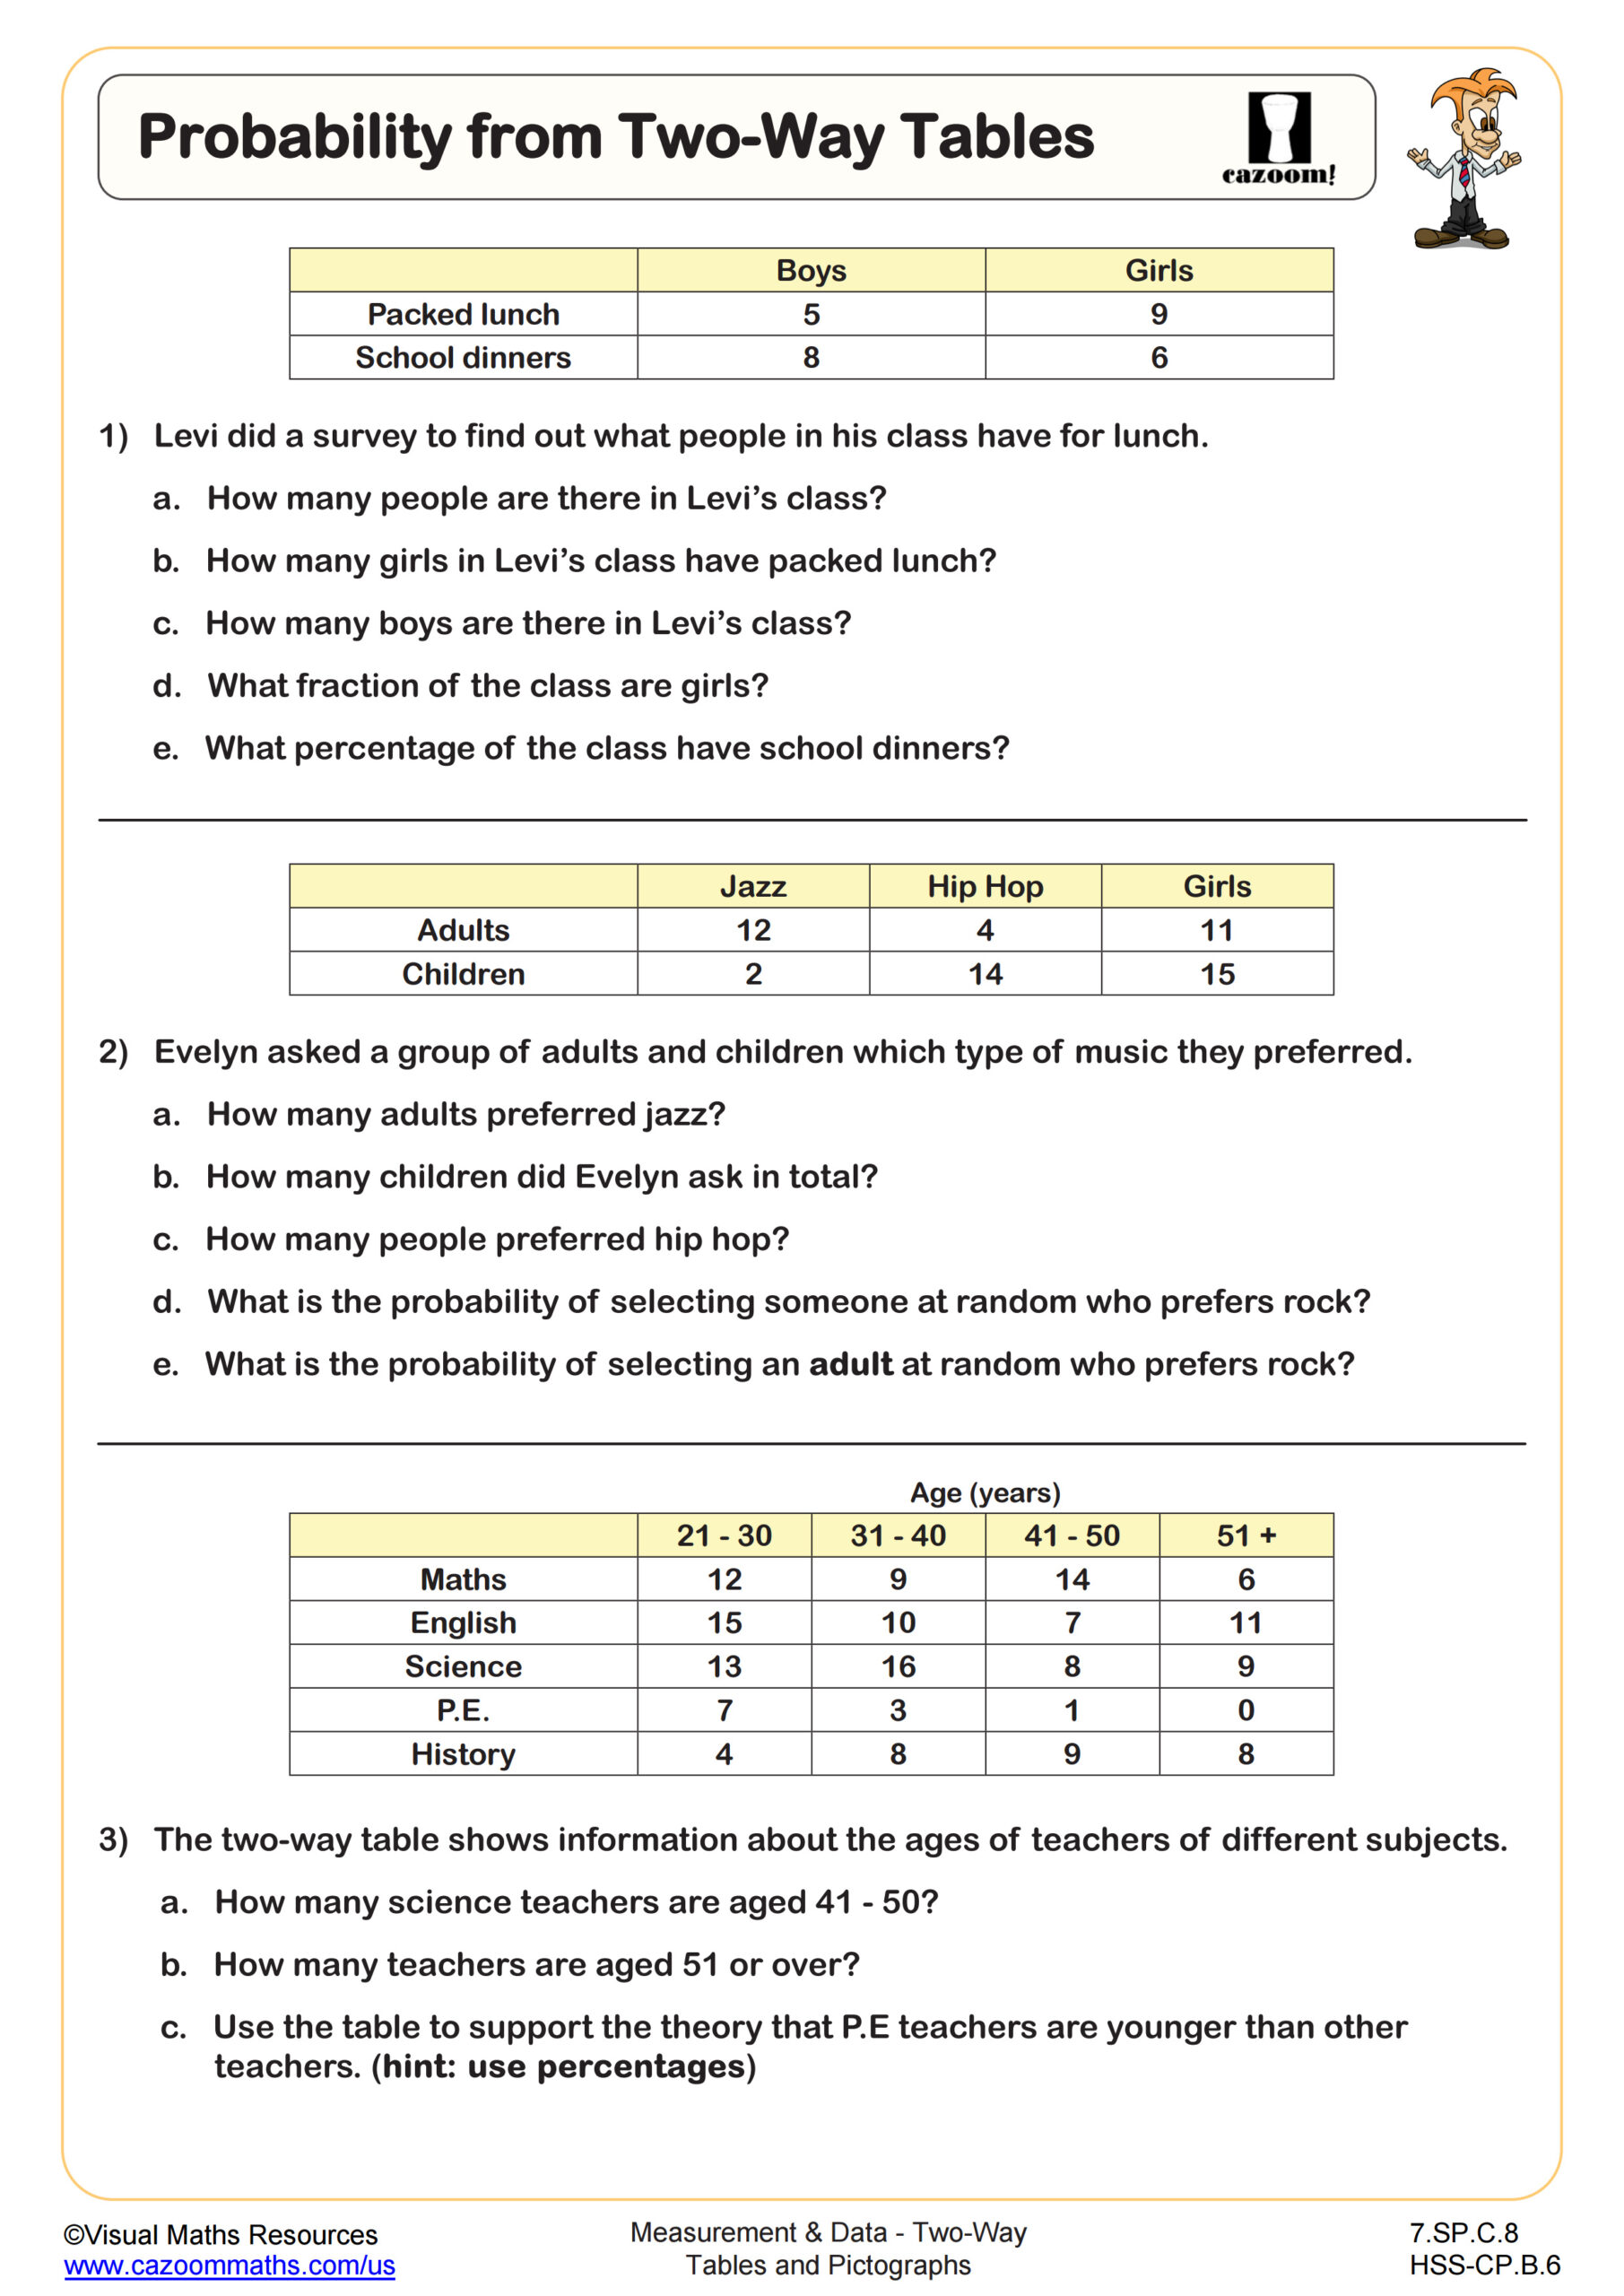
This worksheet follows on from Probability Tree Diagrams (A) by now providing some frequency tree problems involving fractions, percentages, and ratios. Section A provides brief information about a scenario, an incomplete frequency tree, and its corresponding two-way table. Section B provides two scenarios, the first with information involving fractions and percentages, the second involving ratios and fractions. Section C then provides another problem involving fractions and percentages leading to a probability question.
All worksheets are created by the team of experienced teachers at Cazoom Math.
 Worksheet")
RELATED TO Probability Tree Diagrams (B) WORKSHEET
Frequently Asked Questions
This probability tree diagrams (b) worksheet is designed for students in 7th Grade and Geometry and aligns with Common Core State Standards.