Producing Two Way Tables WORKSHEET
Producing Two Way Tables WORKSHEET DESCRIPTION
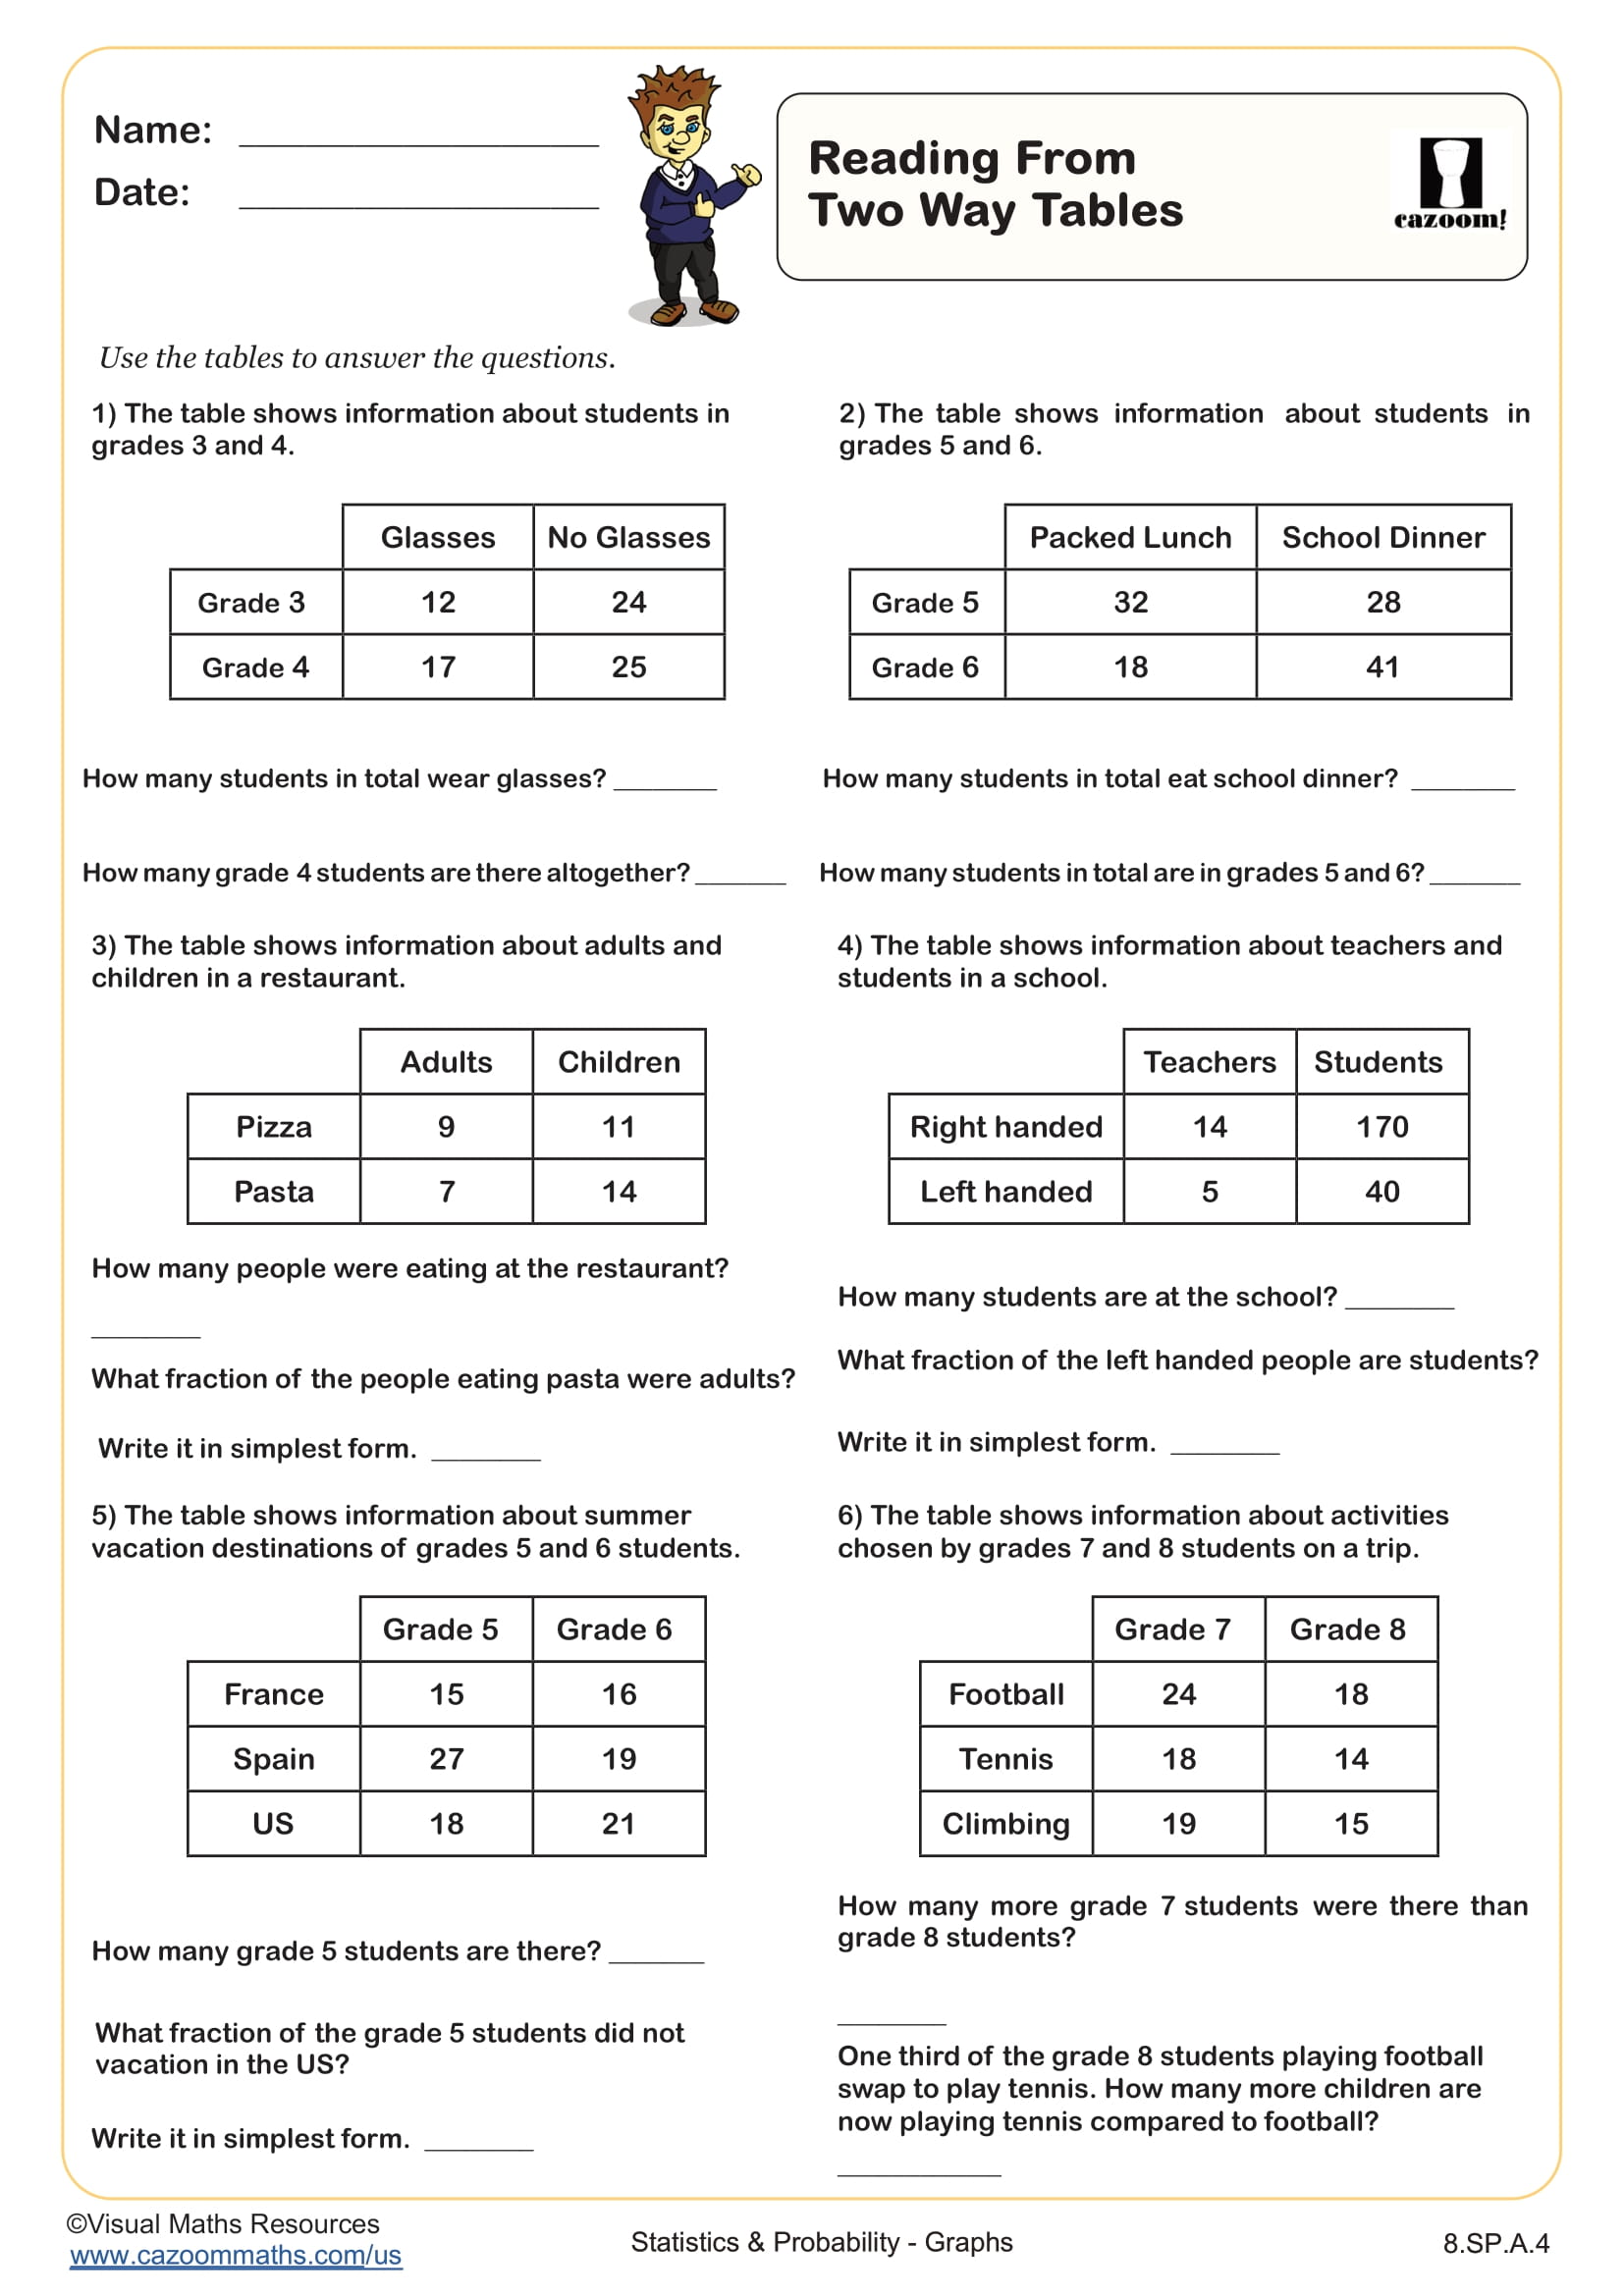
Following on from the worksheet called Reading from Two Way Tables, this worksheet gives learners practice in producing or completing two way tables. Section A provided an array of triangles and quadrilaterals which need to be categorized in a two way table based on the number of sides and whether they have a right angle. Section B provides information about the eye color of grade 3 and grade 4 children where clues to each box of the table must be used in its completion. Section C contains a mixture of written information and some values in a table which needs to be completed.
All worksheets are created by the team of experienced teachers at Cazoom Math.

RELATED TO Producing Two Way Tables WORKSHEET
Frequently Asked Questions
This producing two way tables worksheet is designed for students in 8th Grade and aligns with Common Core State Standards.