Back to:
Reflecting Graphs WORKSHEET
Suitable for Grades: Algebra I, IM 1
CCSS: HSA.REI.D.10, HSF.IF.A.1
CCSS Description: Understand that the graph of an equation in two variables is the set of all its solutions plotted in the coordinate plane, often forming a curve (which could be a line).
Understand that a function from one set (called the domain) to another set (called the range) assigns to each element of the domain exactly one element of the range. If f is a function and x is an element of its domain, then f(x) denotes the output of f corresponding to the input x. The graph of f is the graph of the equation y = f(x).
Understand that a function from one set (called the domain) to another set (called the range) assigns to each element of the domain exactly one element of the range. If f is a function and x is an element of its domain, then f(x) denotes the output of f corresponding to the input x. The graph of f is the graph of the equation y = f(x).
Reflecting Graphs WORKSHEET DESCRIPTION
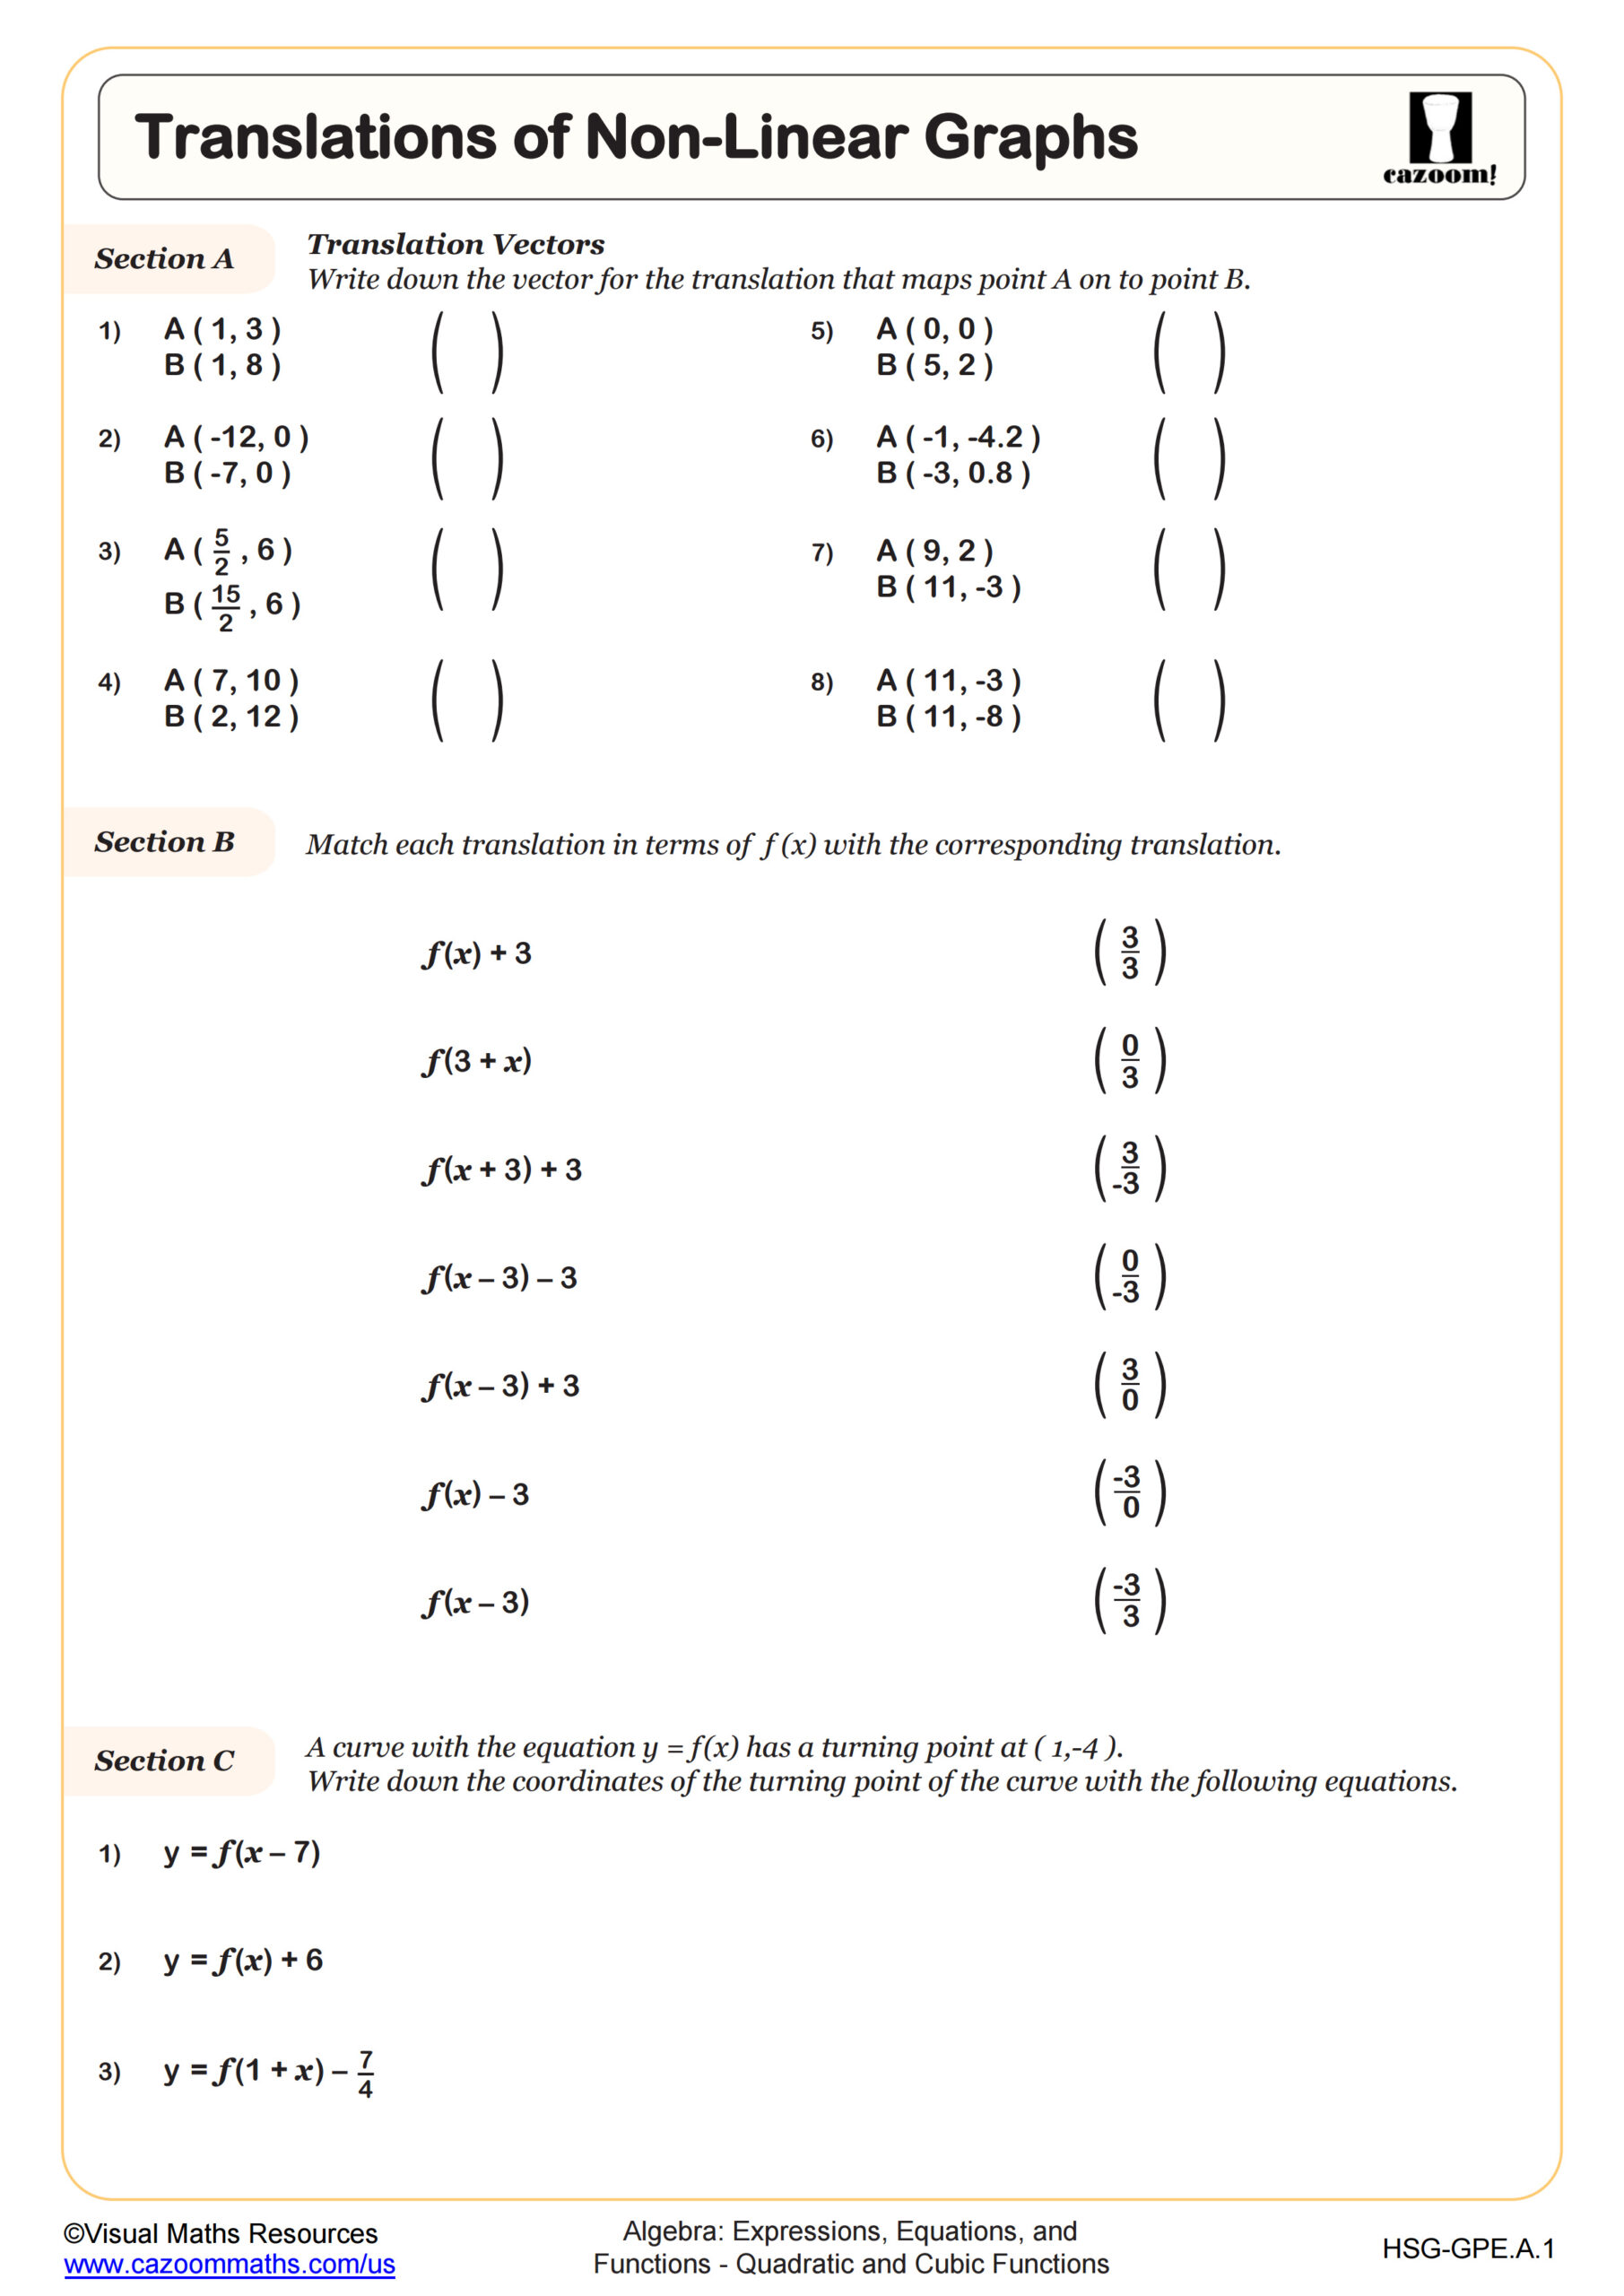
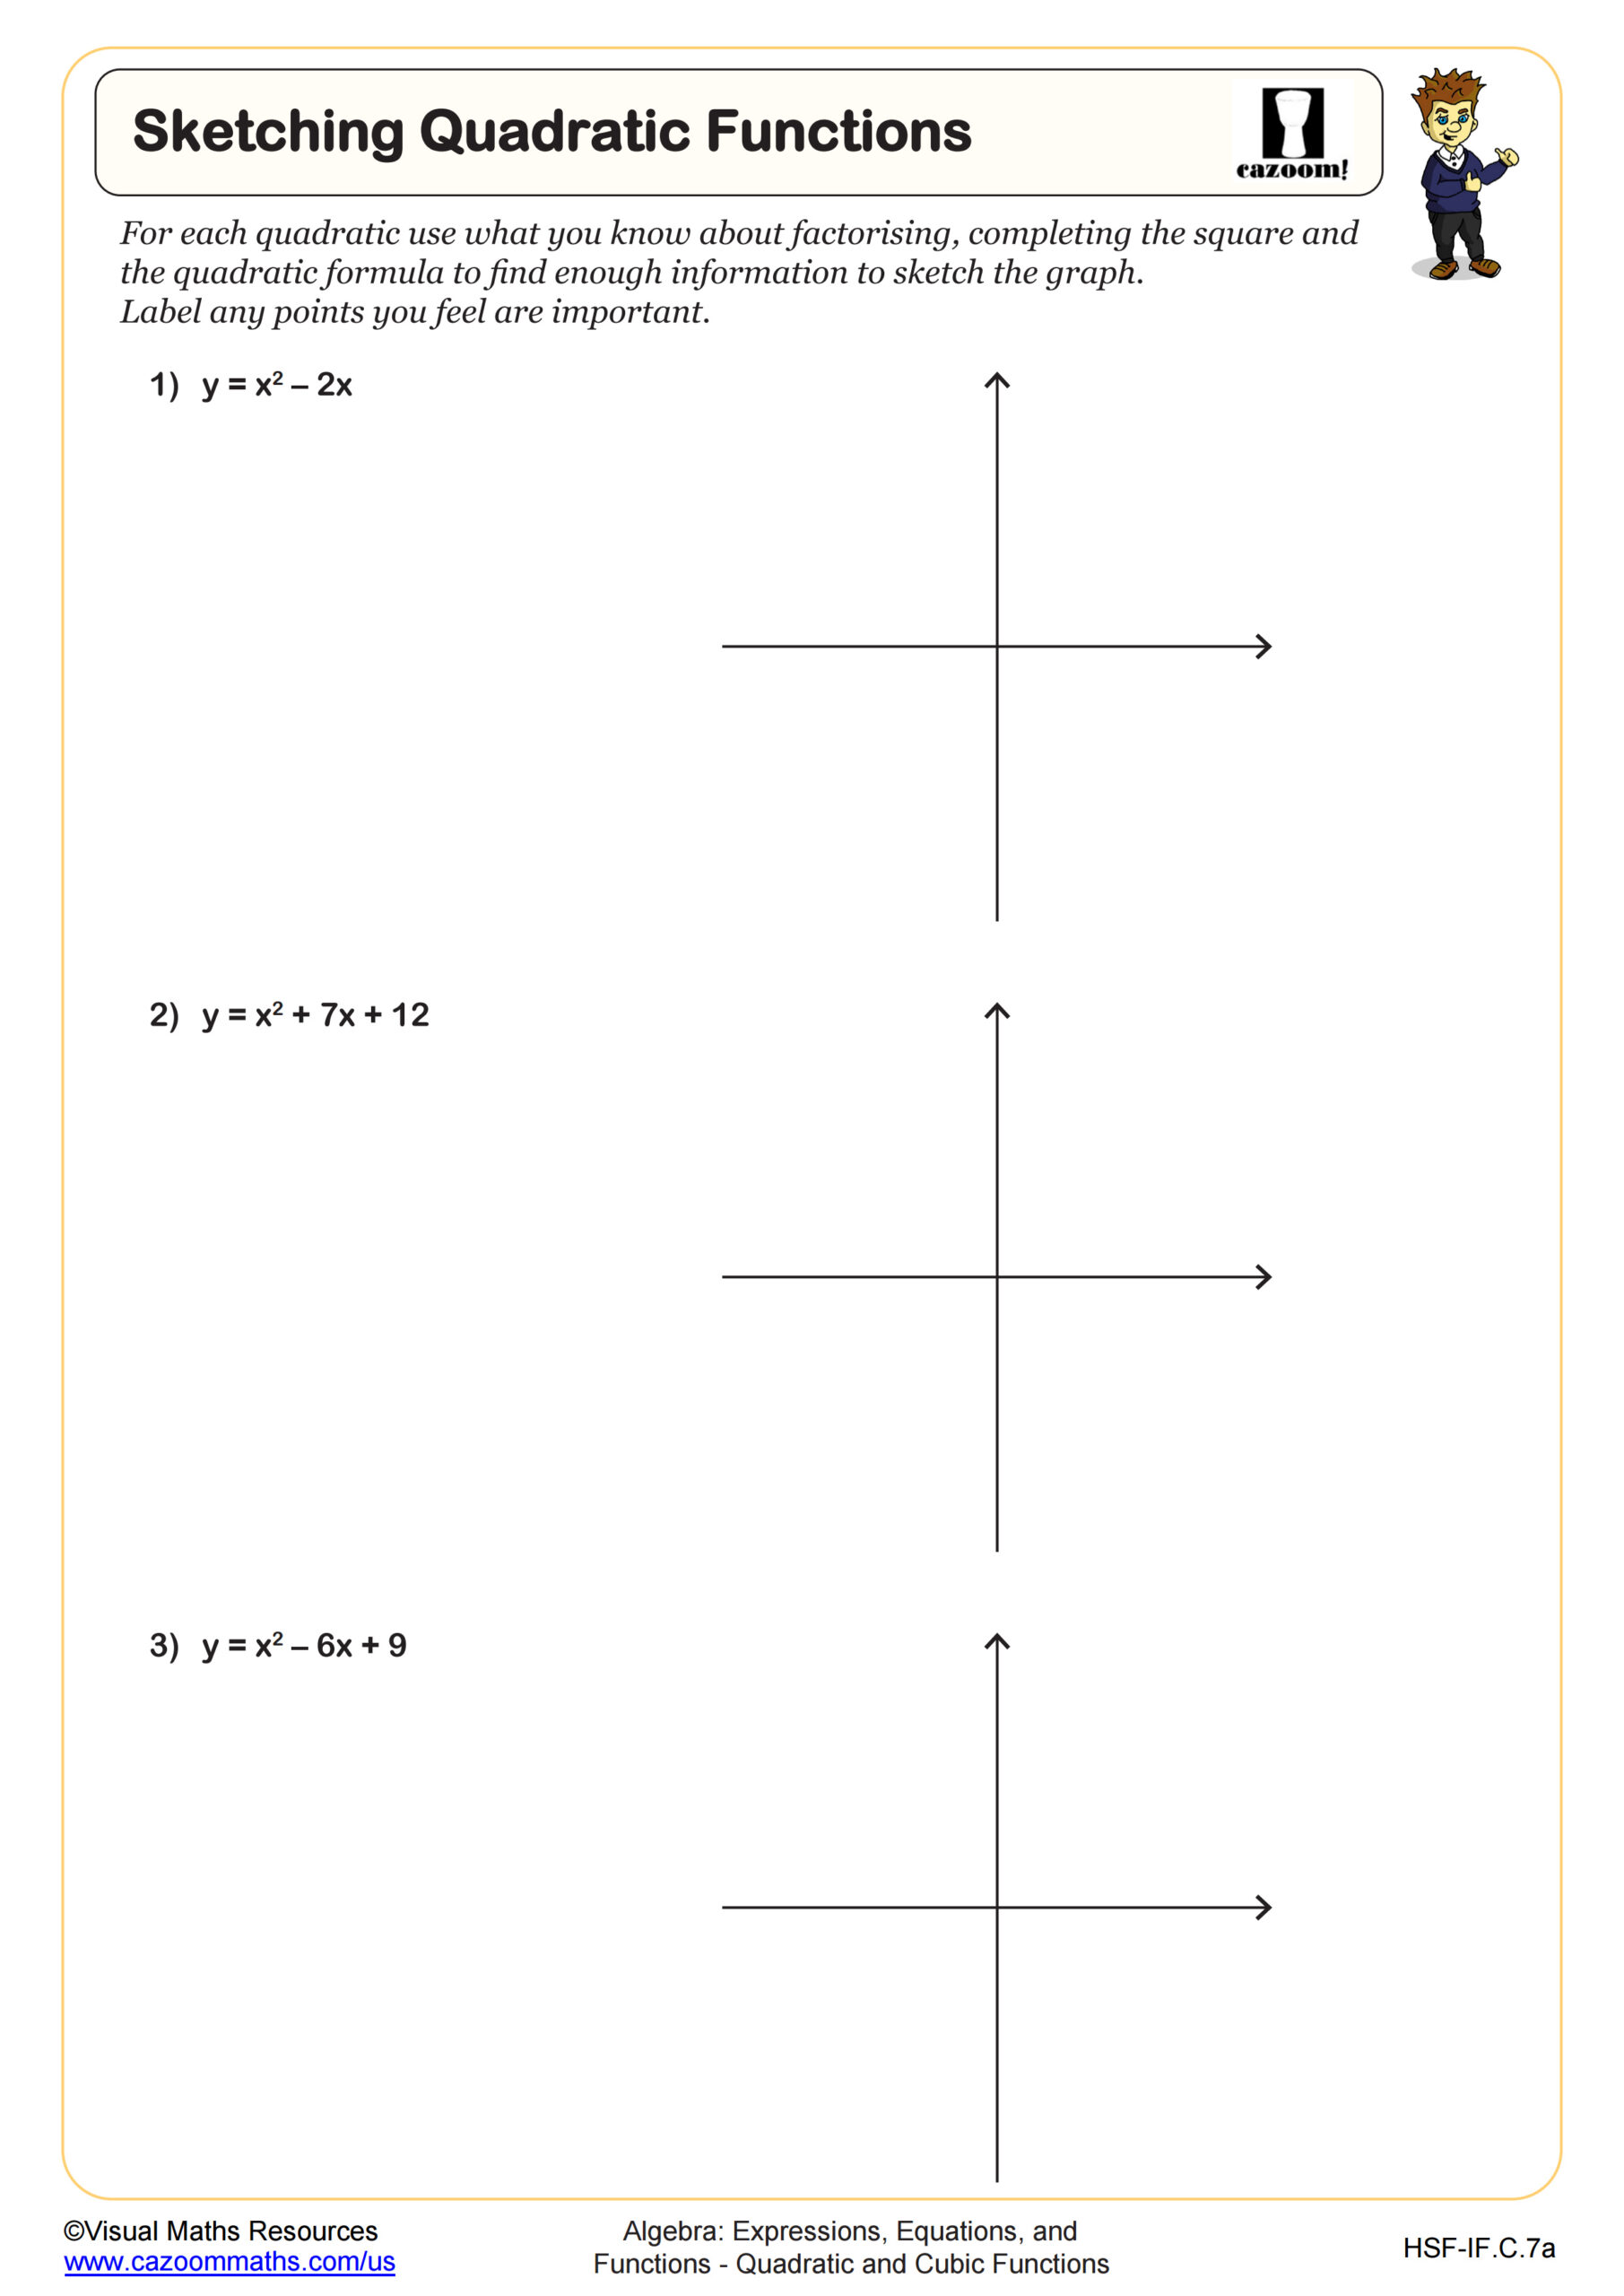
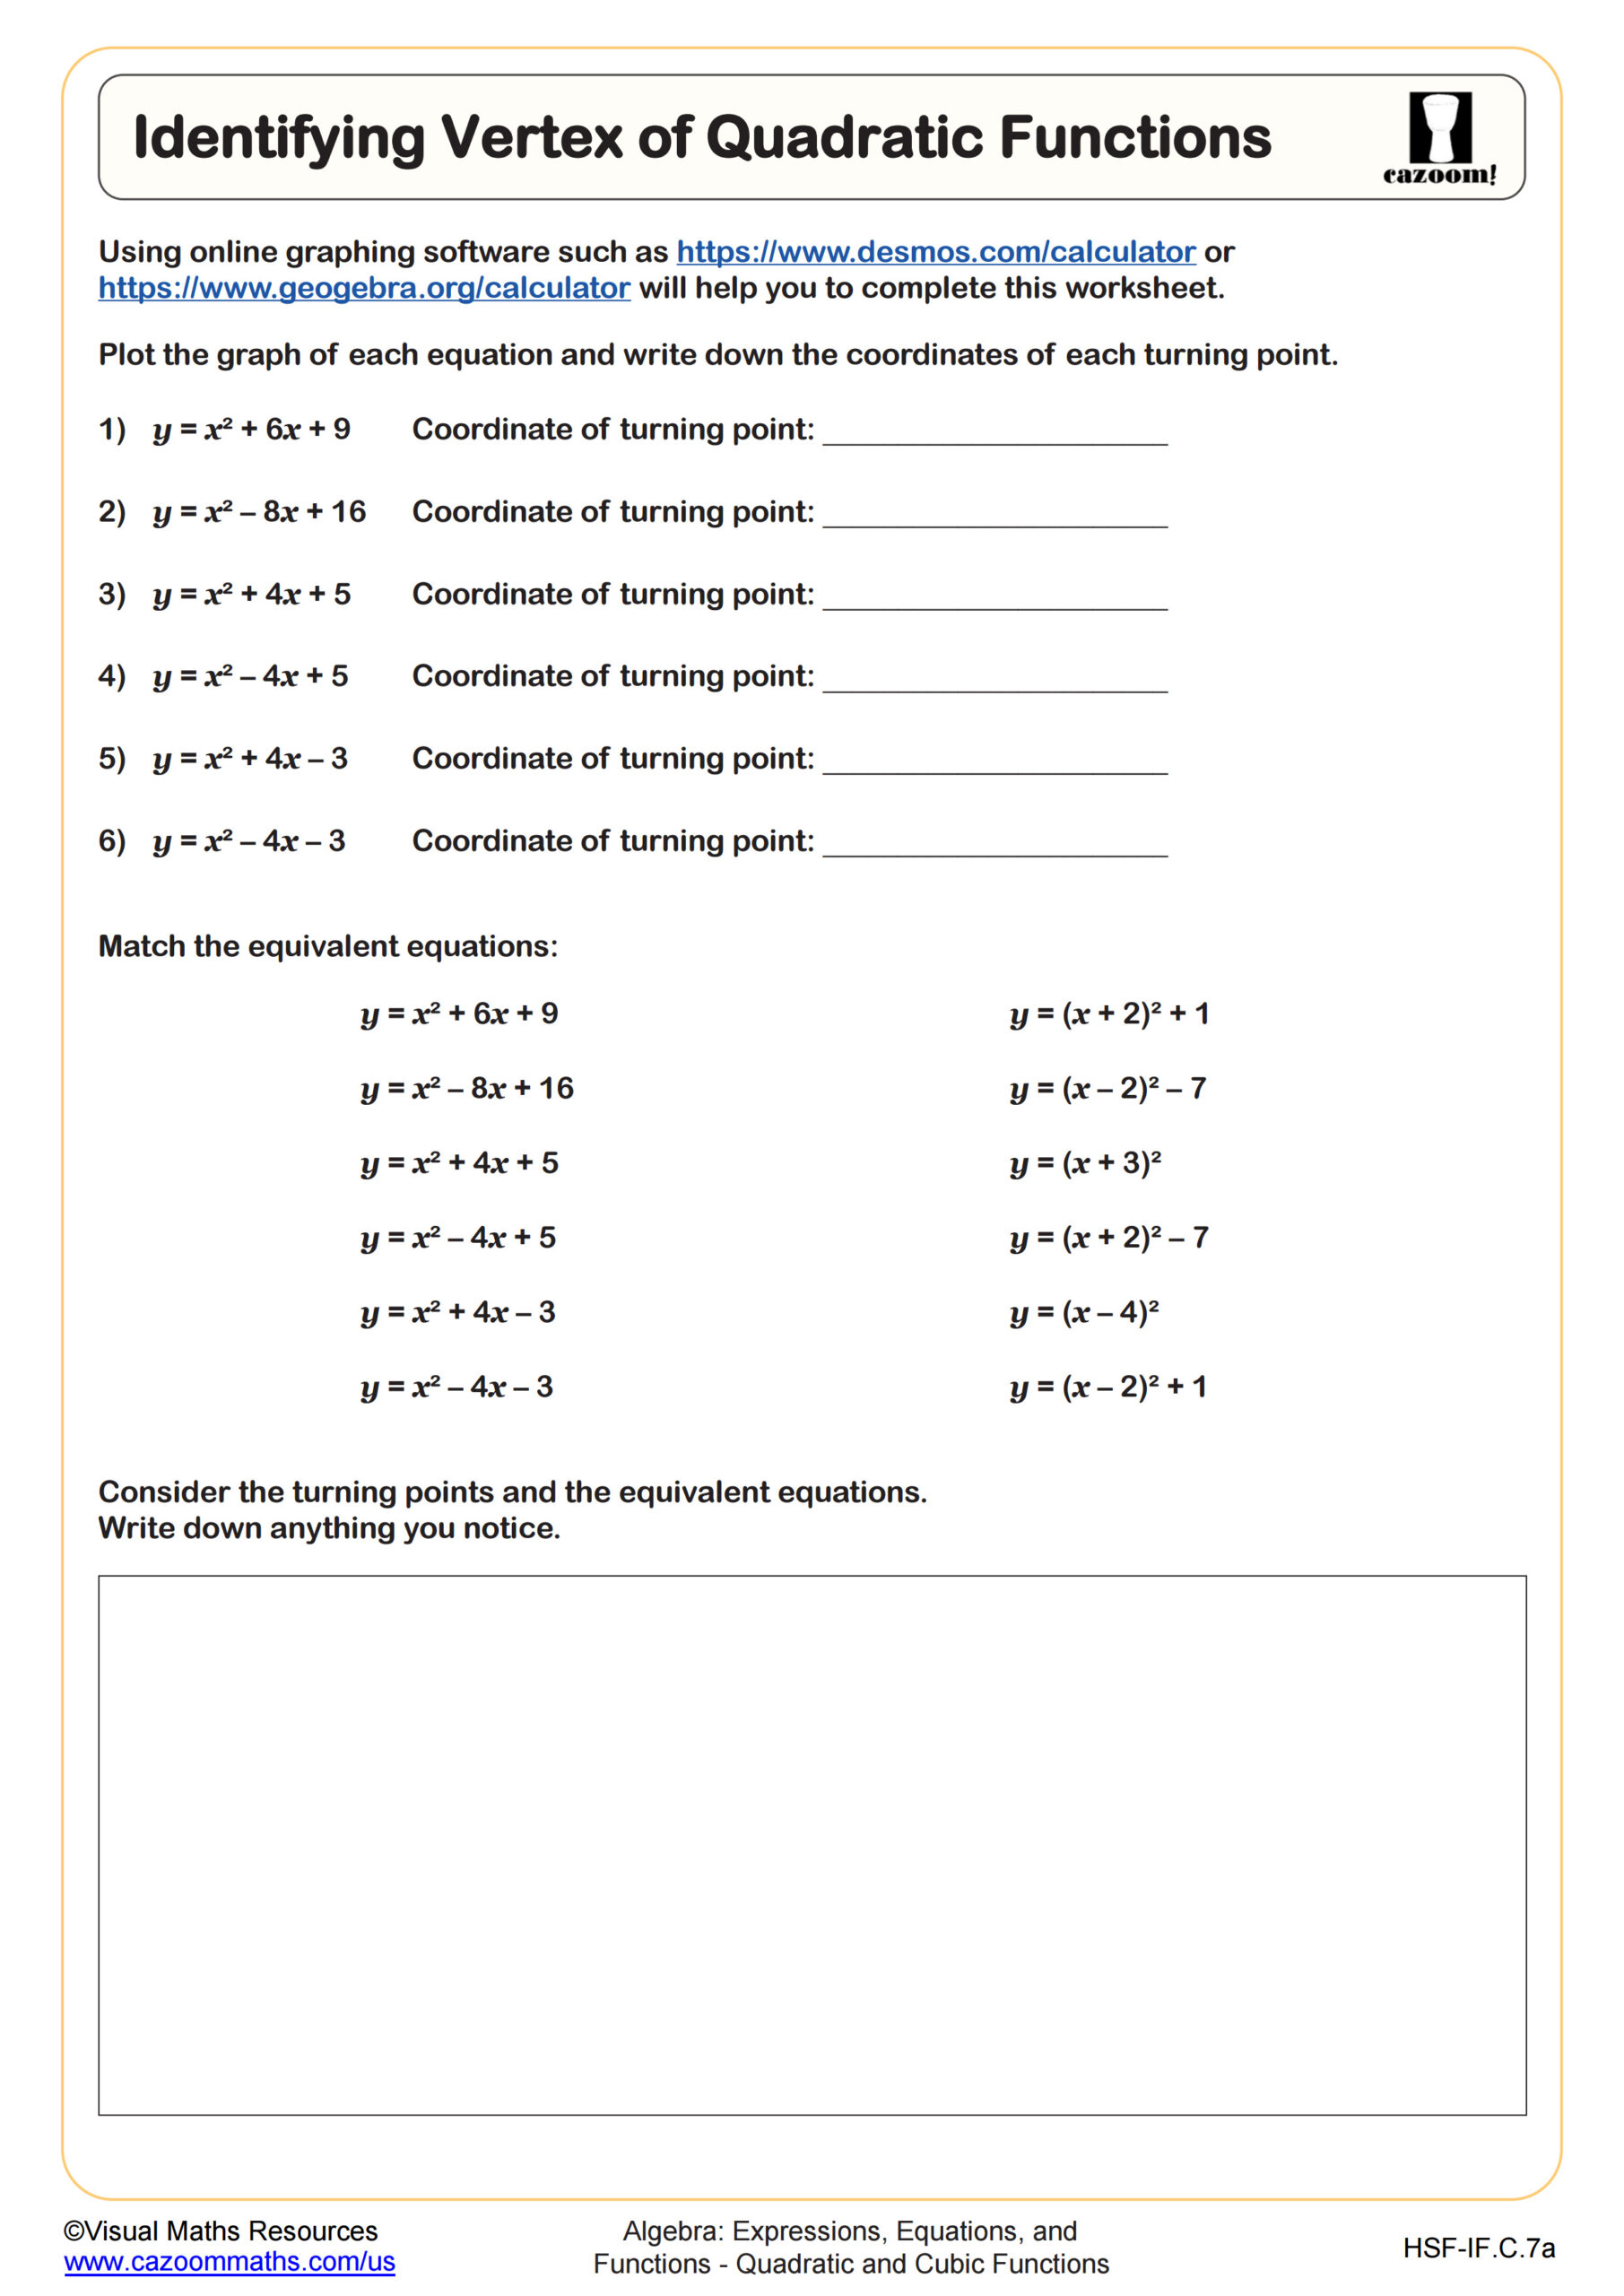
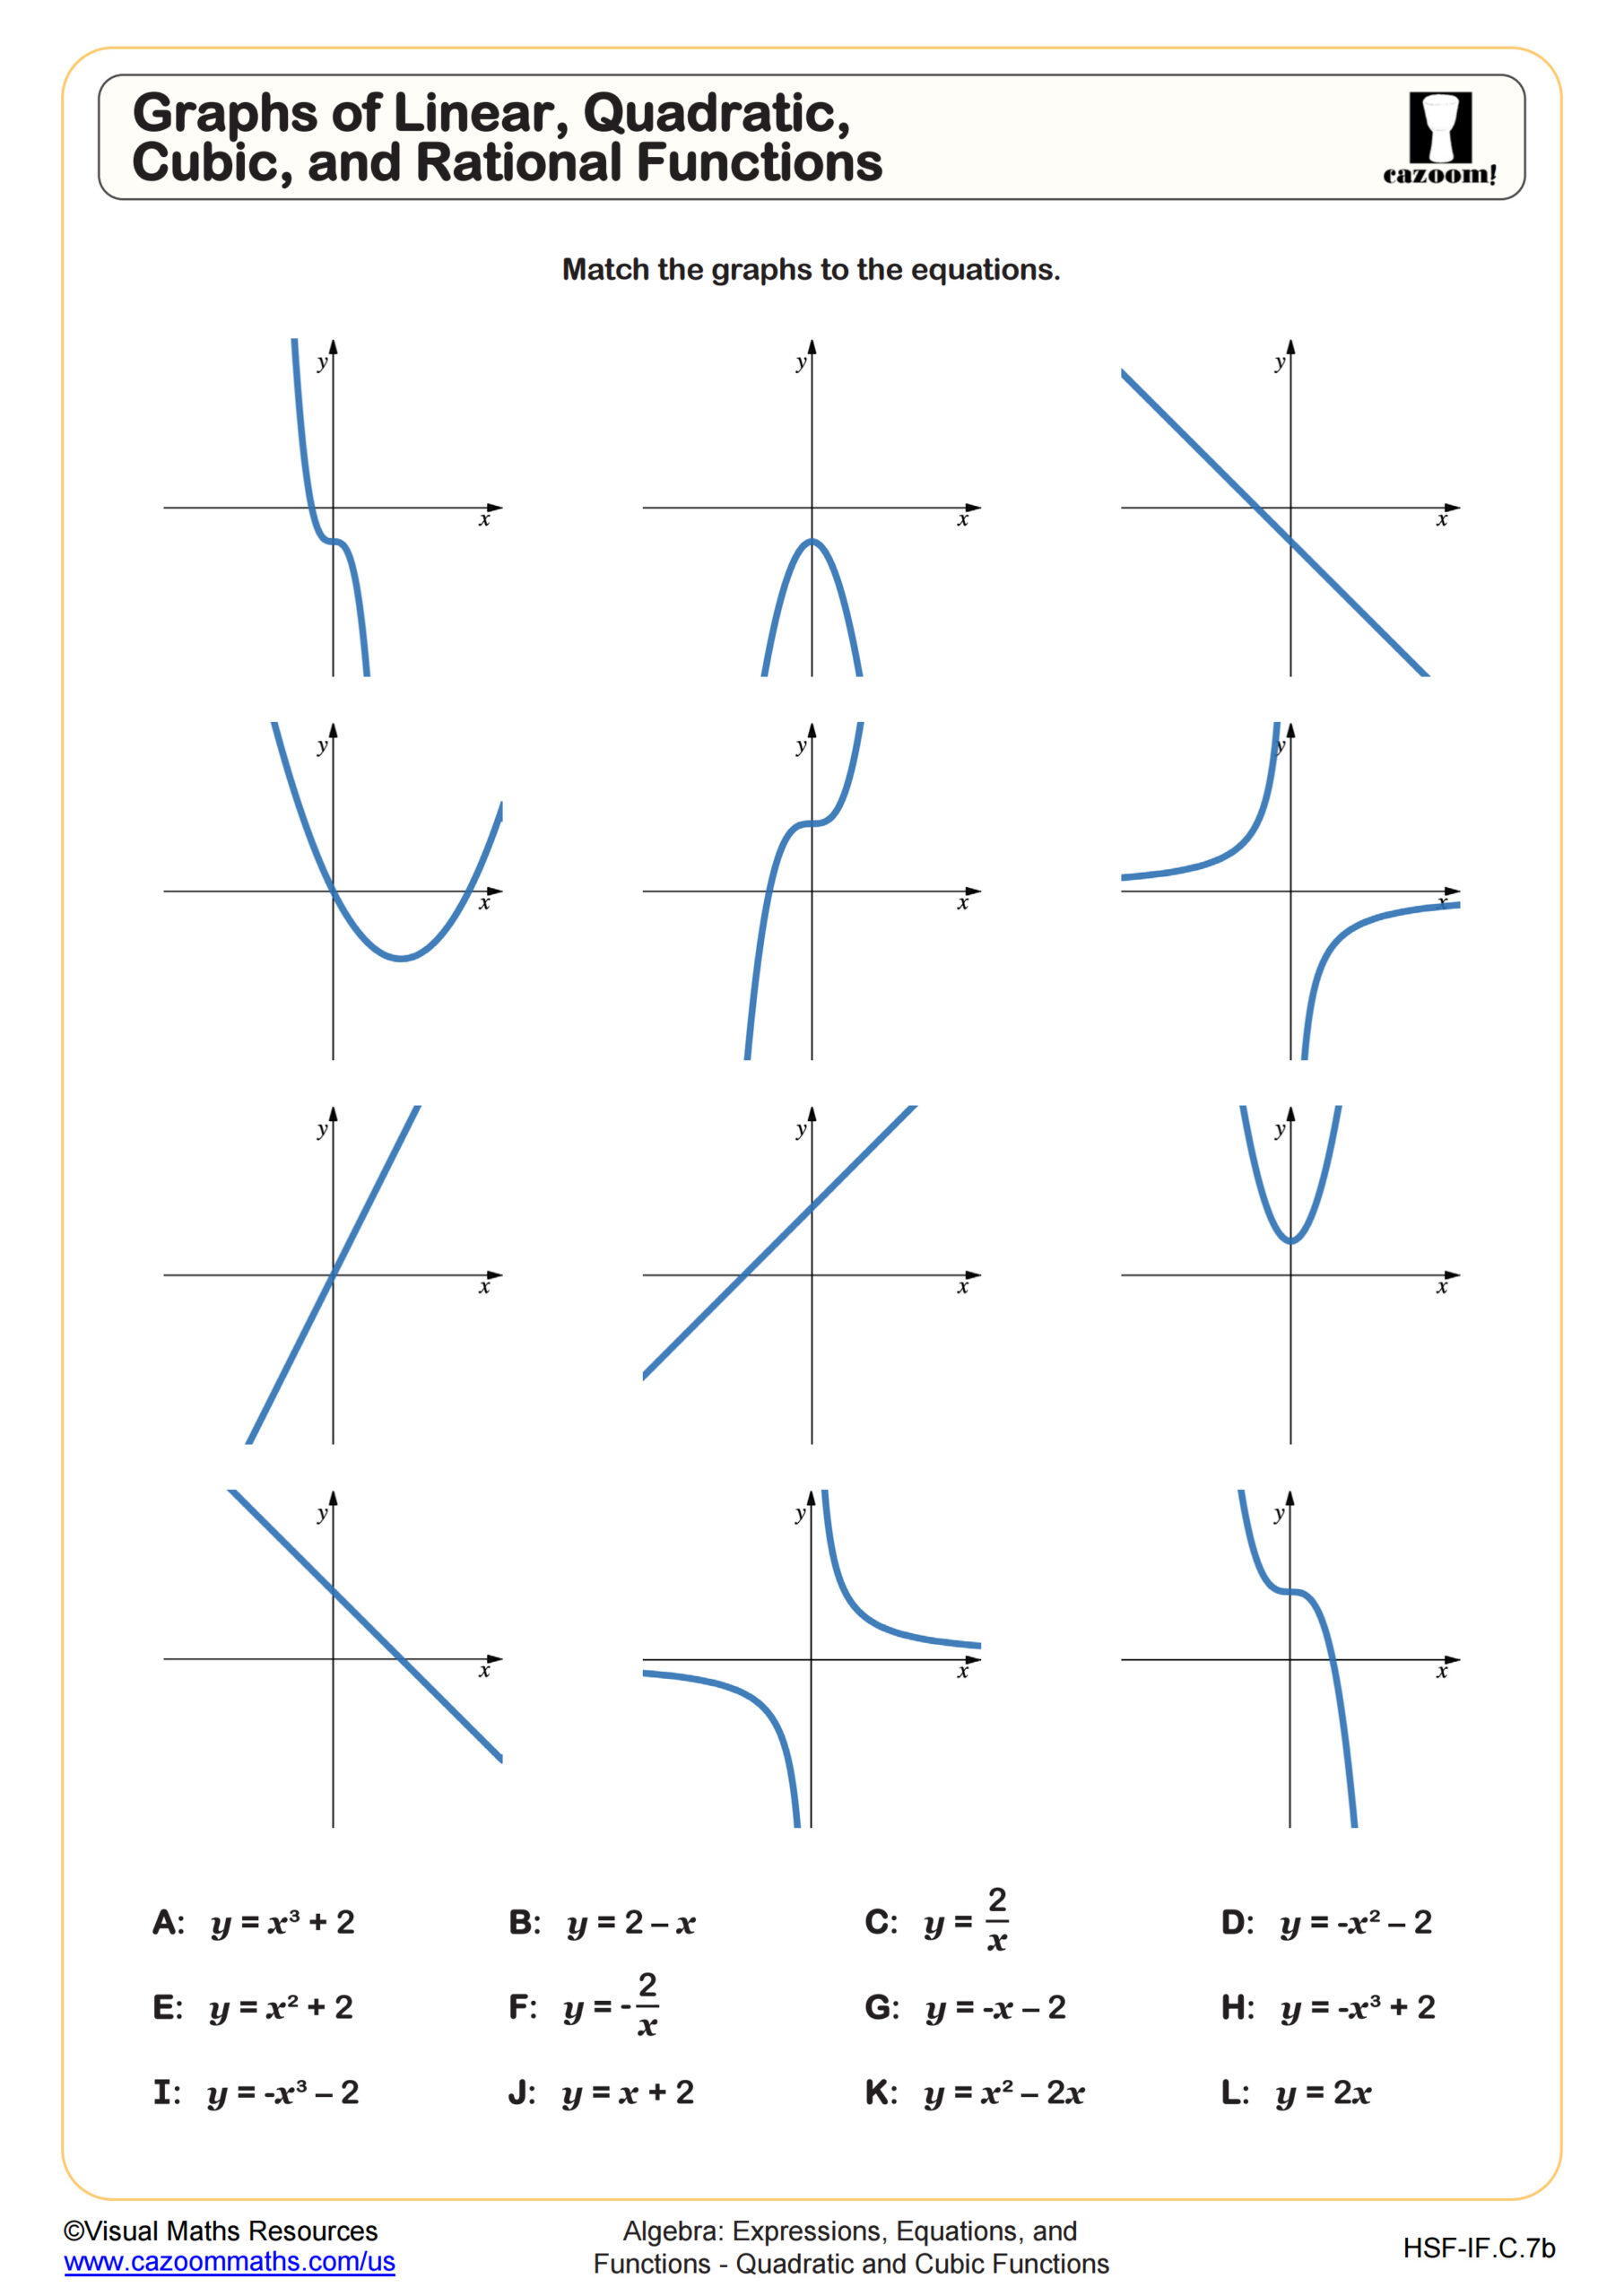
This worksheet introduces and scaffolds reflecting graphs using the f(-x) and -f(x) notation. It begins by asking learners to substitute valuea and plot points to derive the general relationship between the different reflections and the coordinats of the images. It then asks learners to skecth graphs for different reflections. The final section asks for learners to fill in the gaps of coordinates involved in reflections.
All worksheets are created by the team of experienced teachers at Cazoom Math.

RELATED TO Reflecting Graphs WORKSHEET
Frequently Asked Questions
This reflecting graphs worksheet is designed for students in Algebra I and IM 1 and aligns with Common Core State Standards.