Relative Frequency WORKSHEET
Relative Frequency WORKSHEET DESCRIPTION
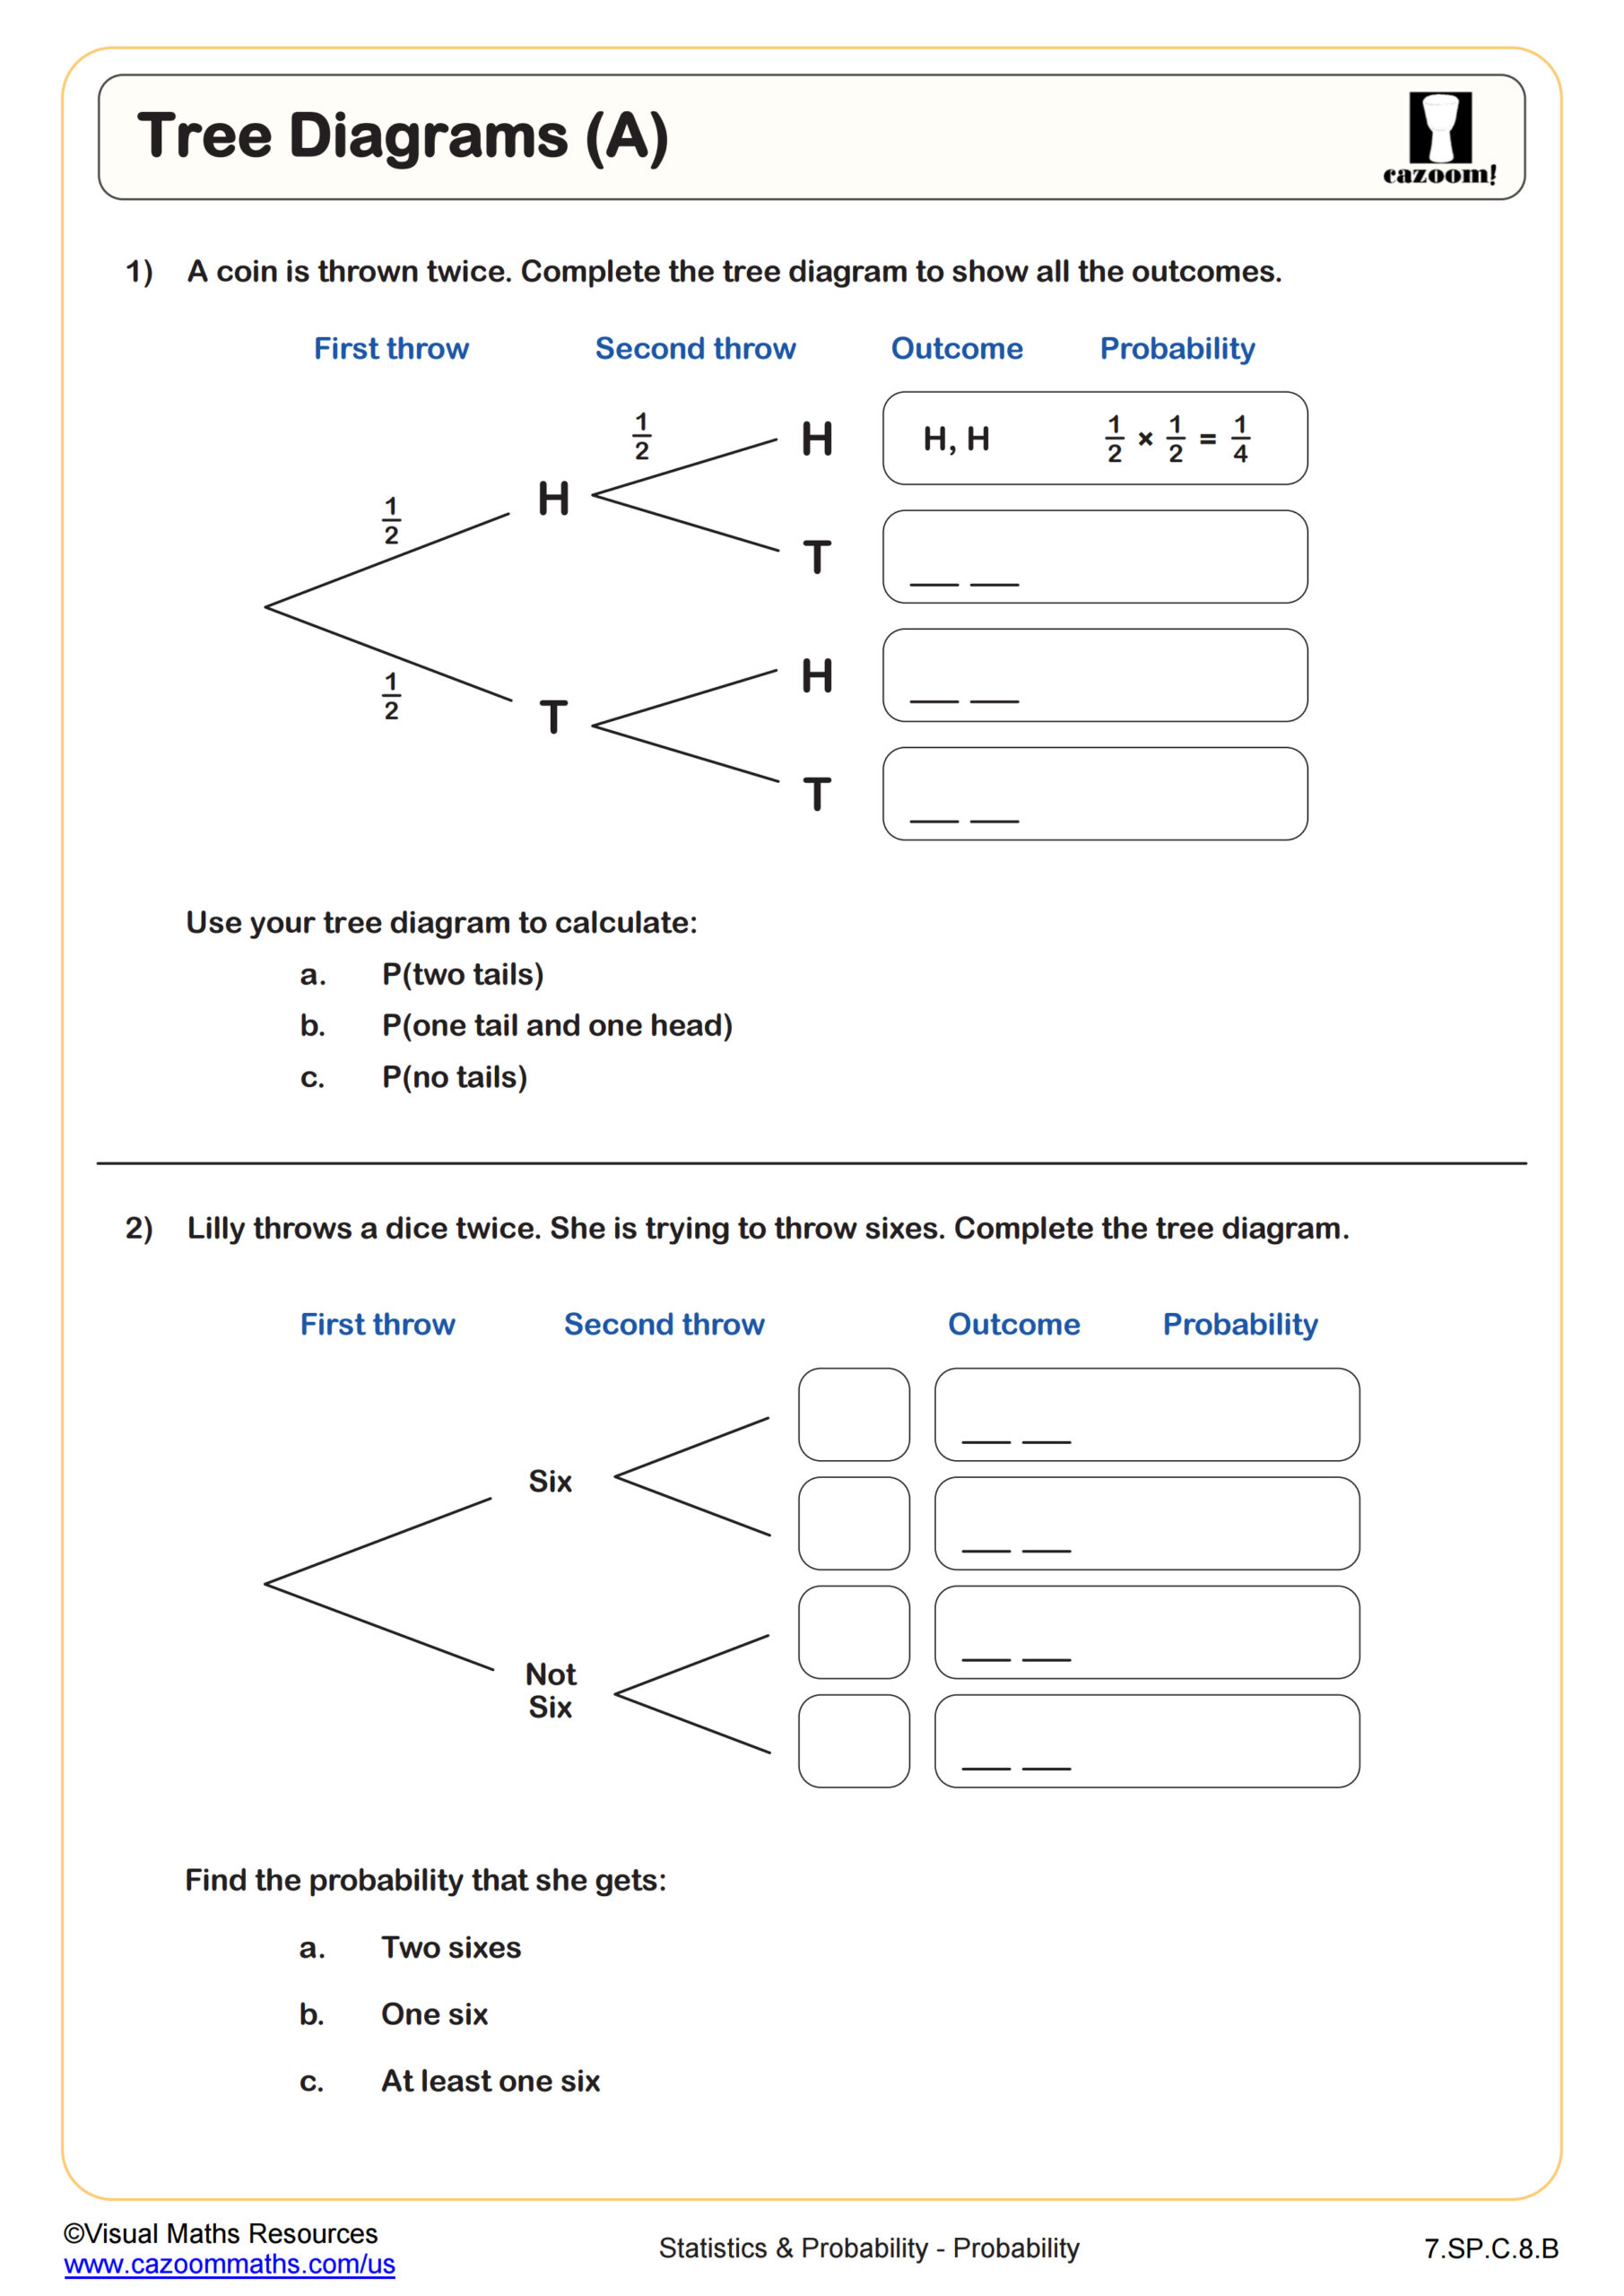
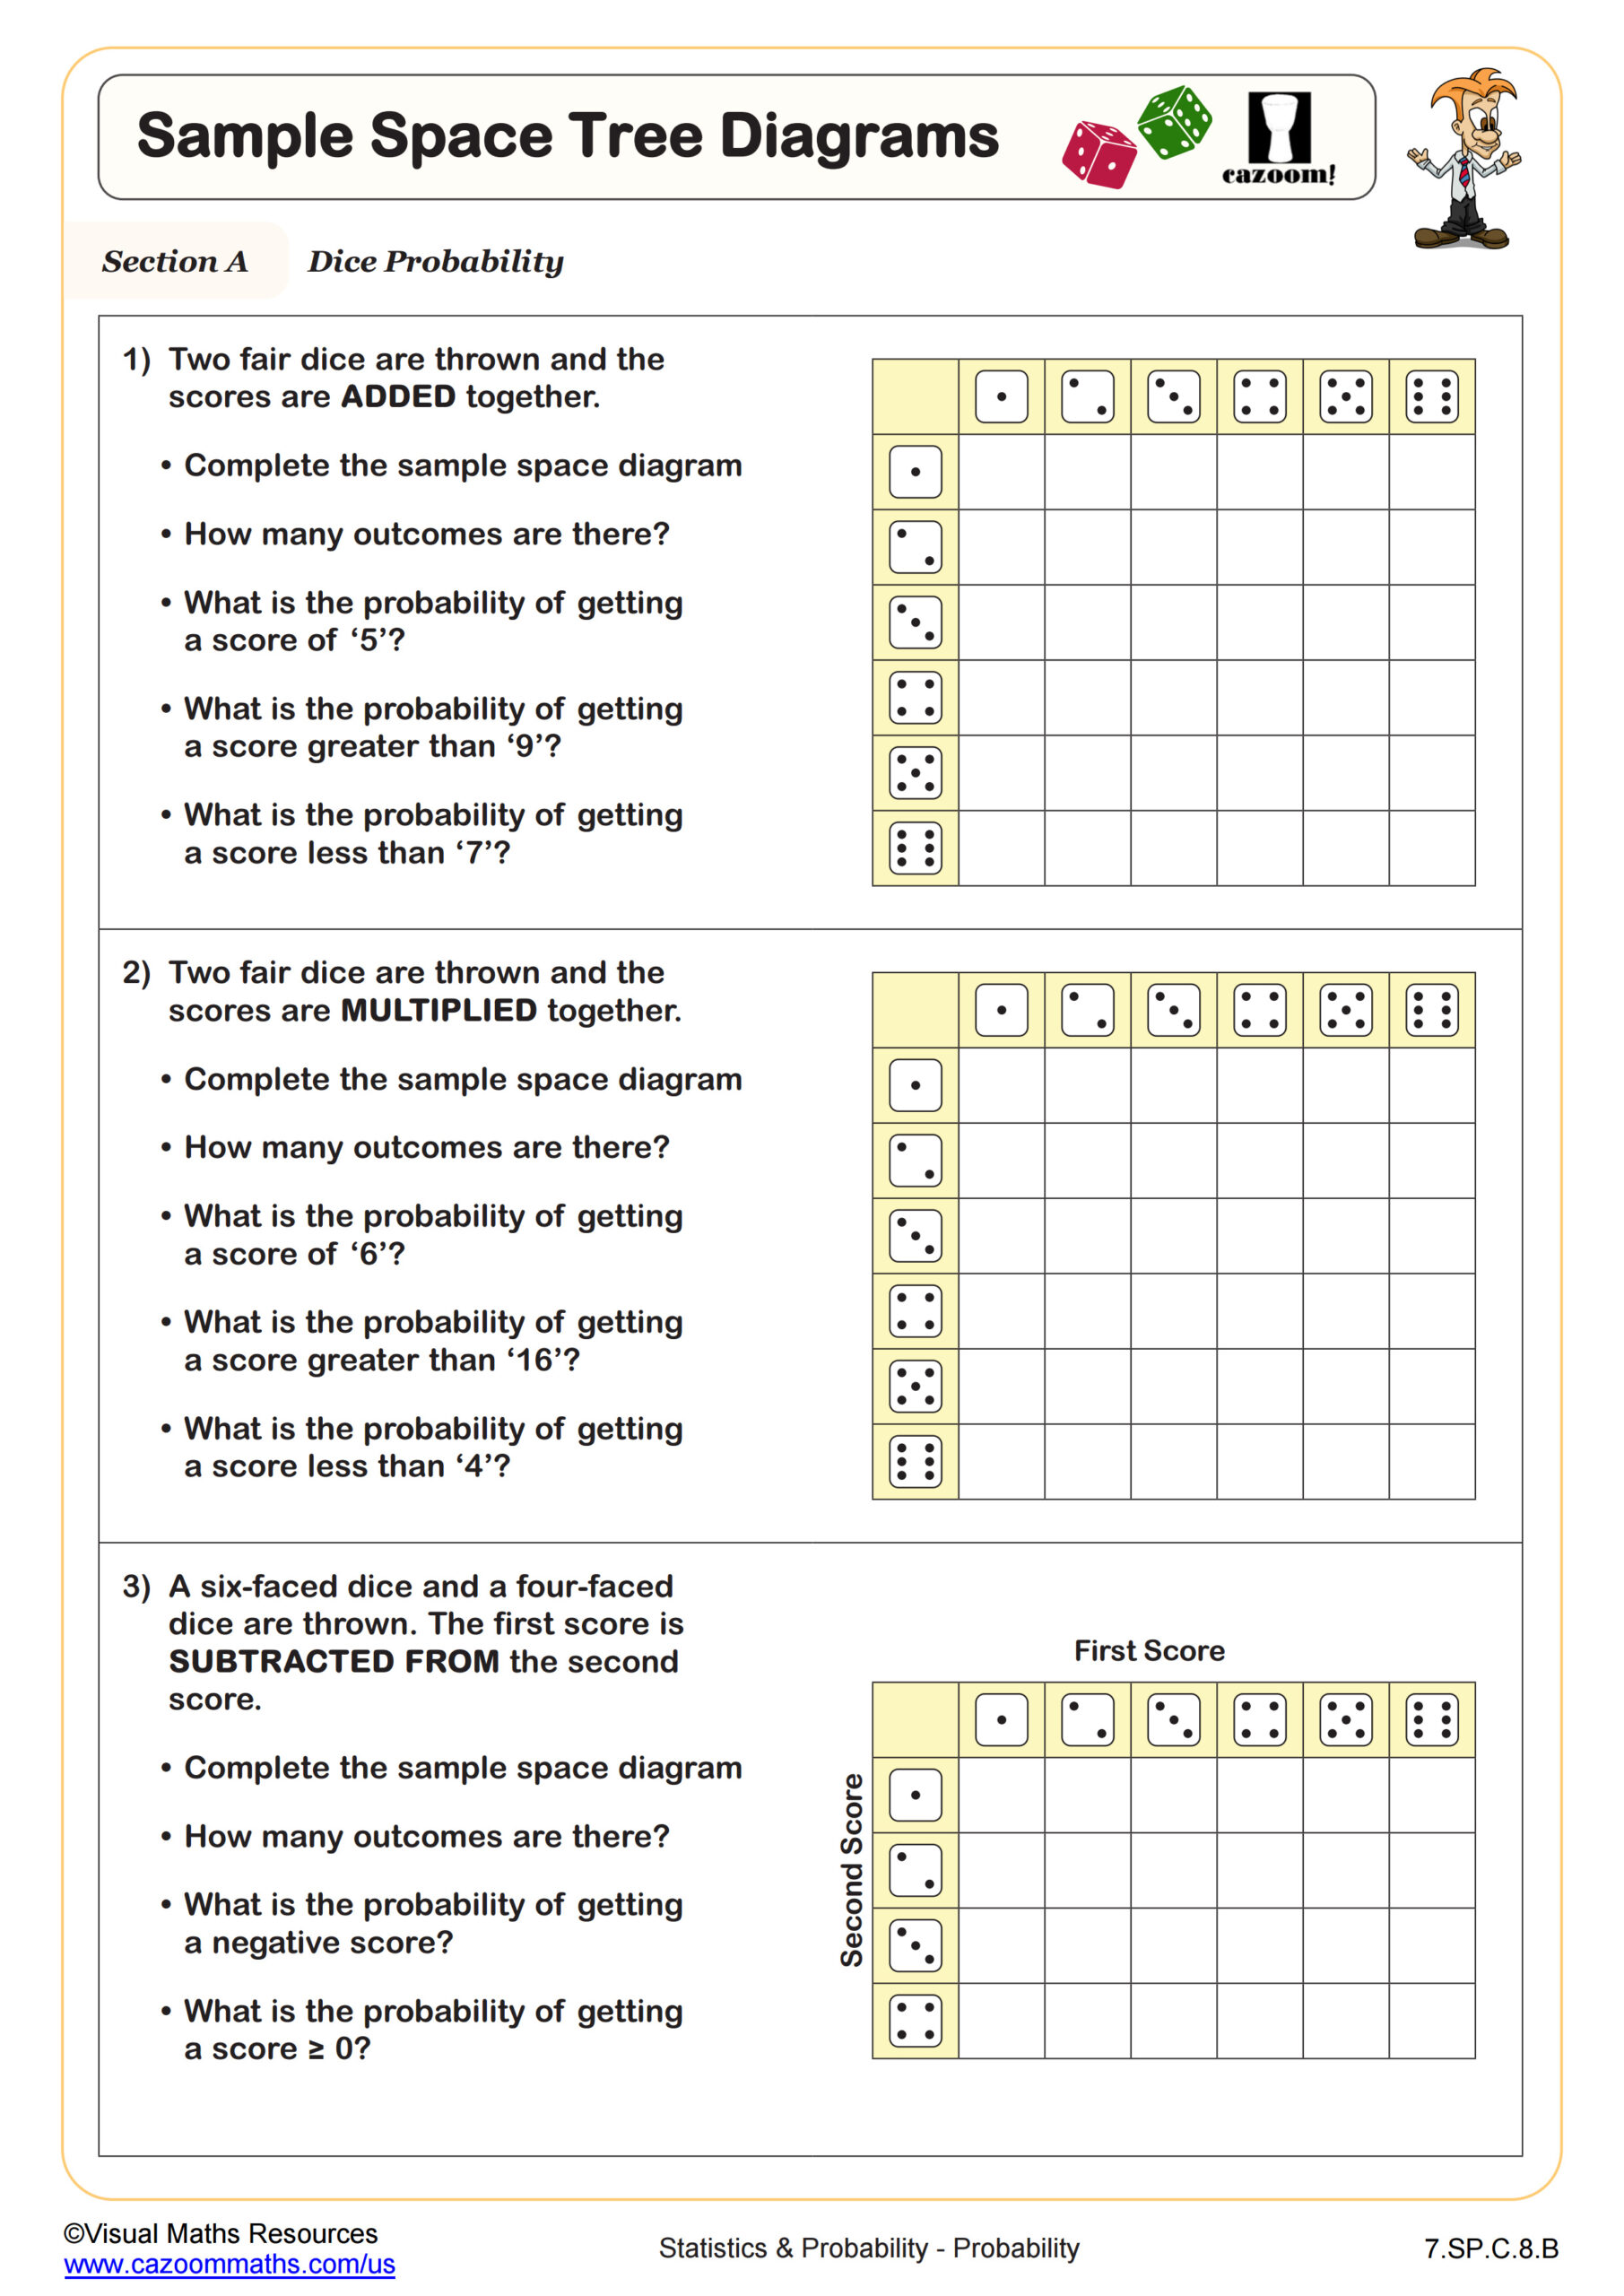
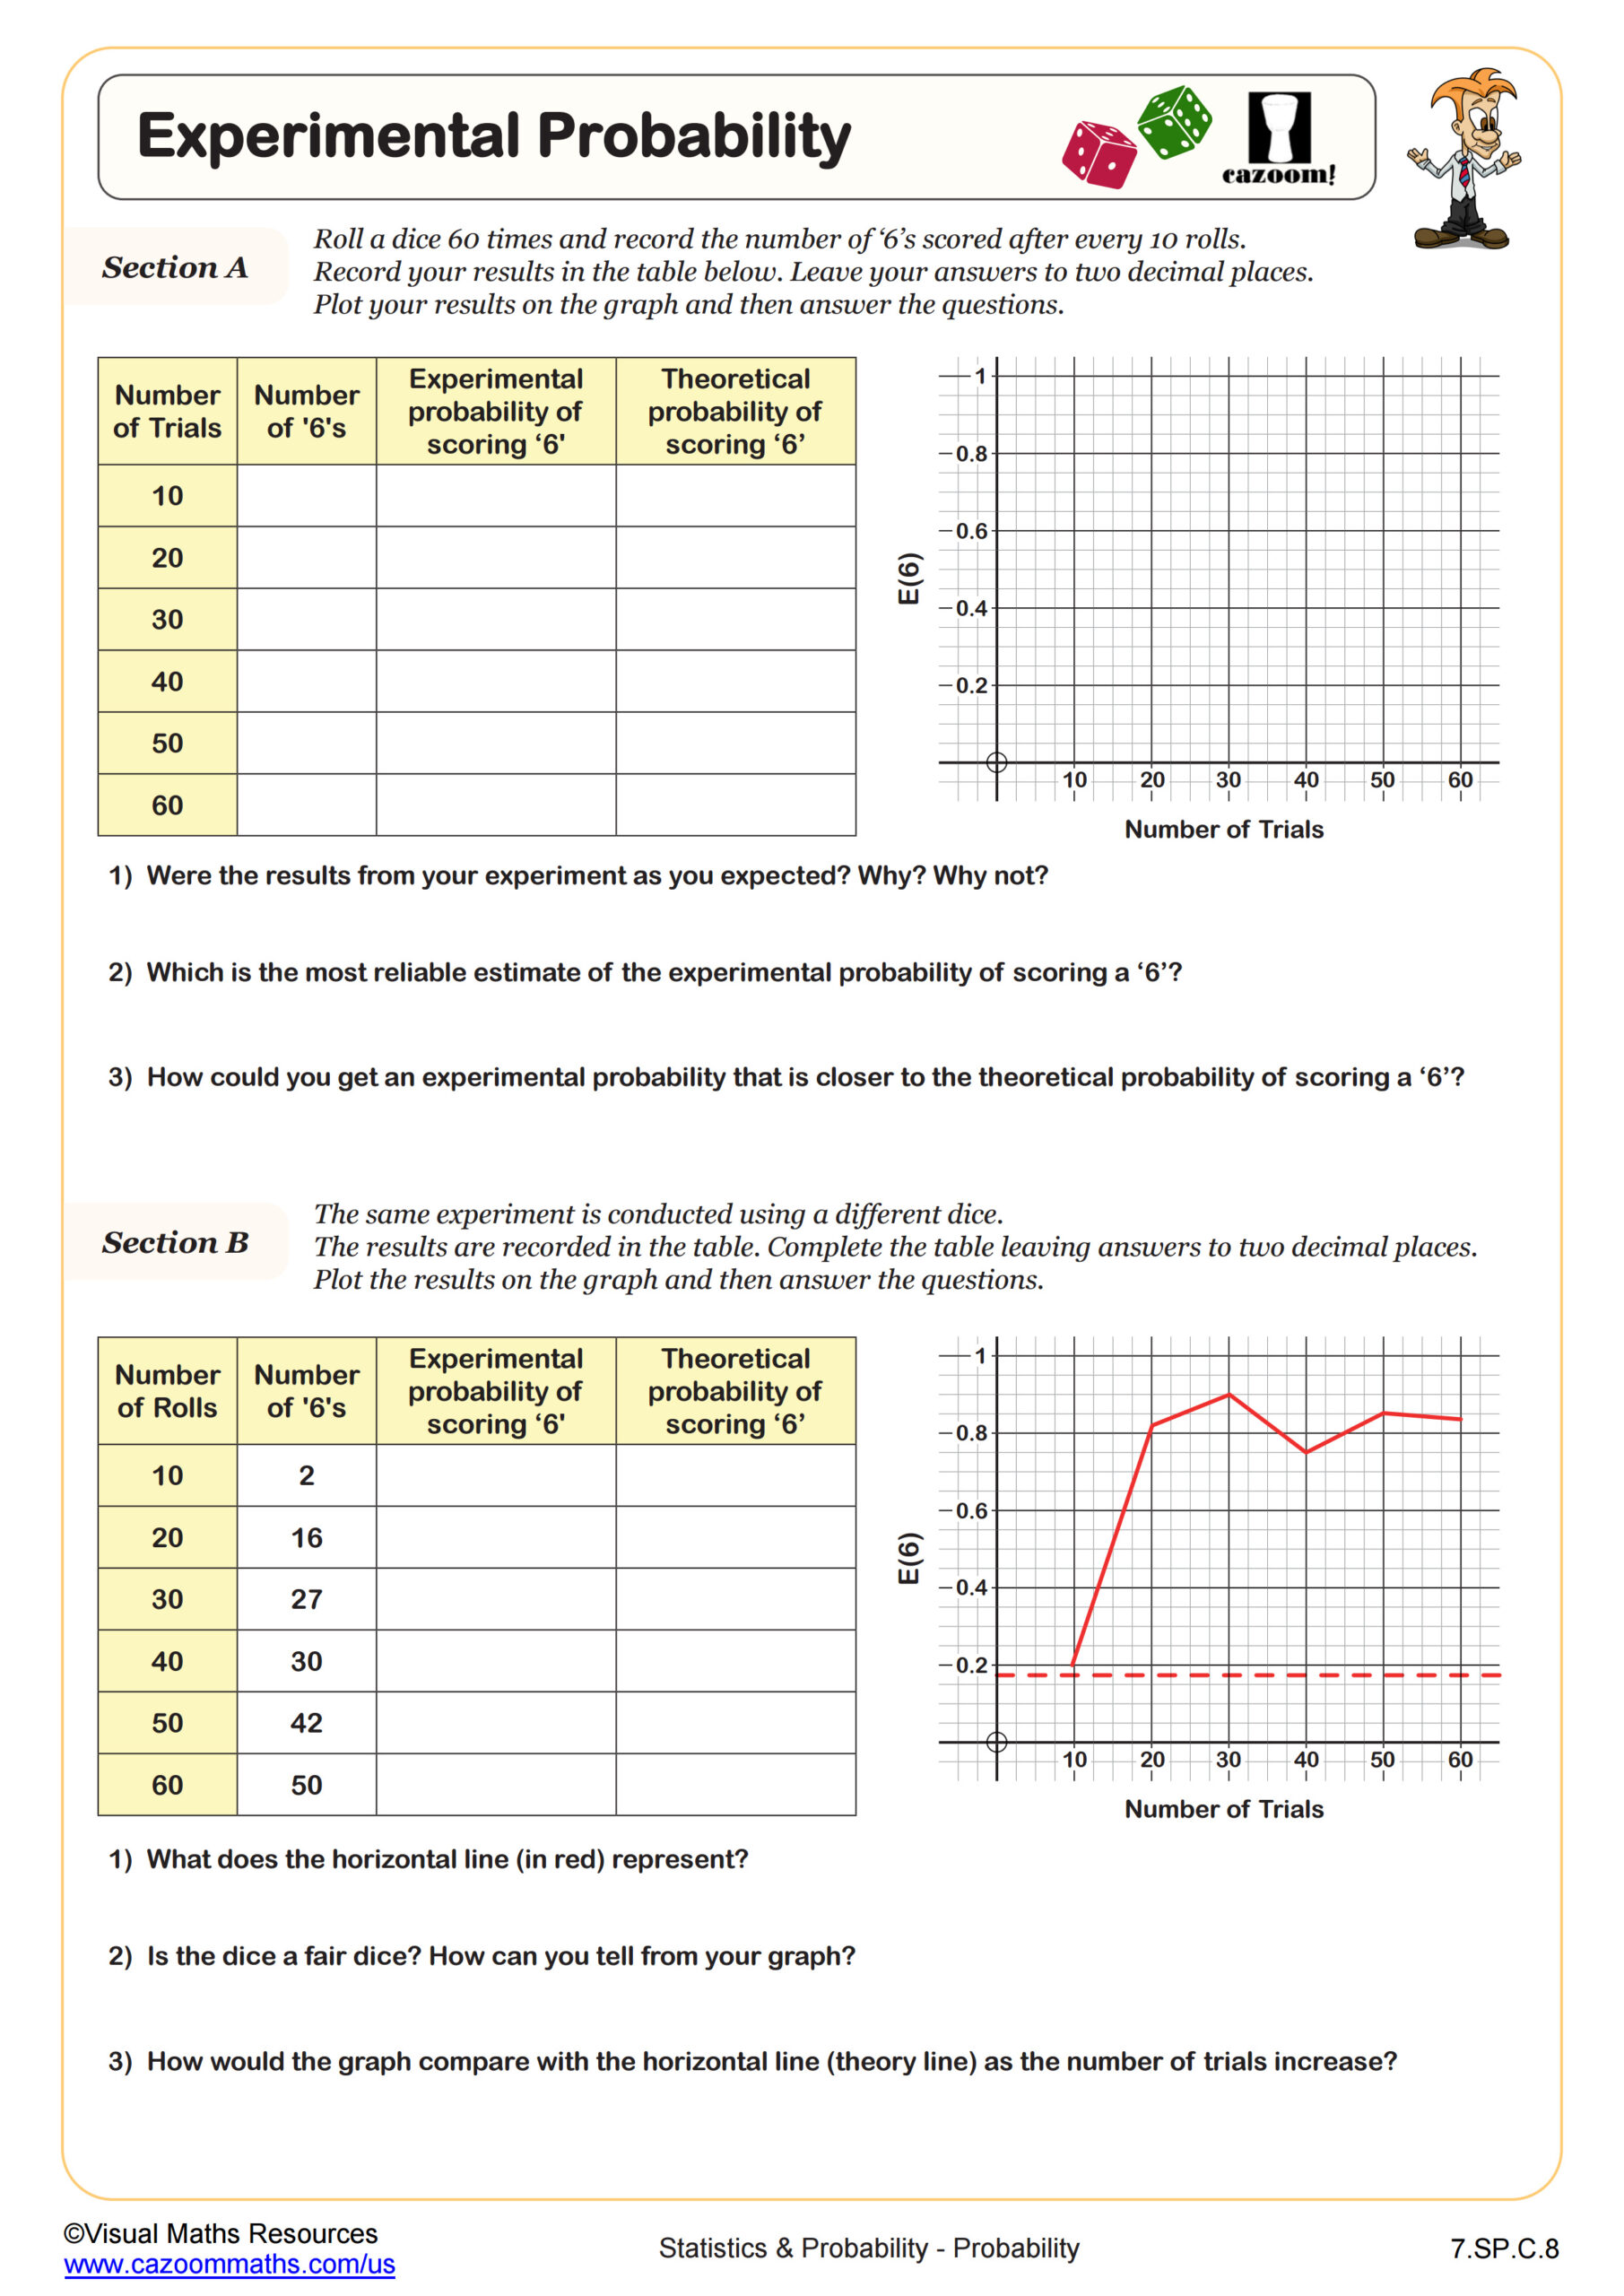
Throughout this worksheet, students will use experimental data to calculate relative frequencies and use these to answer questions about the data provided.
In section A, data from two experiments is provided: rolling a dice 200 times and spinning a spinner 120 times. Learners will use the results to calculate the experimental probability of each possible outcome. This data is then used to calculate expected frequencies and discuss whether the dice and spinner used were fair or biased.
Studnets will again calculate the relative frequency of outcomes from two experiments in section B. The experimental data for one event shows the relative frequency changing over time. Students will consider this where answering the questions in section B.
Calculators are required.
All worksheets are created by the team of experienced teachers at Cazoom Math.

RELATED TO Relative Frequency WORKSHEET
.jpg?w=3840)
Frequently Asked Questions
This relative frequency worksheet is designed for students in 7th Grade and aligns with Common Core State Standards.